2019 U.S. Transportation
RANKING THE TOP 100 METRO AREAS
IN THE UNITED STATES
DOWNLOAD THE TOP 100WATCH WEBINAR


When enthusiastic mobility experts say that transportation has the power to change the world, that’s not an exaggeration.
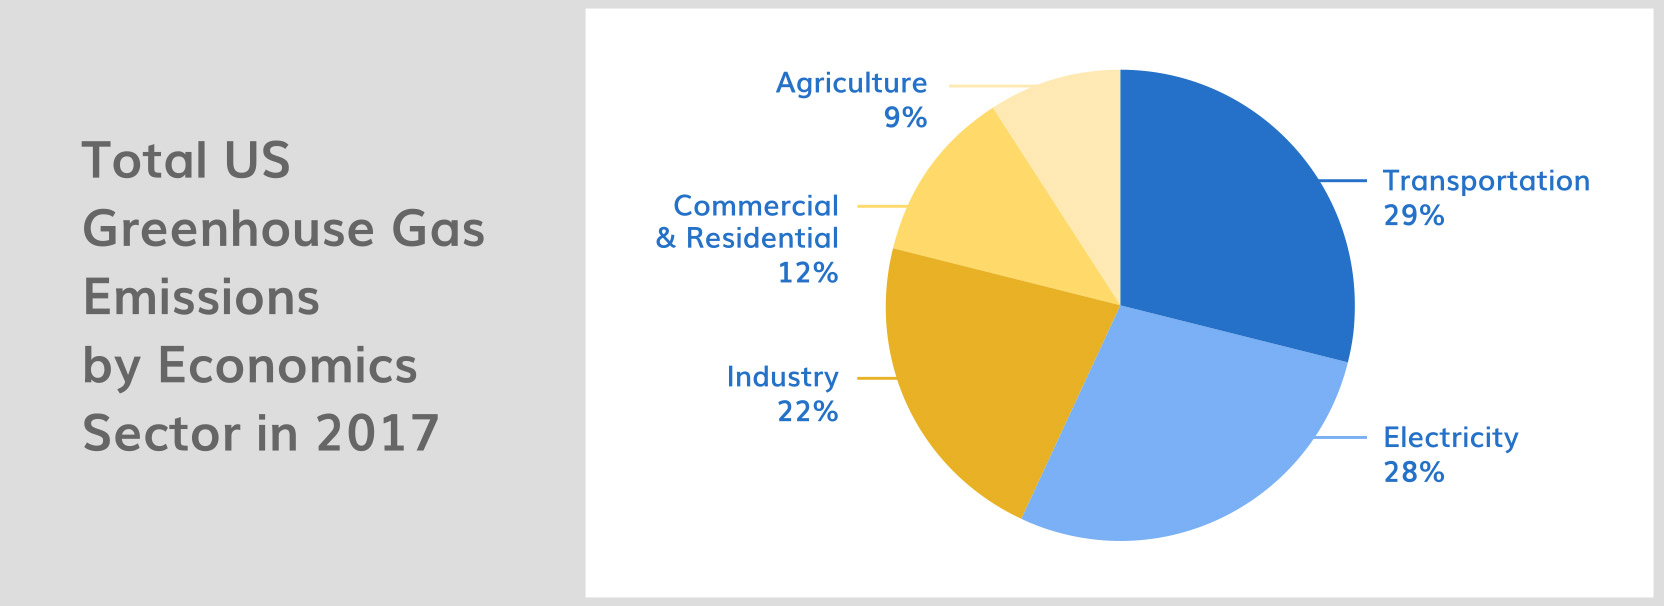
Burning fossil fuels for transportation is the top contributor to greenhouse gas emissions in the United States1, and the U.S. is second only to China as the world’s top greenhouse gas producer2. The world is setting new emissions records every year3, which puts our country’s transportation experts and city planners in the driver’s seat.
In our first annual U.S. Transportation Climate Impact Index, we rank the country’s 100 most populous metro areas. Our data scientists analyzed several carbon-related transportation factors, including VMT, bicycle and pedestrian commutes, and circuity.
How well is your region doing?
Rather than study traditional design-based measures (like, how many miles of bike paths exist) our list draws on performance-based metrics (how much actual bike commuting people do). Big Data captures real-life mobility behavior. In other words, you may have built it, but did they come?
Our fresh perspective highlights the tight connection between transportation and urban planning, and offers insights into how cities can offset their carbon output.
The Top 10 Metro Areas
For our list, the factors ultimately boiled down to car travel vs. lower-carbon alternate modes.
We ranked the country’s largest metro areas from 1 (best) to 100 (worst) on six individual factors: VMT, bike commuting, pedestrian commuting, transit ridership, population density, and circuity
(click here for our methodology).
Why did we choose metro areas instead of cities? Because the metro area reflects the full stage upon which people’s transportation life happens, and decisions in one area have impact throughout.
For example, a dense vibrant downtown may have low car use and high walking, but if housing prices and availability force its workers to live 30 miles away, that’s not low carbon impact. That’s why you won’t see some stereotypically “green” cities here.
Our top metro areas have low VMT, high mileage in bike and pedestrian commuting, high per-capita transit use, high population density, and low circuity.
1. New York-Newark-Jersey City
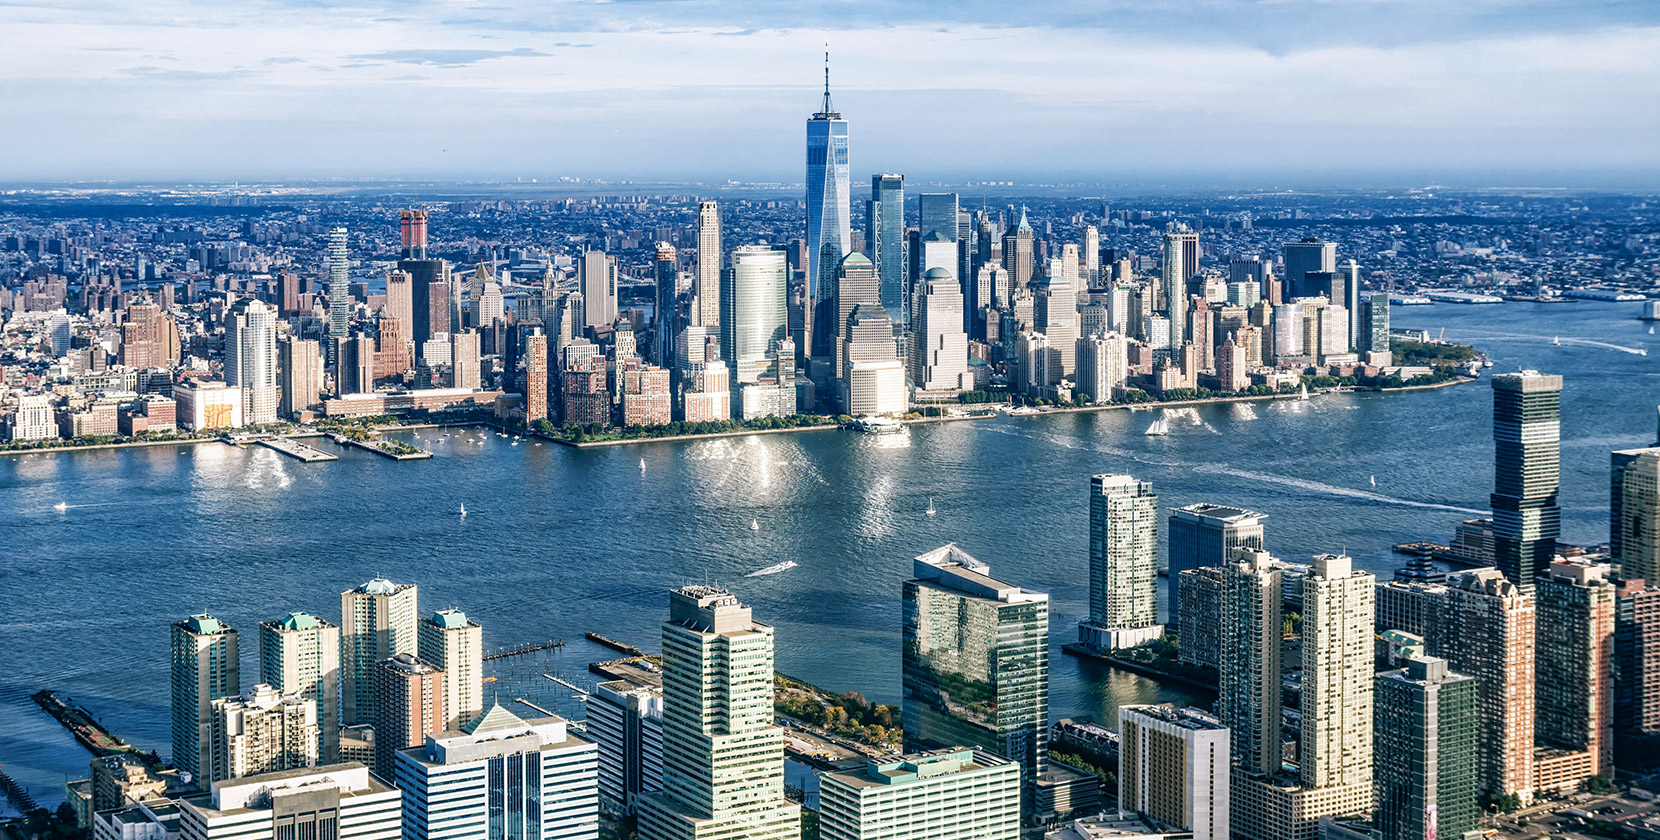

The New York City metro area tops our list, even with very high level of VMT. Car commuters may drive notoriously long distances, but rail commuting and alternate-mode travel in the urban center makes up for those car miles.
In New York proper, as with a handful of other cities on our list, a car is widely considered to be a liability. Traveling via car is frustratingly slow, and parking is expensive. Personal vehicles parked in many residential areas must be regularly moved for street cleaning and other services.
Fortunately, New York makes alternate modes easy to substitute in. The extensive transit system is the most-used in the country. New Yorkers also top the country in walking, which is an easy mode choice in a city this dense.
With plans to continue adding bike lanes at a furious pace and implement congestion pricing for personal vehicles, New York is setting the pace for prioritizing alternate modes over cars.
2. San Francisco-Oakland-Hayward
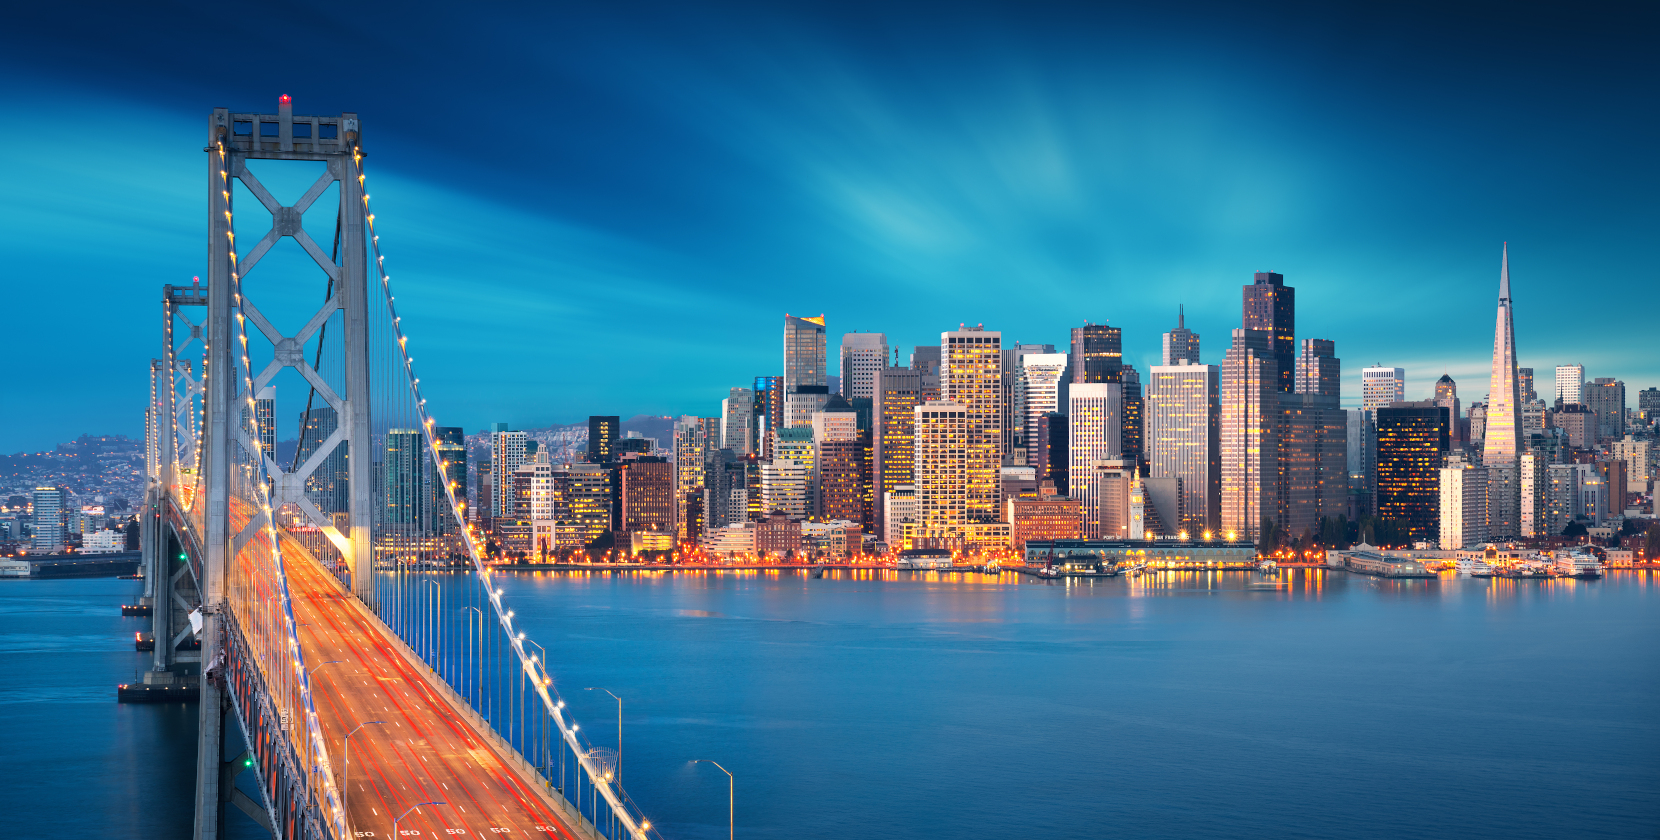

Despite the often clogged Bay Bridge and freeways full of commuters, the streets of San Francisco showcase new mobility transportation in all its sustainable glory: Bikes, pedestrians, scooters, skateboards and even hoverboards vie for space along the 1,260 miles of the city’s hilly roadway, while ride-hailing services carry travelers to and from bustling BART and Caltrain stops.
The newly reopened Transbay Transit Terminal became an instant architectural icon, housing numerous bus lines, a rooftop park and potential future rail connections. The Sunday Streets program made a bold stab at Vision Zero safety initiatives by closing streets to cars one day a month. Starting in January, the city’s famous Market Street will be permanently closed to private vehicles, while this city continues to add bike and pedestrian improvements at a frantic pace.
Due to its high levels of alternate mode use, San Francisco ranks second on our list with top-four scores for zero-emissions commuting, transit, and density.
3. Madison, WI


When Wisconsin rejected an $800 million federal grant to build high-speed rail between Madison and Milwaukee, that money was redirected to California. Madison’s rail dream may have withered, but this is a city with real dedication to sustainable transportation.
Much of Madison’s transportation planning discussion centers on highway improvements, but alternative transportation is making inroads. The Metro system is the 16th most-used transit network in the country, and students at the University of Wisconsin-Madison contribute high bike and pedestrian commuting scores.
In fact, Madison placed in the top third on every factor except population density, and was boosted by a top-10 VMT score. Madison may not be the best in any single category, but its classic Midwesterner “pretty darned good” scores across the board earned it a top spot on our list.
4. Philadelphia-Camden-Wilmington
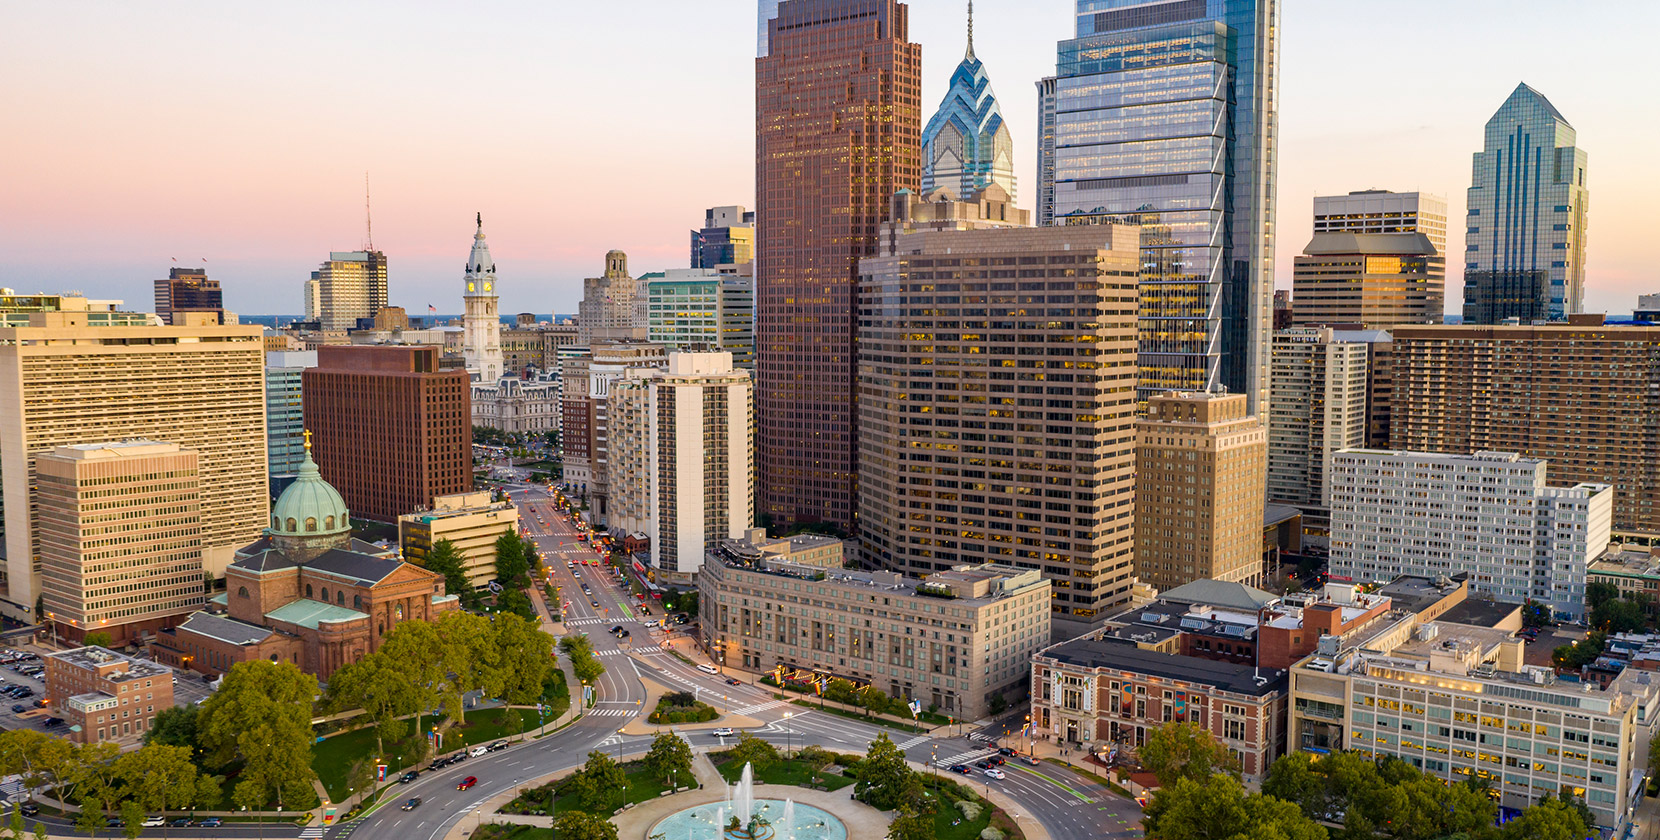

Philadelphia’s commuters bike more miles per capita than in any other city on our list, and the pedestrian commuters aren’t far behind. Yet Philly residents, politicians, and developers are currently debating the merits of protecting bike travel as pro-bike-lane house bill 792 moves through state congress.
With one of the lowest per-capita incomes on our list, Philly’s commuters gravitate to the comprehensive SEPTA transit network. Transit options include subway, hybrid-power buses, streetcars, and regional rail.
Additionally, the City of Brotherly Love earns a high ranking for population density, which helps pull it onto the top-10 list.
5. Boston-Cambridge-Newton


America’s college town has long been walkable, and the Big Dig project to sink Boston’s central artery underground made it even easier and safer for pedestrians to get around. South Boston and the Seaport have transformed from dark industrial buildings and parking lots into bustling residential and commercial centers.
Boston’s aging MBTA is the third most-used transportation system per capita in the country, and South Station is second only to Logan Airport as the area’s busiest transportation hub. Last April, Cambridge became the first city in the U.S. to make protected bike lanes mandatory on all city streets.
Although a recent series in the Boston Globe highlighted the city’s increasingly nightmarish congestion problems, metro Boston clearly offers enough transportation alternatives to make it a model of sustainability.
6. San Jose-Sunnyvale-Santa Clara
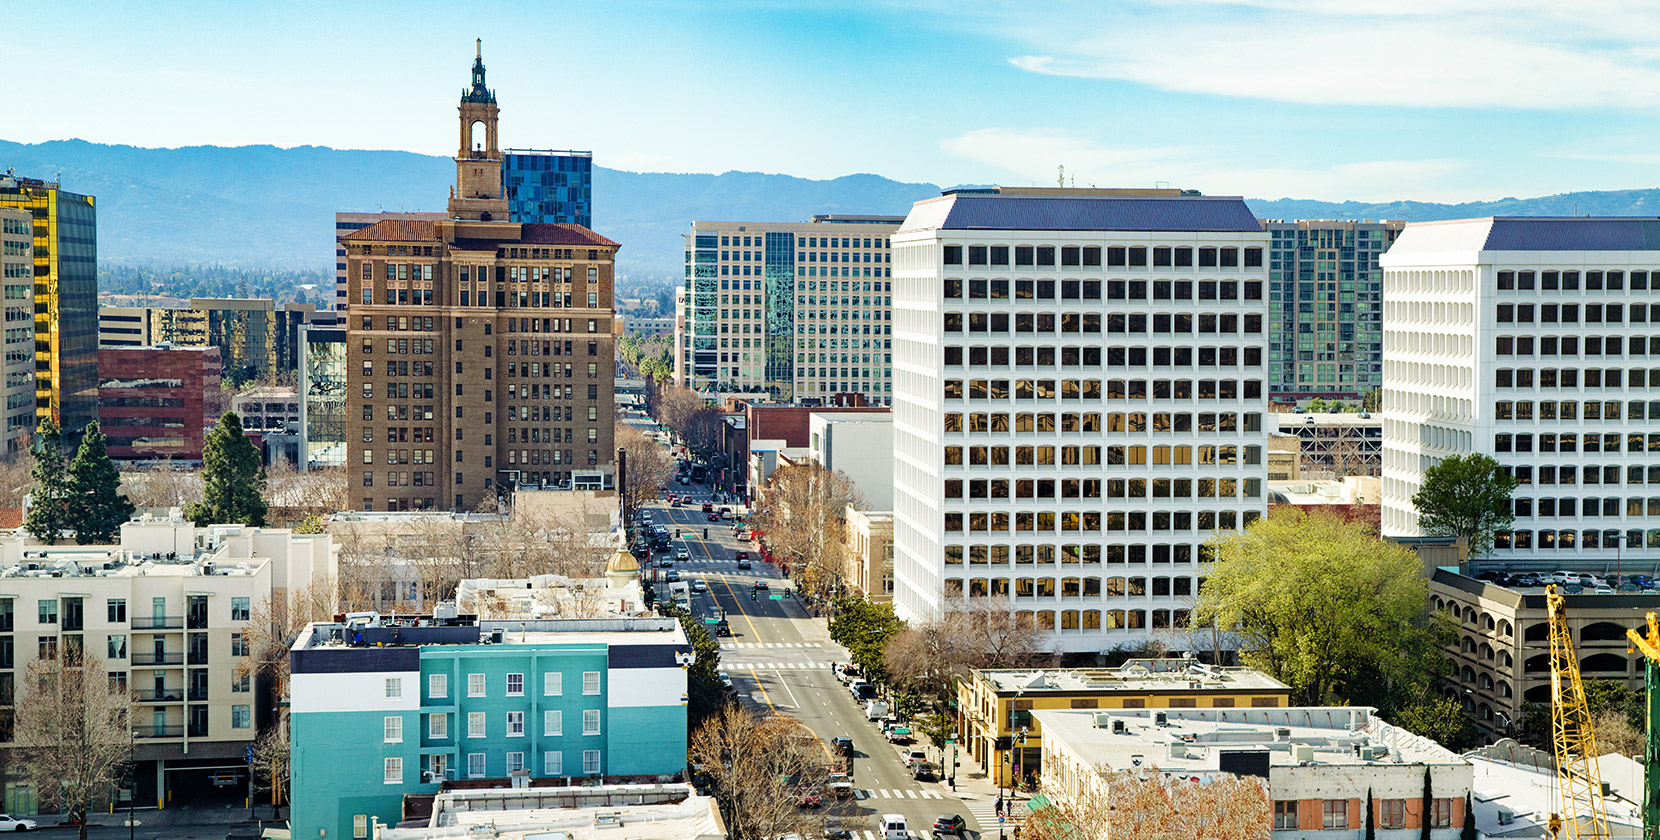

With the second highest per-capita income of any U.S. city (second only to Washington, DC), San Jose proves that disposable income doesn’t have to drive people into personal vehicles. Not only do travelers bike and walk, but the VTA system sees high use.
Although the highways are some of the most congested in the country, transit ridership continues to rise in the nation’s biggest tech hub. CalTrain recently approved a plan to run a minimum of eight trains an hour between San Jose and San Francisco, and BART plans to open new Silicon Valley stations.
Although San Jose’s VMT ranking is higher than San Francisco’s, car travel here is offset by strong bike commuting and population density scores. Given a differently defined boundary, the combined metro area of San Francisco and San Jose might have topped our list.
7. Des Moines-West Des Moines
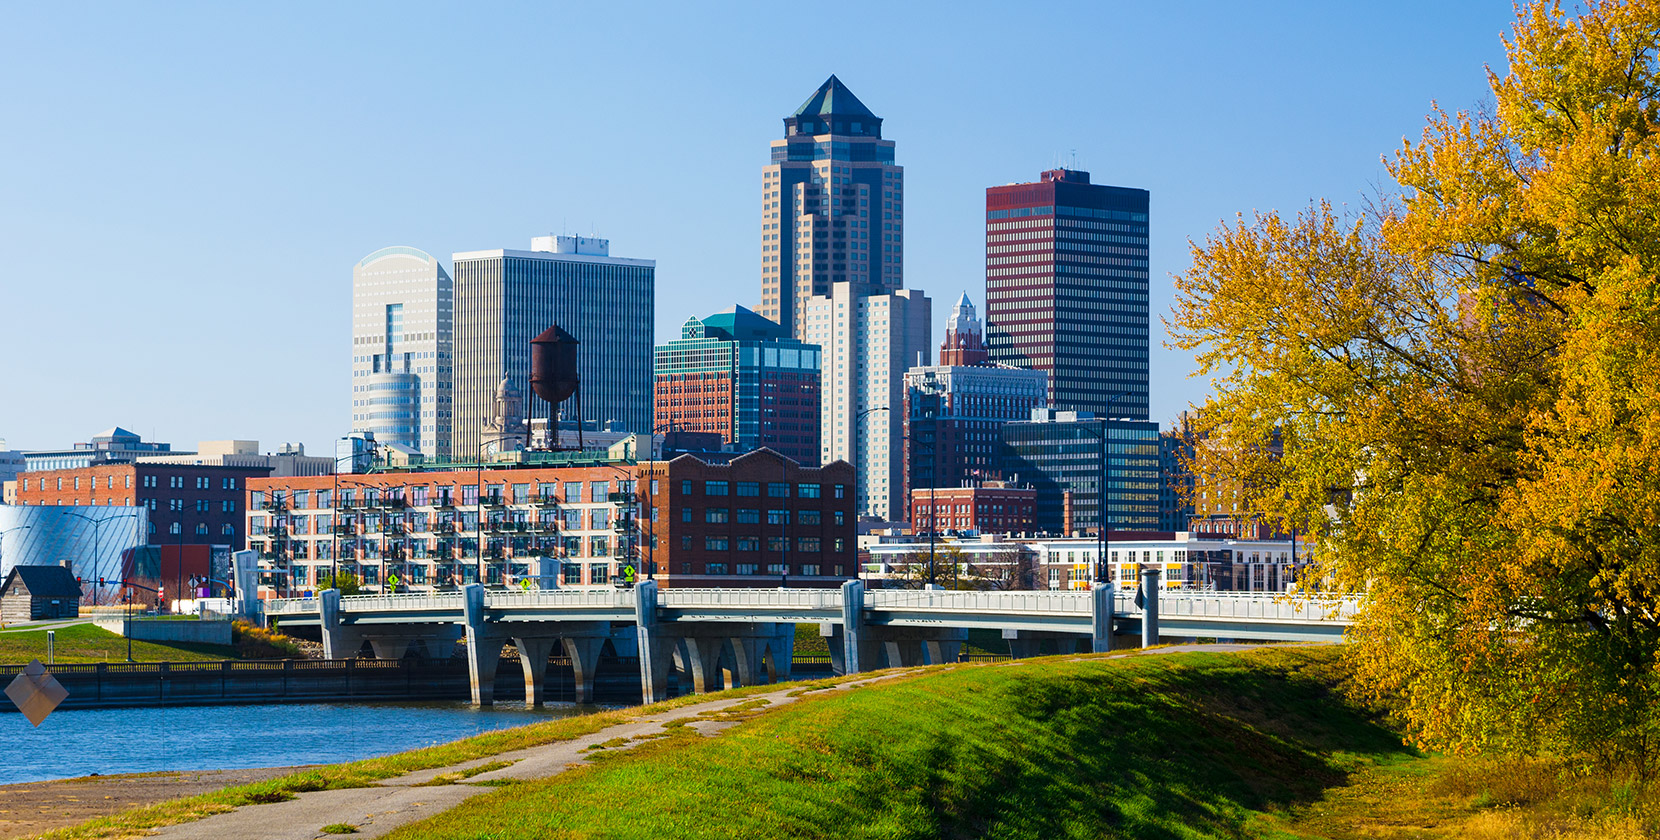

Des Moines is one of two cities with a zero transit score to make our top 10, which means they are nailing green transportation even with a handicap. High biking scores and good pedestrian commuting contribute to this city’s overall position.
Although the DART system didn’t make APTA’s transit-use list, the city offers extensive public transit plus a free downtown shuttle service. Winter pedestrians are incentivized to walk via four miles of indoor aerial skyways connecting downtown buildings, and the city has nearly 200 miles of on-street cycling paths.
Iowa governor Kim Reynolds recently made significant changes at the DOT, citing an unspecified “new direction” as the reason. Hopefully Iowa’s largest city won’t change where it’s headed with low carbon impact.
8. Lancaster, PA
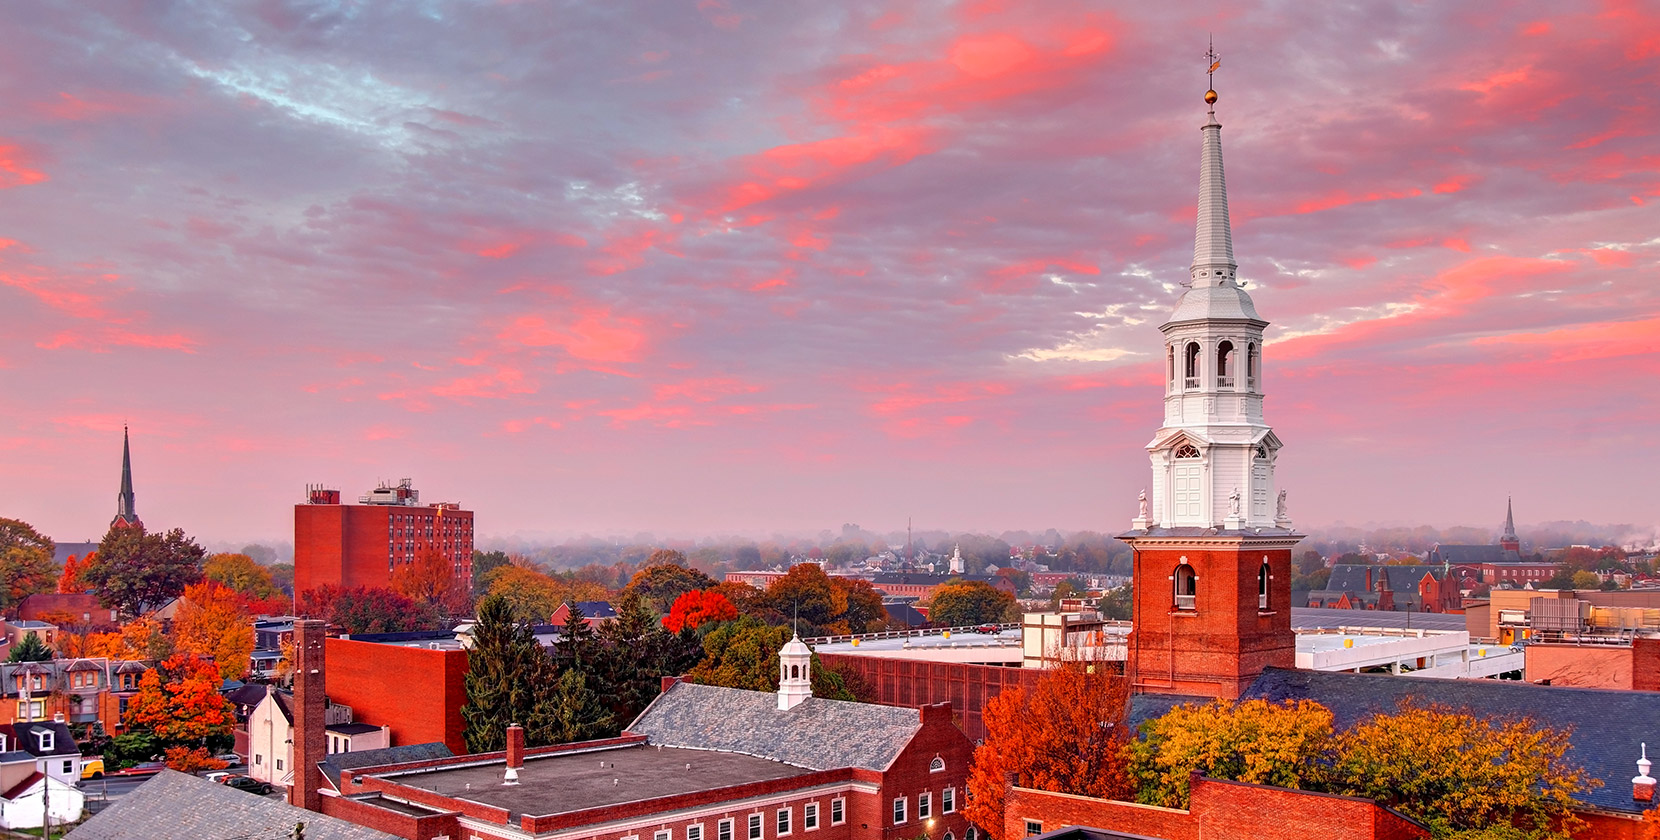

Lancaster has the best VMT and circuity of any other city on our entire list. Because VMT is weighted heavily in our rankings, the fact that Lancaster tops that category propelled it to our top 10 list despite low rankings in other fields.
For example, Lancaster has only a minimal bus and shuttle transit system, which isn’t ranked by APTA. Few people bike or walk to work, in fact Lancaster’s pedestrian commute ranking is one of the lowest on our list. But more than 3% of the population is Amish, many of whom travel by low-emission horse-drawn buggies.
Although not every region has the option to shift travel to this type of horsepower, Lancaster does showcase the impact of effectively managing a region’s VMT.
9. New Haven-Milford
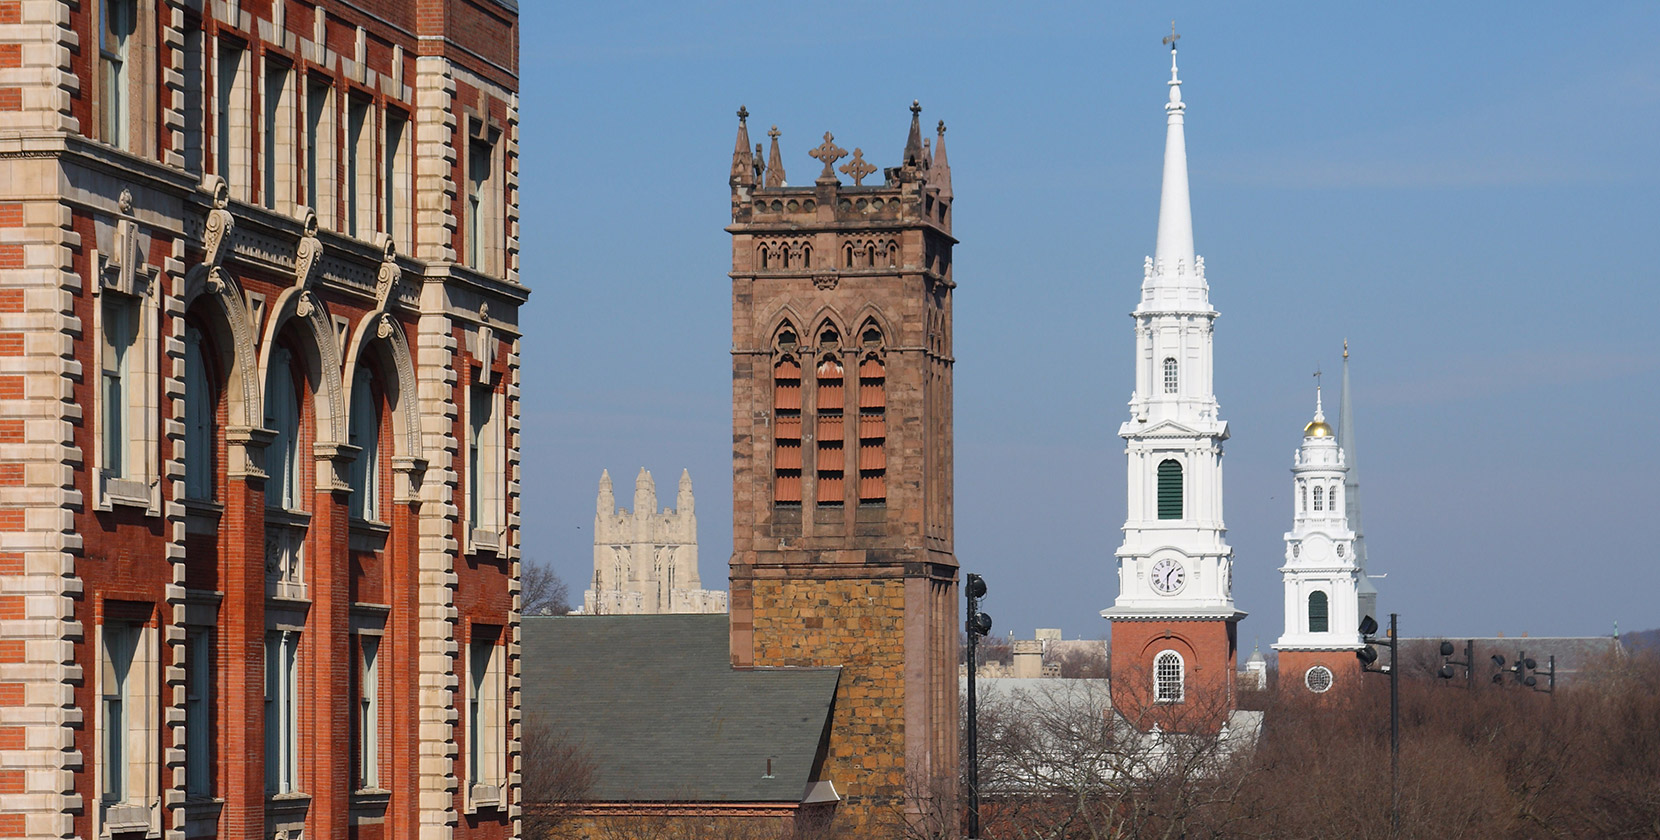

New Haven places in our top 10 despite having the worst circuity on the list. Those meandering car trips must be short, however, because New Haven has one of the country’s best VMT scores. Near Yale, many residents work within a short distance from their homes.
Drivers may also be traveling the first or last mile to board New Haven’s well-used bus and rail system. CT Transit expands bus routes every year, which connect with an extensive network of light rail lines.
Although New Haven proper is often hailed as a bike-centric city, our metrics show low bike commuting in the wider metro area. This locale makes the top 10 primarily on the strength of strong VMT and transit ratings.
10. Buffalo-Cheektowaga-Niagara Falls
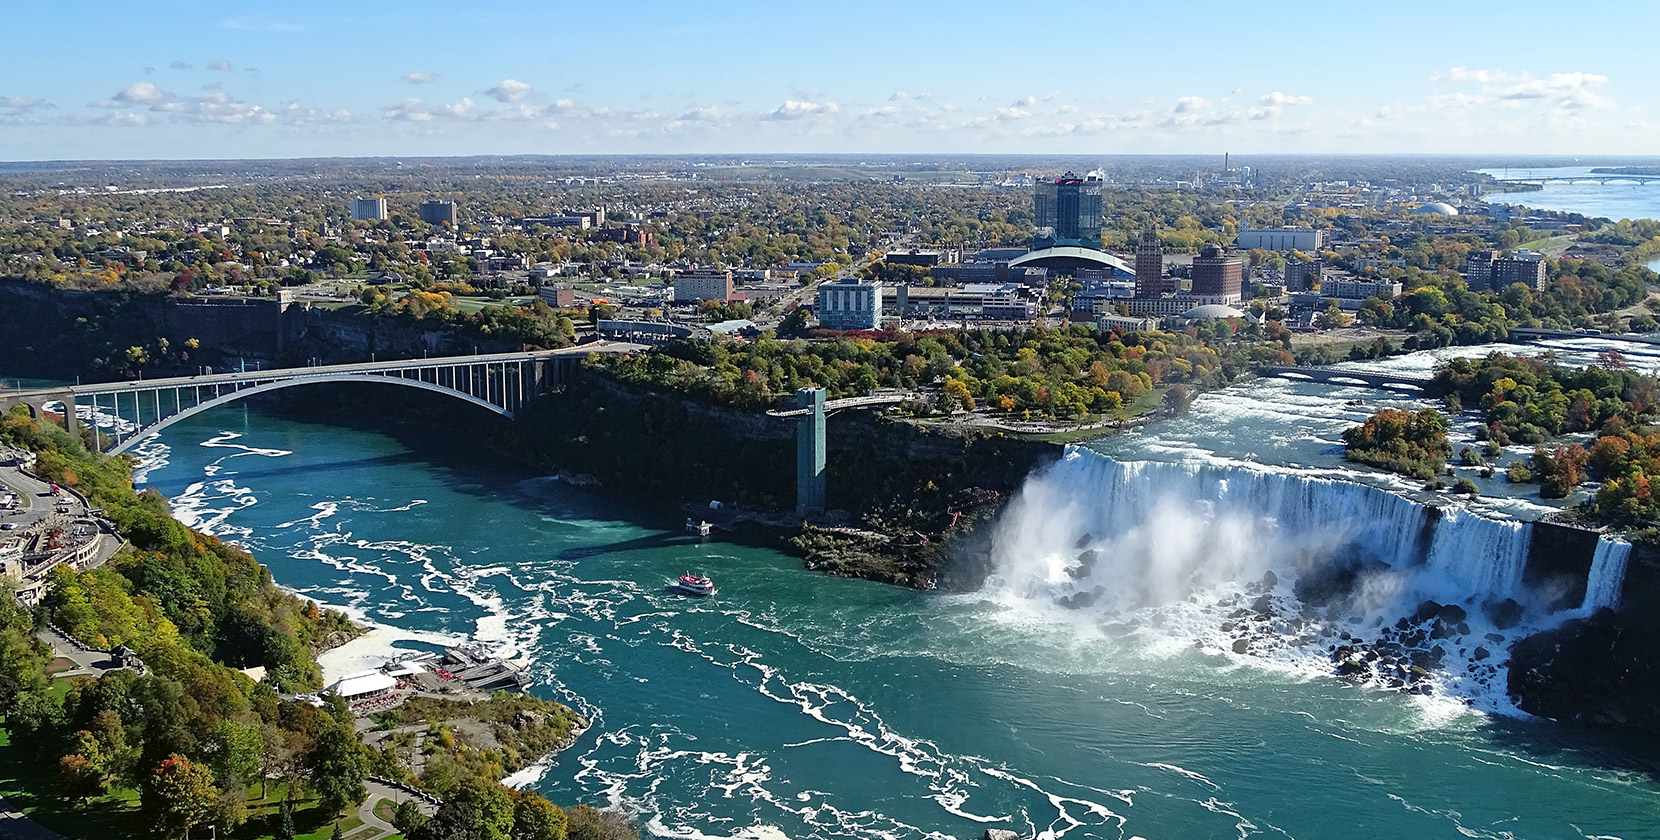

The cold winters and snow may be legendary, but Buffalo’s dedicated bike and pedestrian commuters log enough miles to put their city in the top 20 on those metrics. Several bike share programs service the city and state university campuses. Although it is more used by seasonal tourists than commuters, Buffalo also offers the only bike ferry on our list.
A high percentage of Buffalo commuters use the NFTA-Metro system, perhaps due to the free service along the above-ground section downtown. Buffalo scores highly for both transit and population density.
Buffalo’s strong rankings in bike, pedestrian, and transit are supported by a top third VMT score, showing that travelers will shift to alternate modes even in bad weather
1 Inventory of U.S. Greenhouse Gas Emissions and Sinks: 1990 – 2017, Environmental Protection Agency.
2 Emissions Gap Report 2019,, United Nations.
3 Global Carbon Budget,, Global Carbon Project.
The Bottom 10
The transportation dynamic in each metro area is complex, with numerous factors that we did not analyze. But what these metros share are high VMT levels, without those car miles being offset by transit, bike, or pedestrian transportation. These geographies also tend to sprawl, with suburban residents living and driving far to reach their destinations.
- Dallas-Fort Worth-Arlington, TX
- Phoenix-Mesa-Scottsdale, AZ
- Houston-The Woodlands-Sugar Land, TX
- St. Louis, MO-IL
- Kansas City, MO-KS
- Indianapolis-Carmel-Anderson, IN
- San Diego-Carlsbad, CA
- Cleveland-Elyria, OH
- Cincinnati, OH-KY-IN
- Atlanta-Sandy Springs-Roswell, GA
Learn More About the Climate Impact Index

The Complete List: Top 100 Metros and How They Rank
Best and Worst: Rankings by Key Indices

Climate Index Methodology