Continuing our work with strategic partner Boston Consulting Group, we are sharing their latest COVID-19 analysis. BCG helps transportation industry professionals apply data to decision making, particularly during the current volatile travel patterns.
This analysis builds on BCG’s Trip Reduction Index, which analyzed COVID-19’s impact on vehicle miles traveled. In this second analysis, BCG shares slides analyzing changes in VMT by state, county, and MSA, then grouped them into four archetypes based on VMT patterns.
Urban Areas: Bigger Drop and Slower Rebound
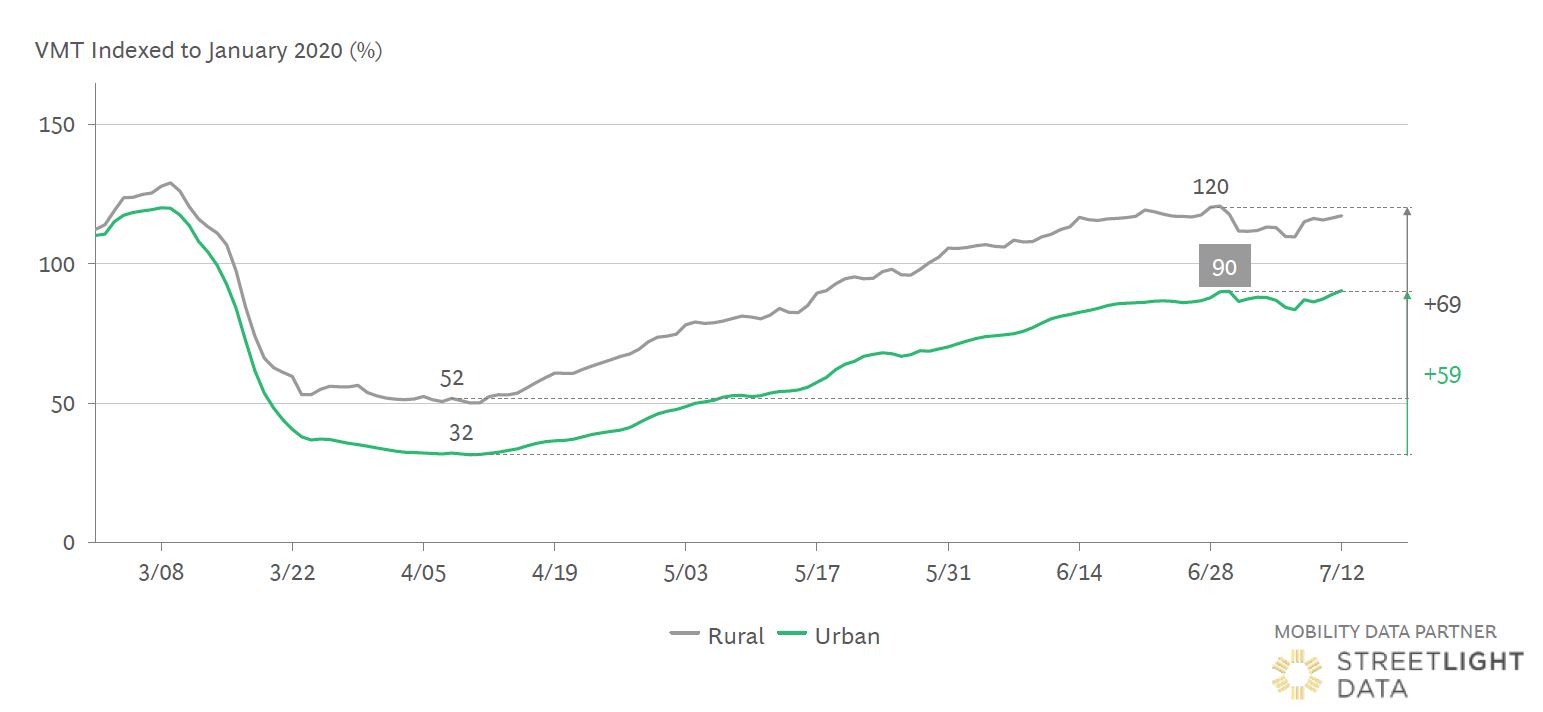
Figure 1: VMT bottomed out in early April and rebounded in rural counties. Urban counties saw both a bigger drop and slower rebound.
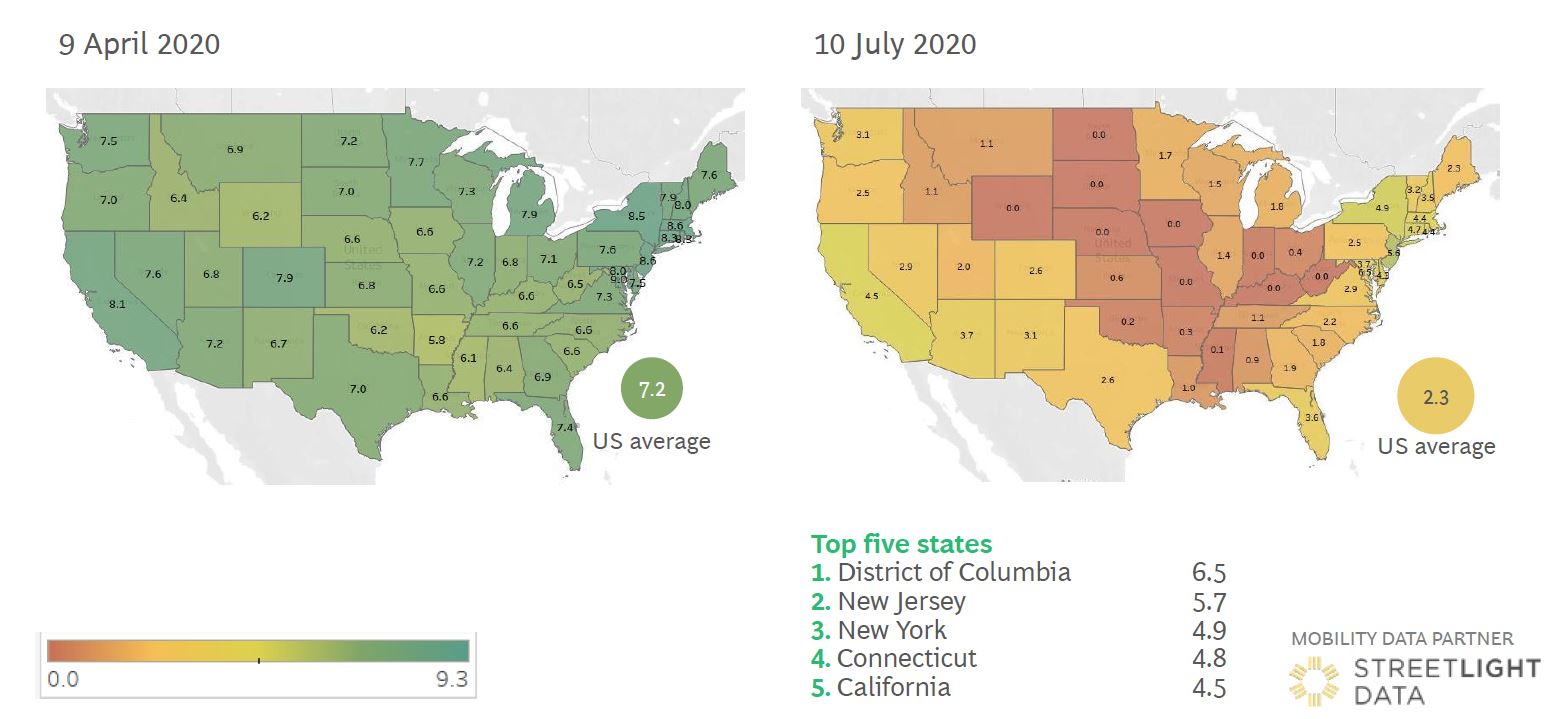
Figure 2: Trip reduction indicates VMT reduction versus January average values. Most states rebounded through early July, with the Northeast and California standing out as the areas with the largest remaining drop.
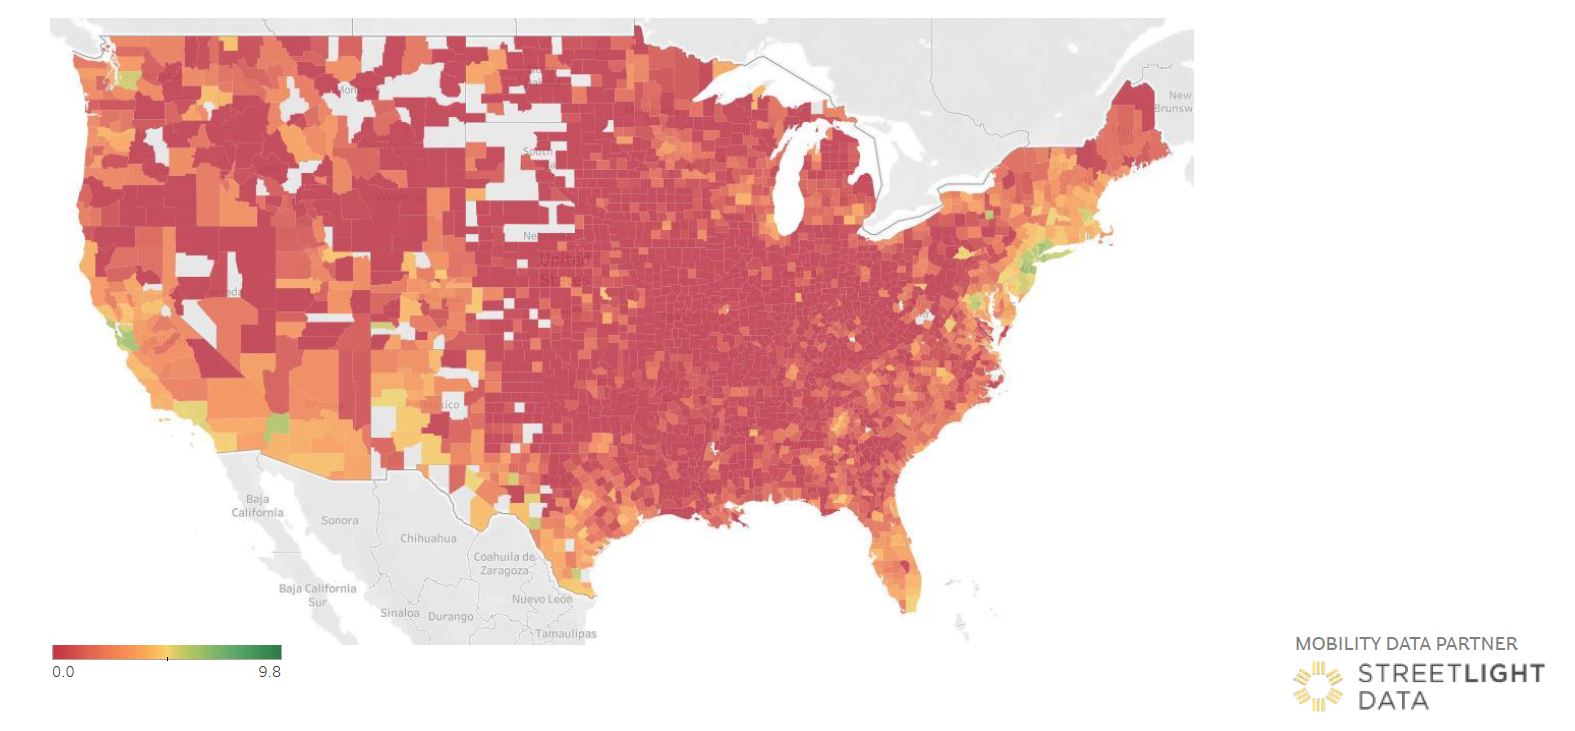
Figure 3: Trip reduction index by county on July 10, 2020.
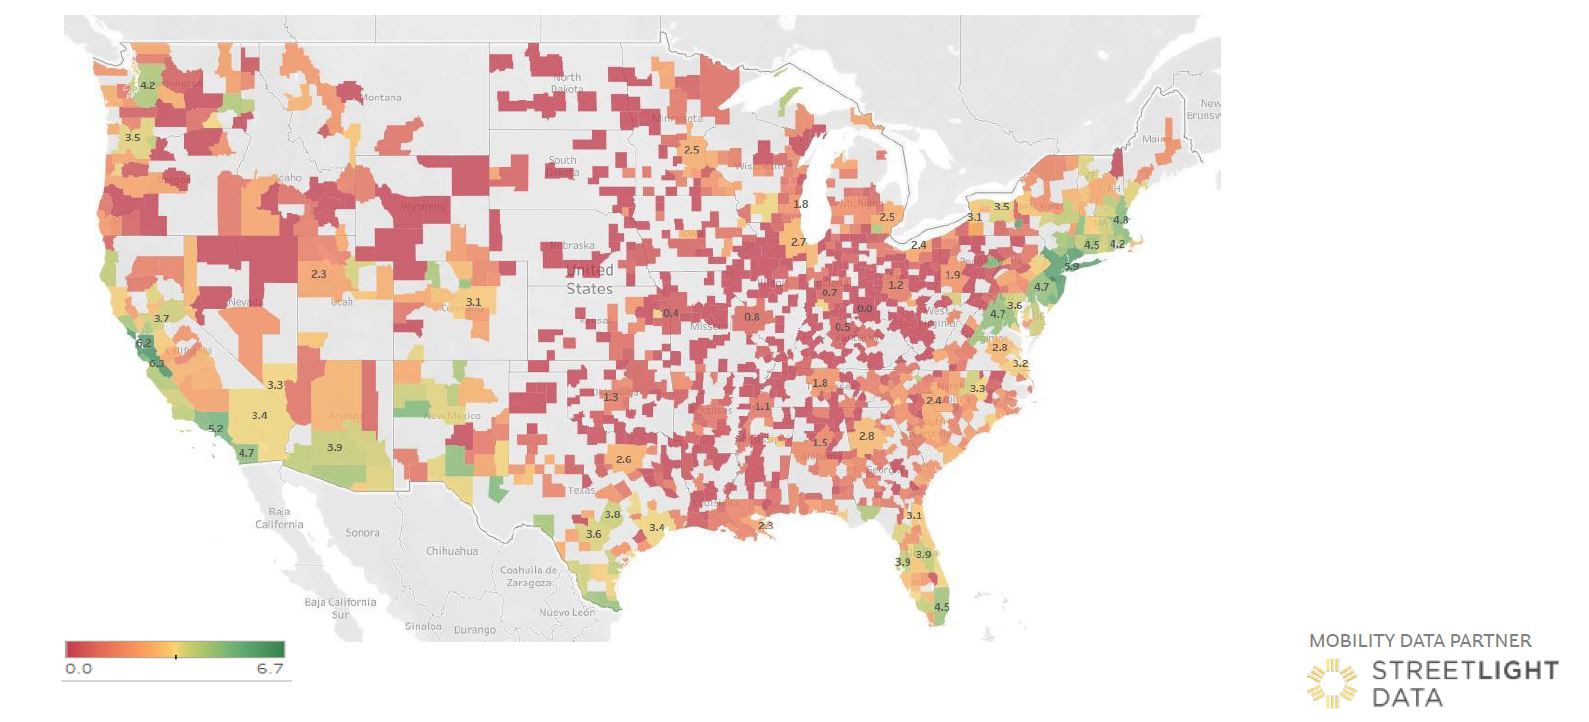
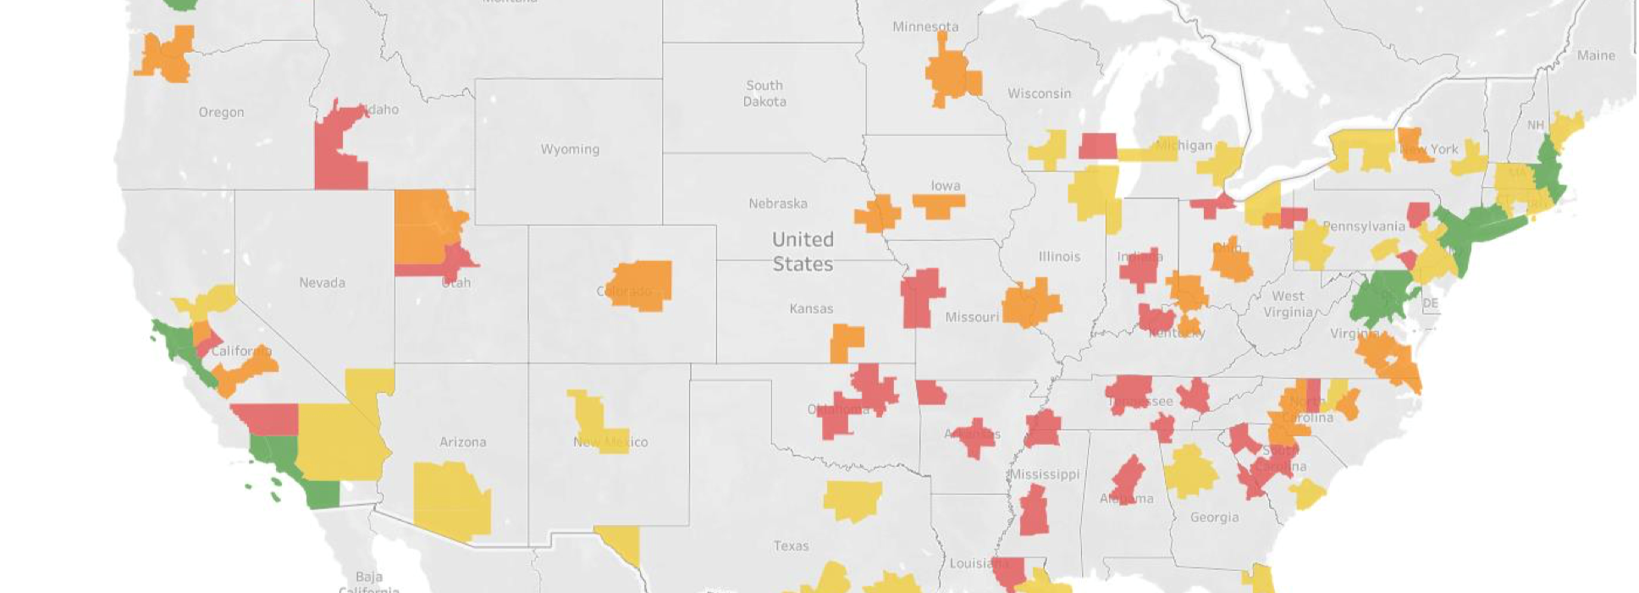
Figure 4: Trip reduction index by MSA on July 10, 2020.
Four Varied Recovery Patterns by State
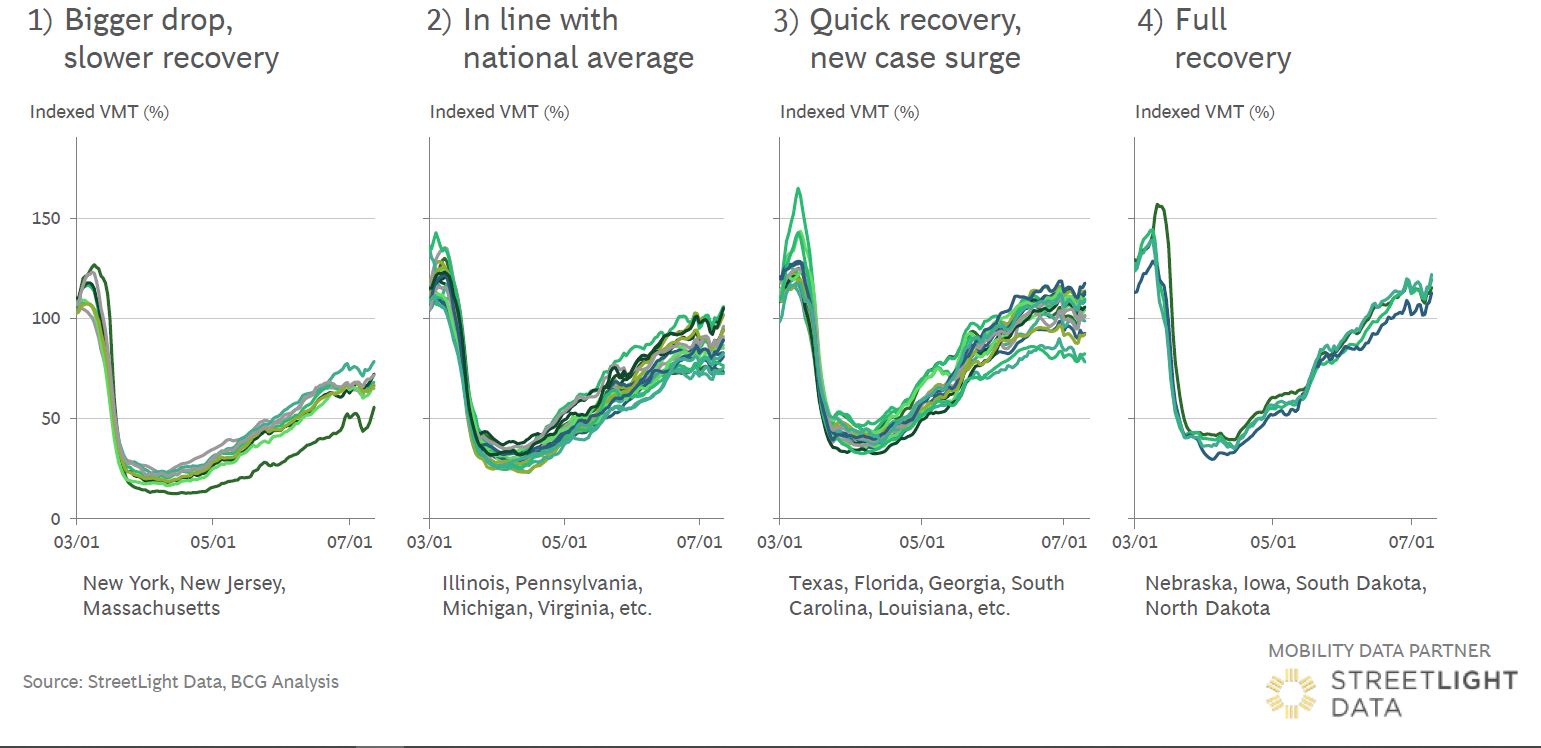
Figure 5: The VMT development varies quite a bit by state. We grouped the states into four archetypes.
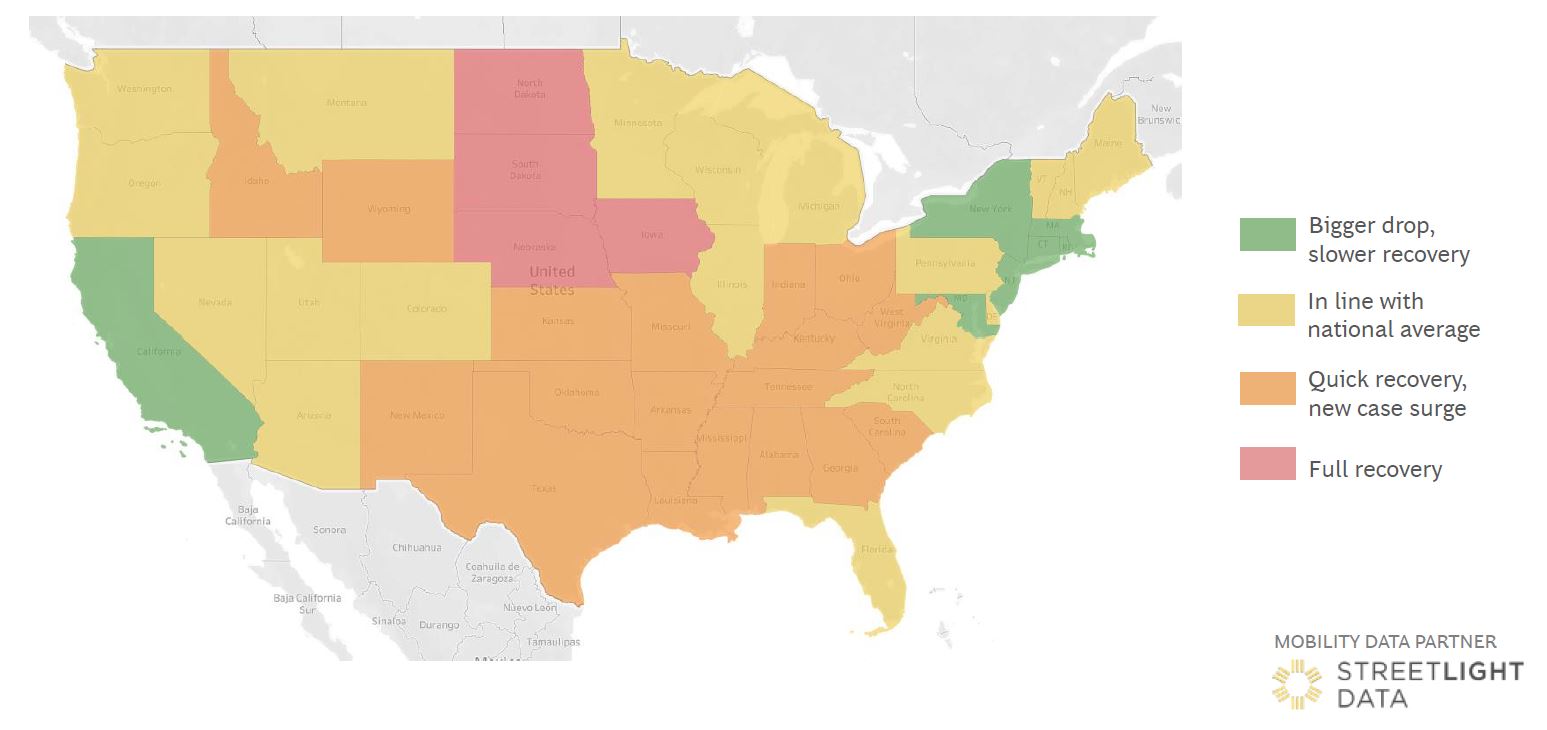
Figure 6: Regional clusters formed around the four archetypes.
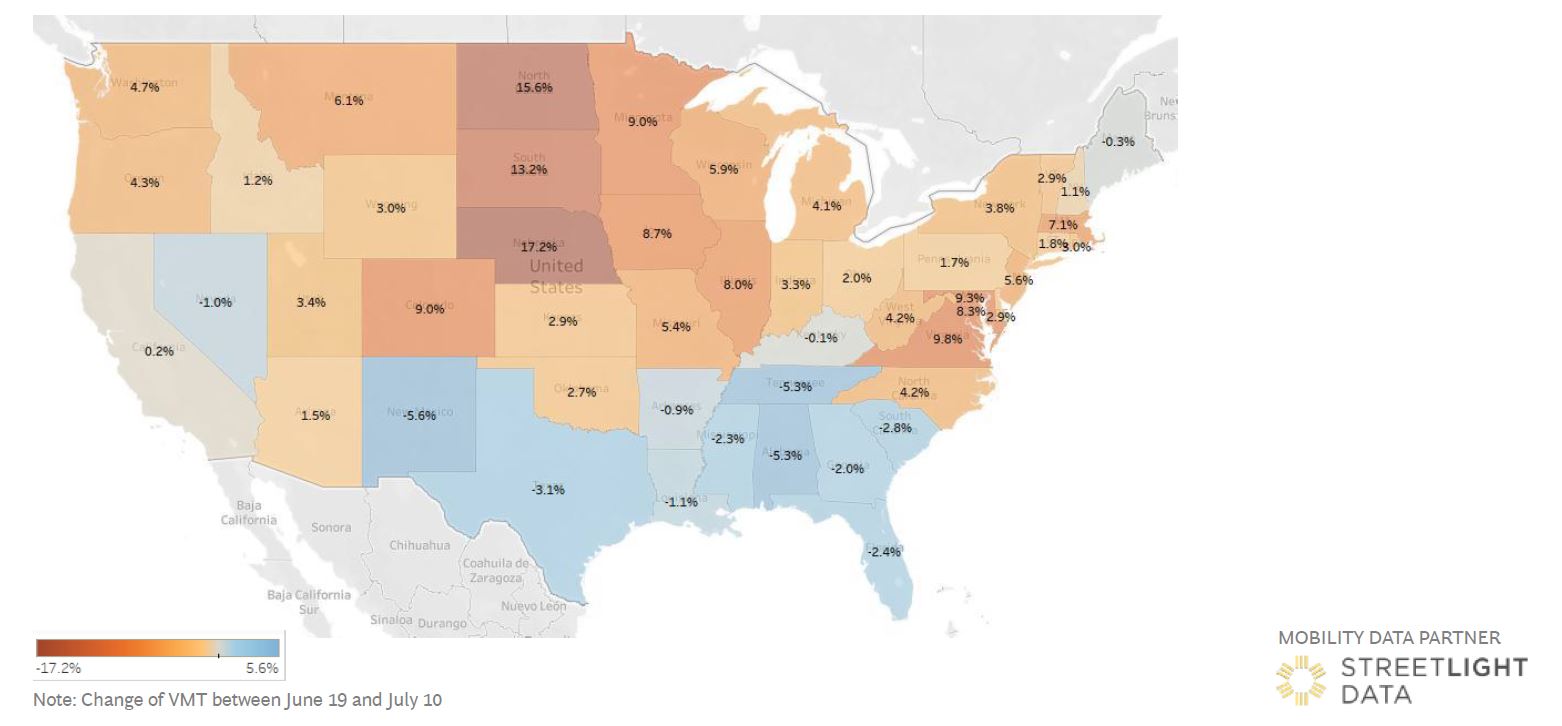
Figure 7: Several states see some fall in VMT since mid June, driven by resurgence of COVID-19 cases.
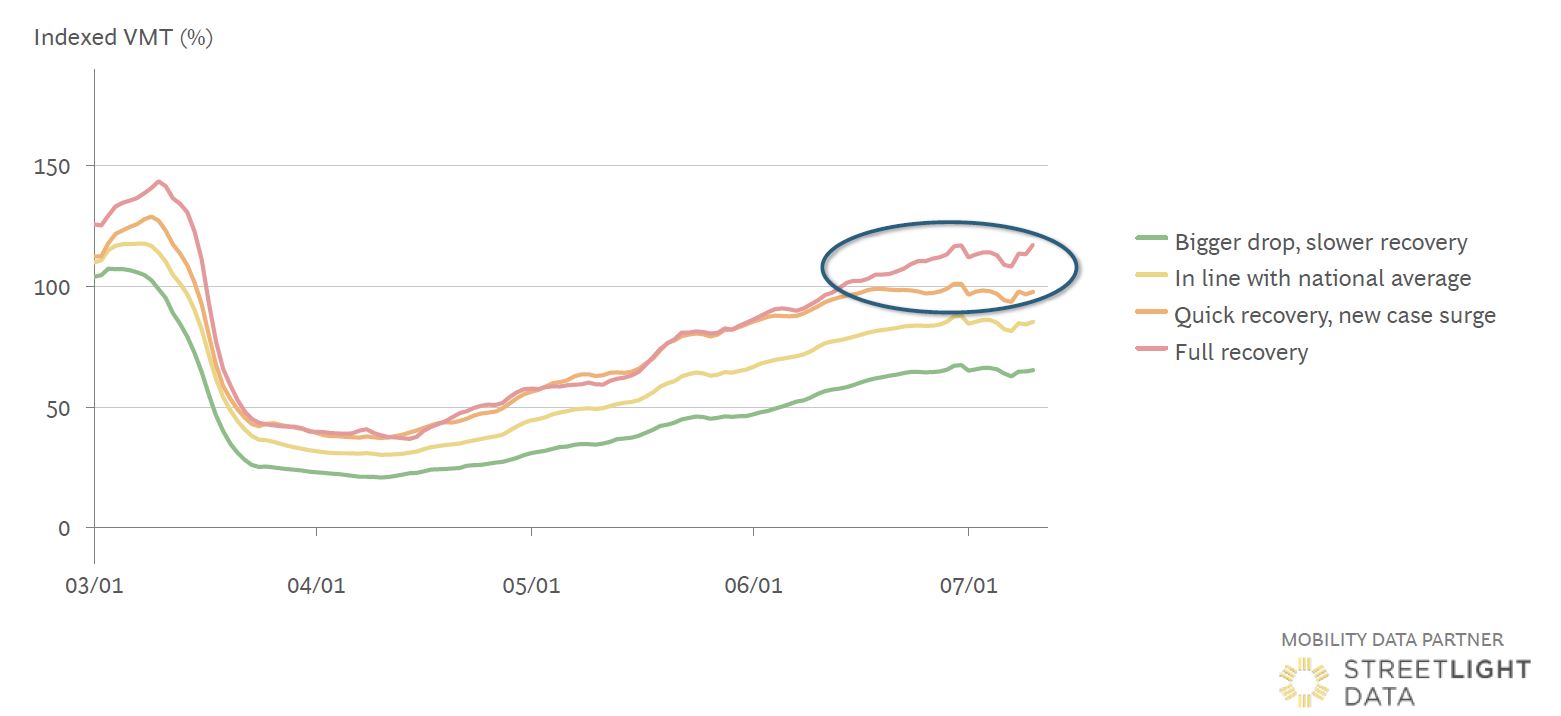
Figure 8: Recovery clusters deviate from mid June, with rise in COVID-19 cases.
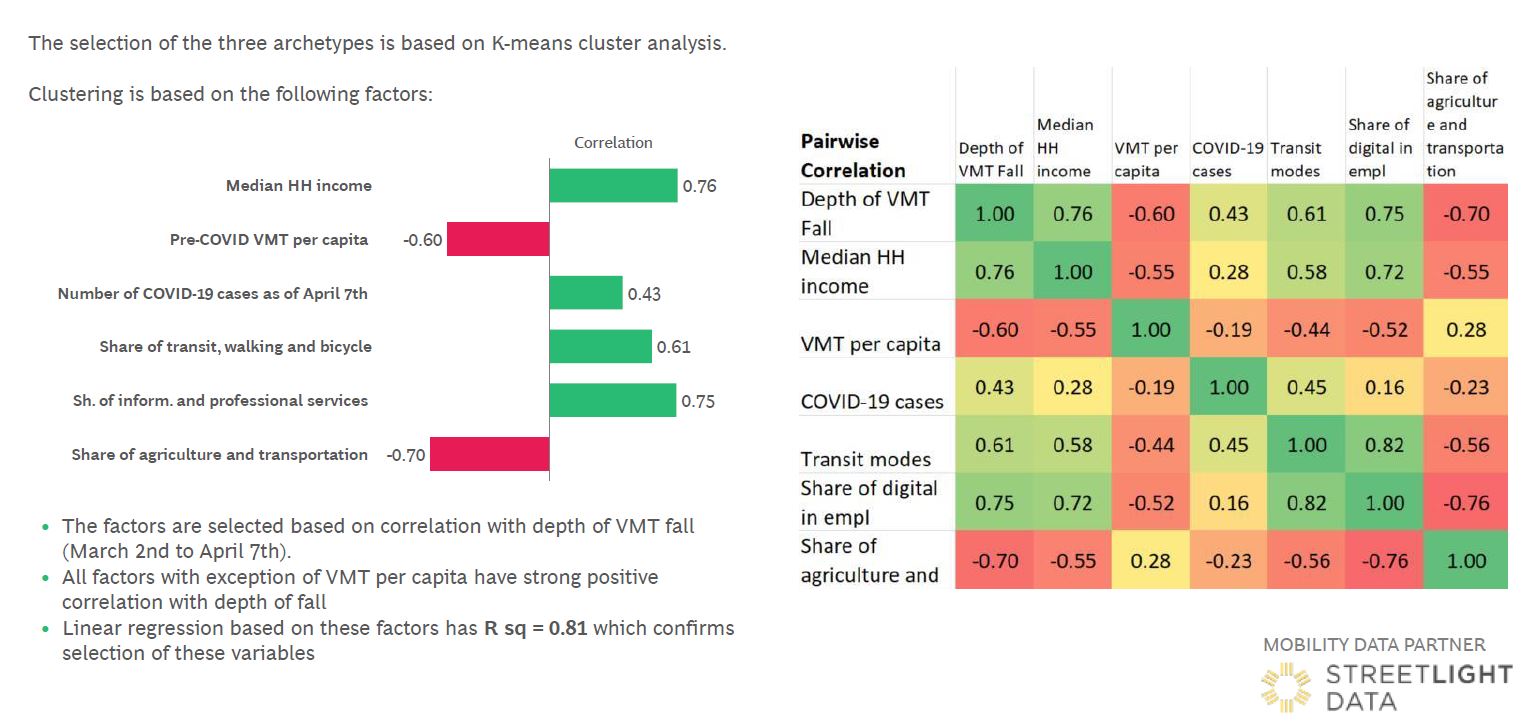
Figure 9: Higher income and share of professional services employment drive larger VMT drops at the state level.
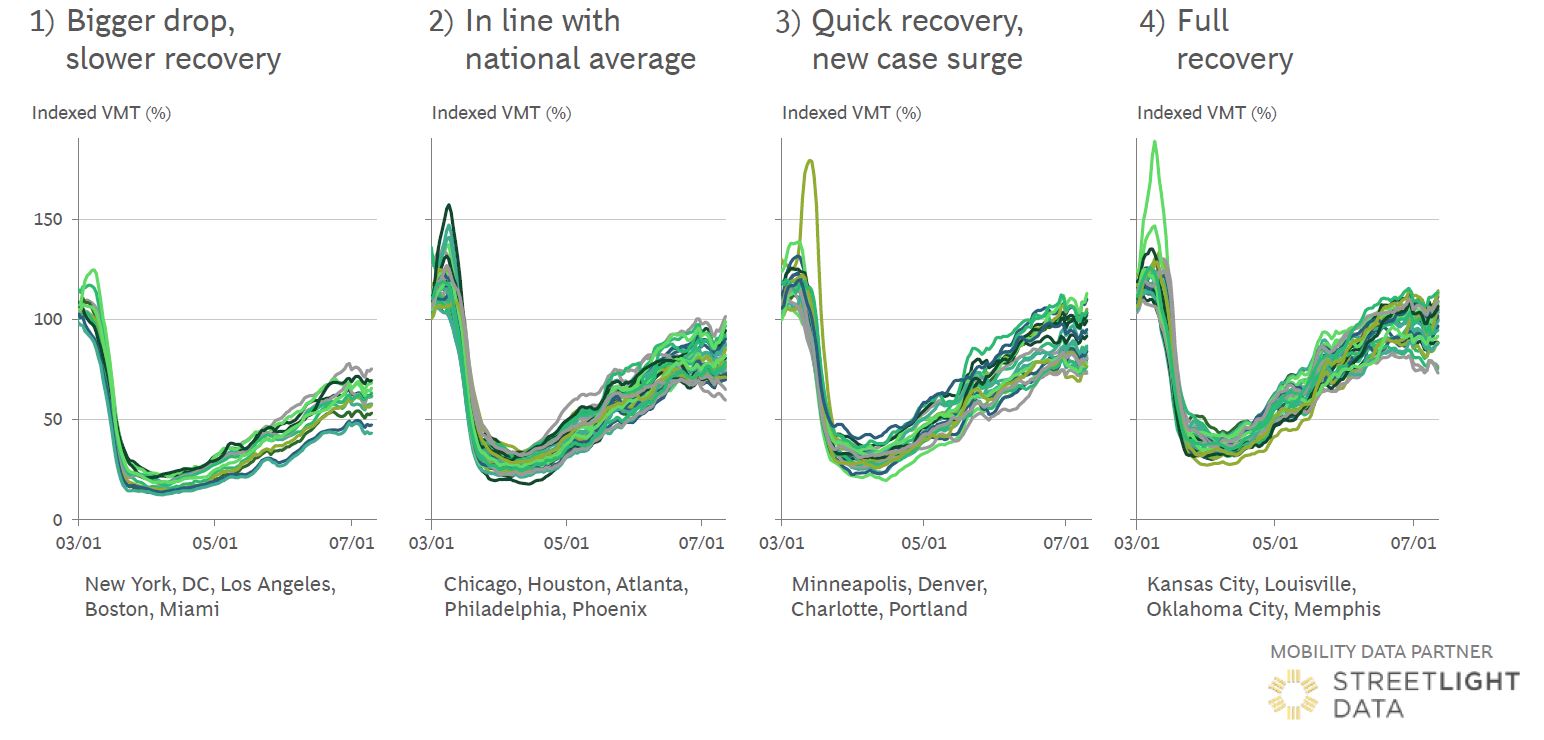
Figure 10: The VMT development varies quite a bit by MSA across the four archetypes.
Granular Analysis Reveals Local Variability Within States
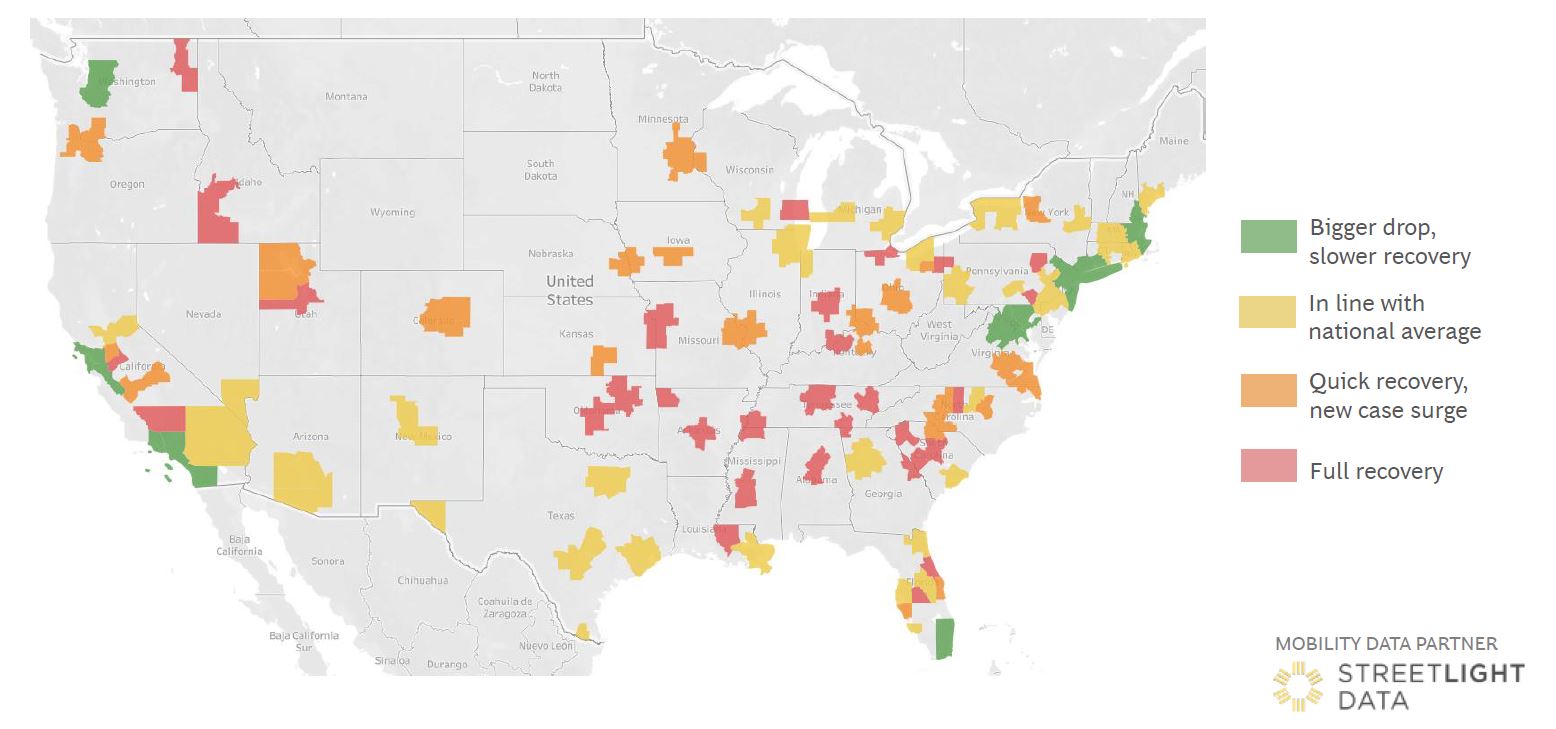
Figure 11: Distinctly different MSA profiles present in the same region/state.
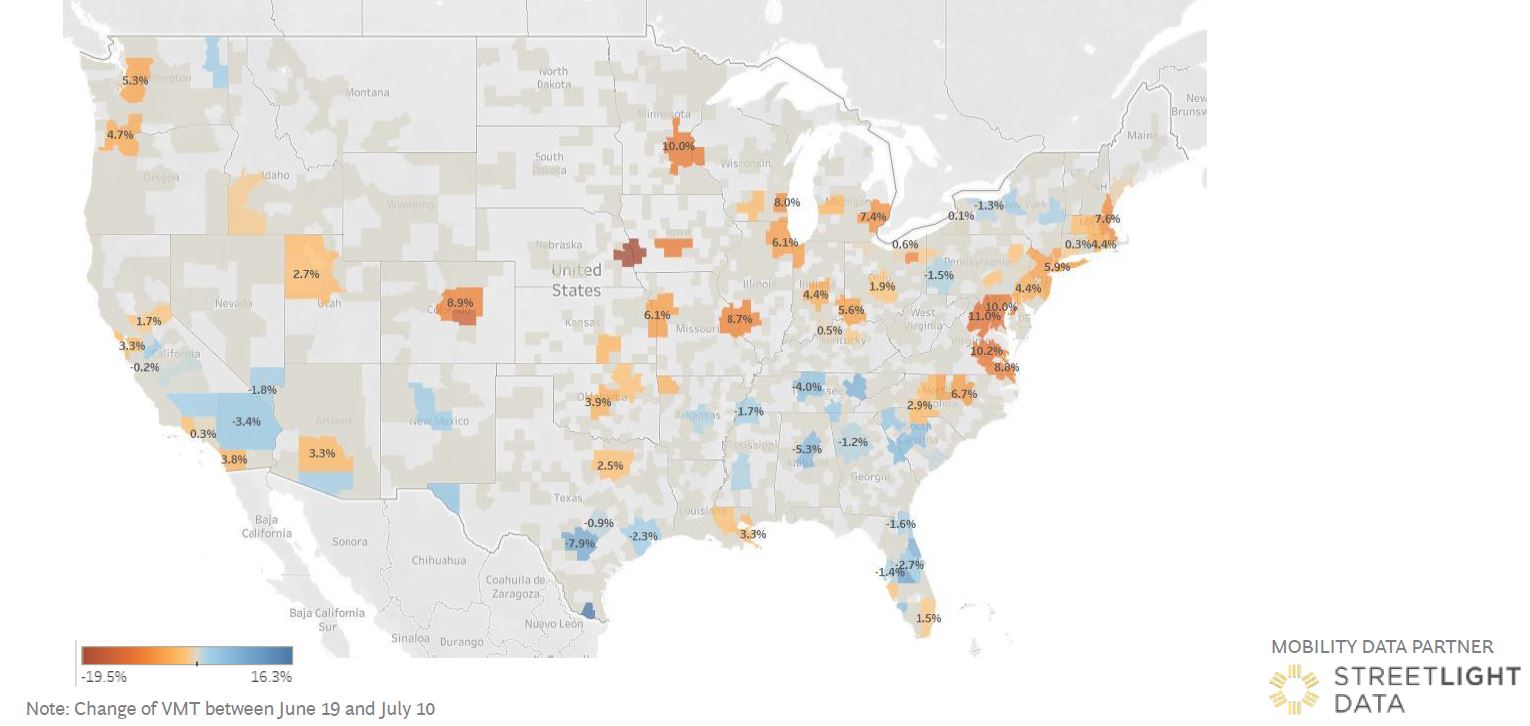
Figure 12: Several MSAs see some fall in VMT since mid June, driven by resurgence of COVID-10 cases.
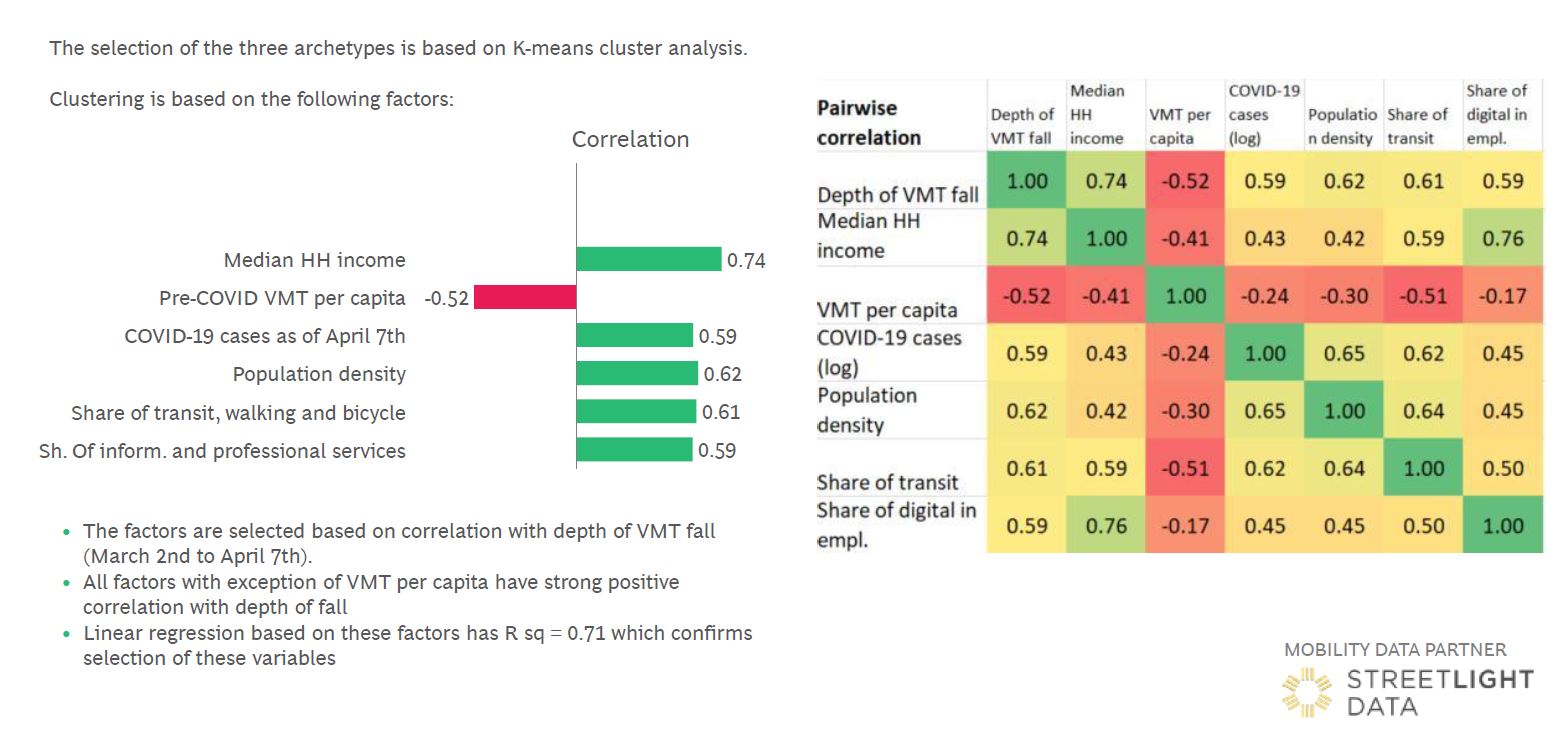
Figure 13: Higher income, population density, share of non-vehicle transit drive larger VMT drops at metro level.
Augustin K. Wegscheider is a partner at Boston Consulting Group’s Automotive & Mobility Practice, where he manages the Center for Mobility Innovation in North America.