
StreetLight recently ran an analysis showing where across the country bicycling has increased during COVID stay-home orders, and it got me wondering about these additional bicycle trips. We know that peak-hour bicycle commuting is down, but I wonder if these are essential employees who previously would take transit, but are wary of Coronavirus exposure.
As our economy reopens, we all want to support the essential workers making it happen, but how do we find out if that’s who is making these trips?
If your city has seen an increase in bicycling activity, you need to know who is riding, where they are riding, and why they are making those trips. This is important for prioritizing infrastructure investments — those investments would be very different if these bicyclists are essential workers who would rather ride than take transit versus recreational riders getting outdoors during quarantine.
Big Data offers fast directional findings, and that’s important for moving quickly during unstable times, with uncertain resources.
Who Is Riding?
To find out who is making these extra bicycle trips, I would start by researching traveler attributes of people bicycling. The traveler attribute information in StreetLight InSight® is based on Census-derived demographics including income, race, education level, age, and family size.
Comparing data from pre-COVID to today can uncover demographic shifts in bicycling activity. For example, if bicycle trips increased more among a lower-income population, that might indicate a swing toward hourly workers.
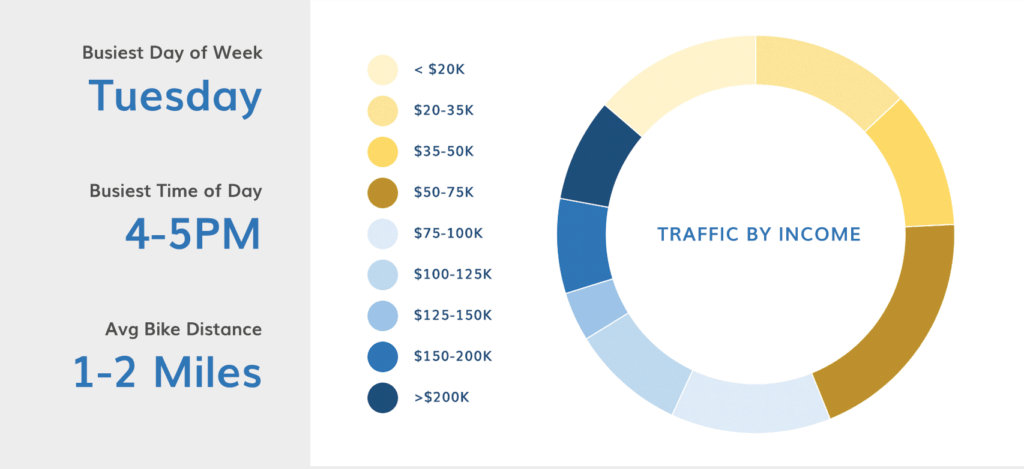
Figure 1: Analyzing traveler attributes for bicycling trips can help identify opportunities to support equitable bicycle transportation for low-income travelers.
The “who” is only one clue in the mystery we are unraveling. So, we’d file that information away to combine with the other details we find.
Where Are They Traveling?
You’ve probably seen more bicyclists on certain roads, but we want more than anecdotal information. In StreetLight InSight® we can separate bicycle and pedestrian travel from vehicles. We can also break up a region into zones like Census blocks, zip codes, or customized neighborhood zones. I would run a Zone Activity analysis to find out first where the highest concentration of bicycling activity occurs. I’d look to see if that data point aligns with my first finding.
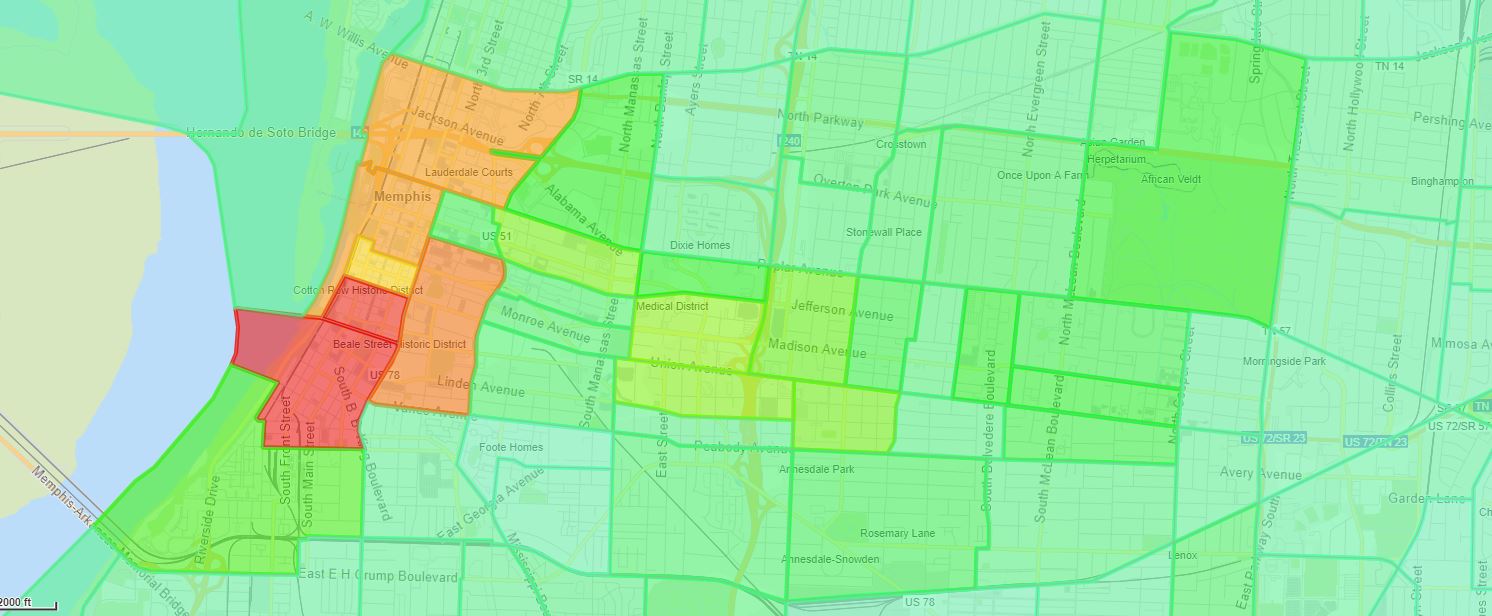
Figure 2: A Zone Activity analysis of Memphis in April 2019 shows most of the city’s bicycle trips ending at the tourist area and entertainment center around Beale Street (highlighted in red).
For example, if traveler attributes showed a high percentage of lower-income people, and the Zone Activity analysis shows a concentration of bicycling in an employment area with a high percentage of hourly workers, we may want to look more closely at bicycling infrastructure that supports underrepresented populations.
For a key employment area with lots of bicycling activity, we can set up some Origin-Destination analyses to identify where trips to that zone originated. That helps identify potential routes to enhance for bicycling activity.
Why Are They Riding?
You could get the “why” data from surveys, but they come with a high price and long time frame (and may be more difficult to administer during COVID). Surveys also tend to return small sample sizes, especially for bicycling data.
Instead, we can look at the time of day these trips are occurring. Essential workers will tend to ride on off-peak hours and weekends, but that’s also when recreational bicyclists tend to ride. Combine this information with the Zone Activity analysis to see if the popular bicycling destinations are recreational or employment areas.
Combining all these data points leads toward more effective investment of resources. If a locality finds it has a high concentration of essential workers riding bicycles instead of opting for transit, they can provide more street lighting along highly traveled routes, and adjust traffic signal timing so cyclists don’t have to stop at lights during off-peak commute times. Officials may also want to explore separated bicycle lanes, secure bicycle parking, and the availability of bike-share systems.
This gives planners data to help prioritize investments in bicycling infrastructure in order to provide resources to essential workings returning to work by bicycle, or to weekend recreational rides. Fortunately, Big Data gives us the tools to quickly and easily make the distinction.