
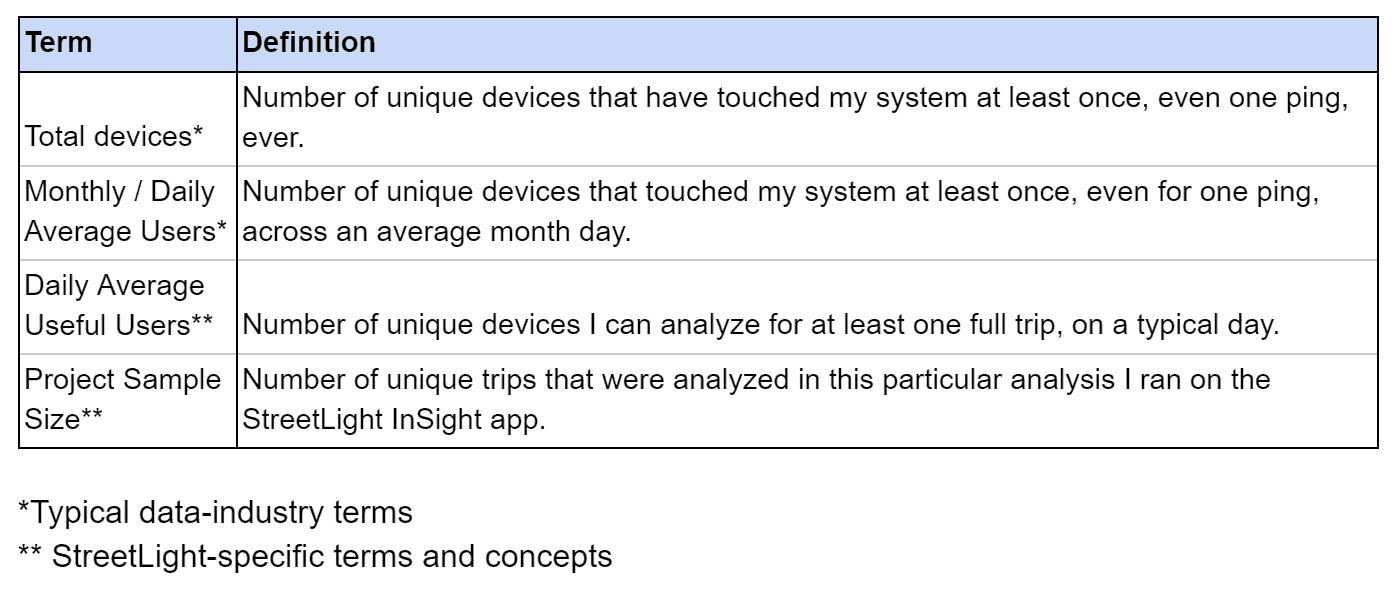
One of the most important metrics for our clients is “sample size” – the number of trips or devices analyzed to deliver a specific analysis within StreetLight InSight®. We’re happy to announce that starting with transportation data from January 2019, we’ve doubled our typical sample size since December 2018, and more than quadrupled it since the same time last year! What that means for our clients is better results, especially for areas with lower trip counts. Here’s why.
Sample Size: What Does it Mean for Transportation Data?
All players in the big data ecosystem talk a lot about sample size. But it’s not a simple concept. StreetLight sees a spectrum of sample size. In short, while we’ve continued to increase our “daily average useful users” steadily, we’ve put into place some new ideas which allow us to slightly more than double our typical sample size.
These changes are showing up now just for transportation data dating from January 2019. Future months, however, will have the same increased rates. We also plan to go back and increase the sample size for 2018 months (with clear updates when it happens!).
How We Quadrupled our Typical Sample Size

What’s behind this transportation data expansion? First, we added a bunch of new apps to our supply chain. This both increases the number of daily average useful users, and all the trips that go with them. We also carefully de-duplicated any mobile devices that showed up in multiple supply streams.
Next, we’ve been working with our suppliers to explain the value of pinging constantly and regularly, to allow us to capture more trips from mobile devices already in our system. Our partners, particularly Cuebiq via our exclusive partnership with them, have adjusted their algorithms to capture more transportation-useful data for each device. Thanks, suppliers!
To test the average analysis sample-size increase, we selected 900 random blockgroups from nine different geographic areas and population densities. We then ran the same analysis for three different time periods. For example, we analyzed the same 100 urban blockgroups in the Twin Cities for January 2018, December 2018, and January 2019. We then compared the sample size of trips over time.The results are shown in Figure 1, below.
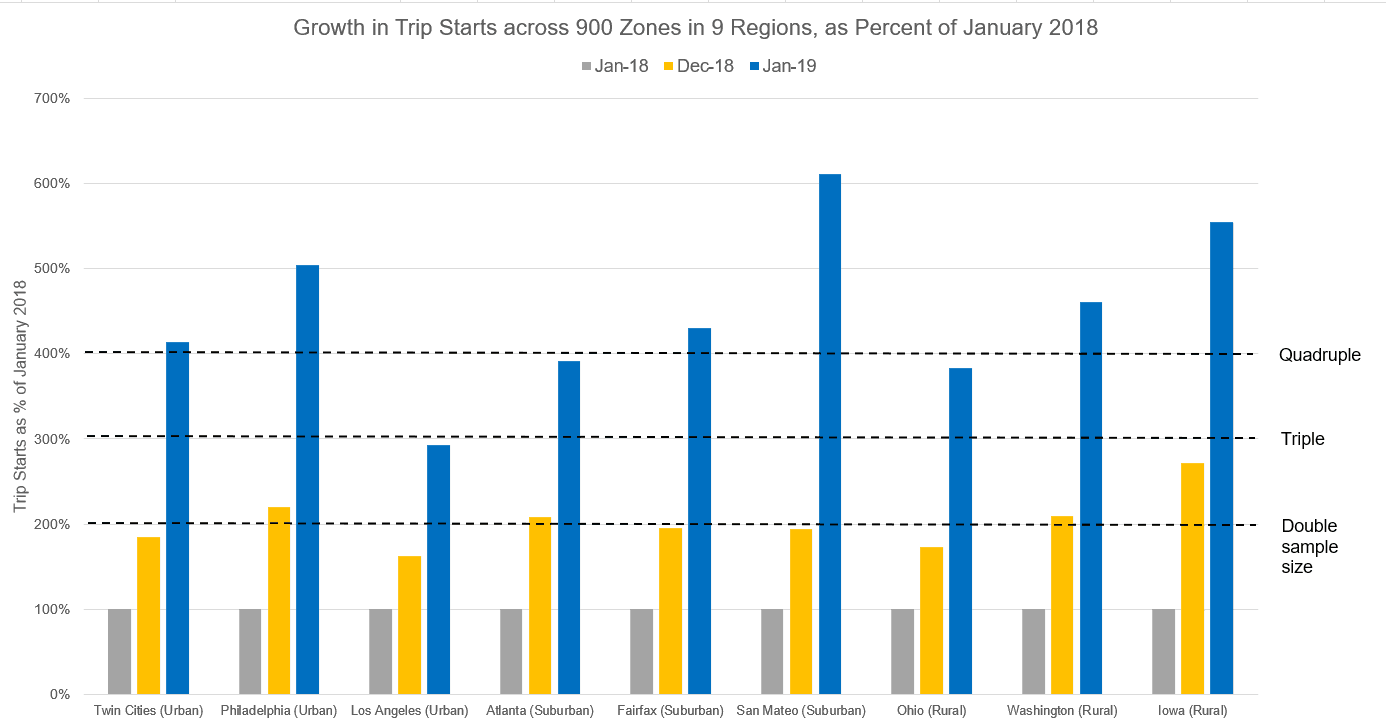
Figure 1: Average increase in device sample size for 900 blockgroups across urban, suburban, and rural locations. In general, the average sample size in January 2019 is 450% that for the same geographic areas a year prior, over quadruple year on year growth. Between December 2018 and January 2019, the sample size more than doubled.
Between January and December 2018, the average device sample size doubled, at ~200% of January 2018. This reflects general growth in new devices and new apps in our supply chain. Then in one month, between December 2018 and January 2019, the sample size took a big leap, an average of 450% of one year before (and, over double the prior month). Large increases are seen in urban, suburban, and rural contexts.
In the same January-to-January time frame, the device sample size (number of unique devices that started or stopped in each zone) went up 285%, compared to the 450% average trip sample increase. This shows the increase not only in devices, but also in trips captured per day per device.
For more about how to see the sample sizes in StreetLight InSight, see this support center link.
What Quadrupling Means for You
In general, a higher sample size yields better results. So at a high level, we think accuracy of our transportation data metrics will improve. In addition, some very refined zones and time frames that we couldn’t analyze because of low sample/privacy concerns will now be possible. This is especially useful for lower-frequency behaviors, like walking and bicycling. In addition, we will now capture more complete daily “tours” which will yield better future tour-based analytics (contact us if you want to give input/feedback as we work on these metrics).
For clients who are comparing transportation data over time, or want to use data with the old indices and are concerned about comparability, please contact support.