


Spring means cycling, but how safe is riding a bicycle in your region?
To understand bike safety at a macro level, and help planners better study individual regions, StreetLight recast bike fatality rankings state-by-state. The national Fatality Analysis Reporting System records cycling fatality rates per capita, but we dug deeper into a more cycling-centric metric. Rather than measuring fatalities against a state’s entire population (of which the majority doesn’t ride bikes), we compared fatalities to our relative Bicycle Miles Traveled (BMT) metric.
Our BMT metric for this report is an indexed value, planners can create absolute values based on actual bicycle trip volume calibrating the results to their area.
This new way to measure exposure shakes up our concept of which states have been the most dangerous, and the safest, for cyclists. Analyzing exposure rates within the context of Bicycle Miles Traveled lifts the safety rankings of some high-fatality states — and decreases the safety rankings of others — inviting a closer look at opportunities to improve.
Which States Surged and Which Fell
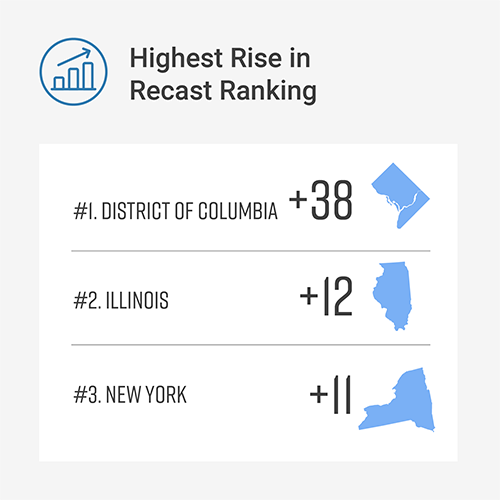
The District of Columbia had the most meteoric rise in our recasting (see our analysis below). Its three cycling fatalities in 2018 (the most recent data available) originally made D.C. look very risky — ranking 40th per capita, or one of the least safe on the per-capita list. But recalculating bike exposure using Bicycle Miles Traveled positions D.C. as the 2nd safest region in the country.
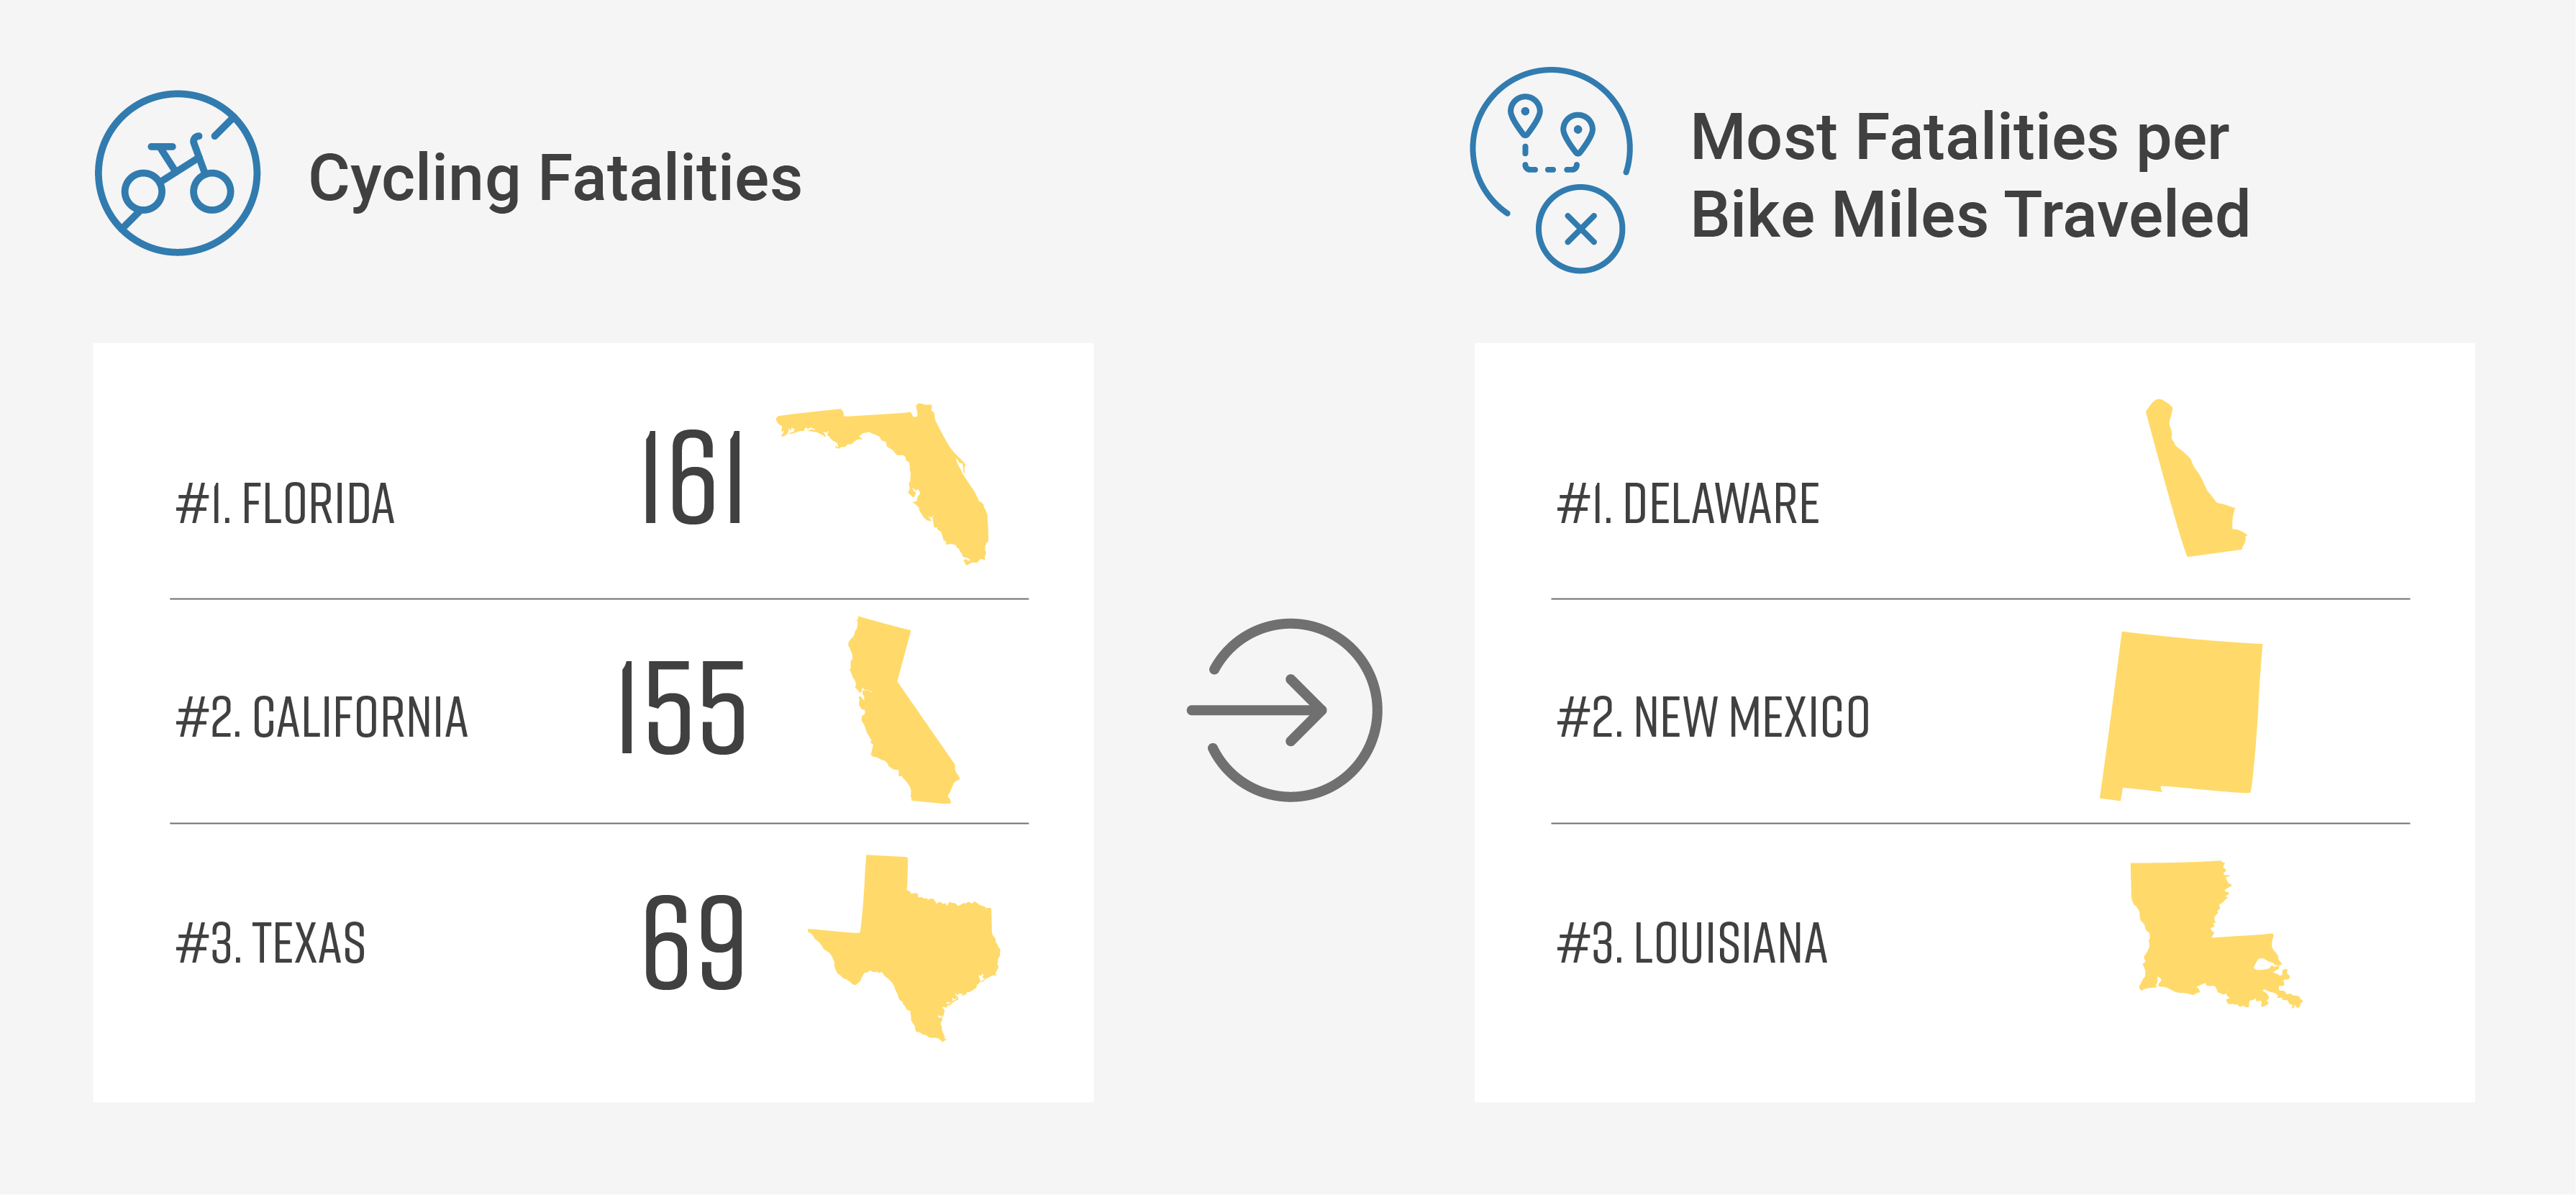
Conversely, although Florida had the highest number of cycling deaths in 2018, its ranking actually improved in our recalculation. Measured based on per-capita fatalities, it ranked 45th, but rose to 42nd when considering Bicycle Miles Traveled.
North Dakota and Illinois also benefited from our BMT analysis, rising over a dozen spots to achieve safer-state status.
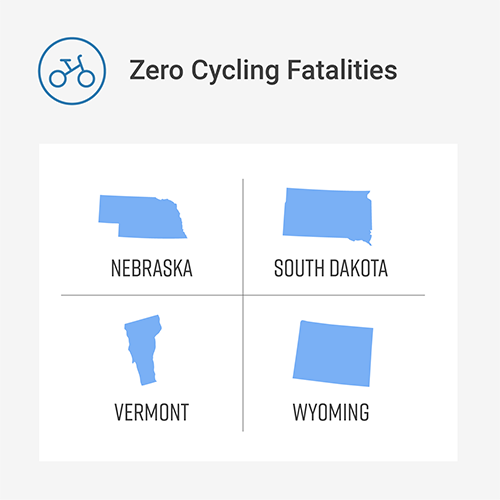
We decided to remove four states from our analysis because they had zero bike fatalities in 2018: Nebraska, South Dakota, Vermont, and Wyoming. It’s worth noting that among these, Nebraska has the highest population and the most Bicycle Miles Traveled — more than twice the level of runner-up South Dakota. All four states would top both safety lists handily if included in our analysis.
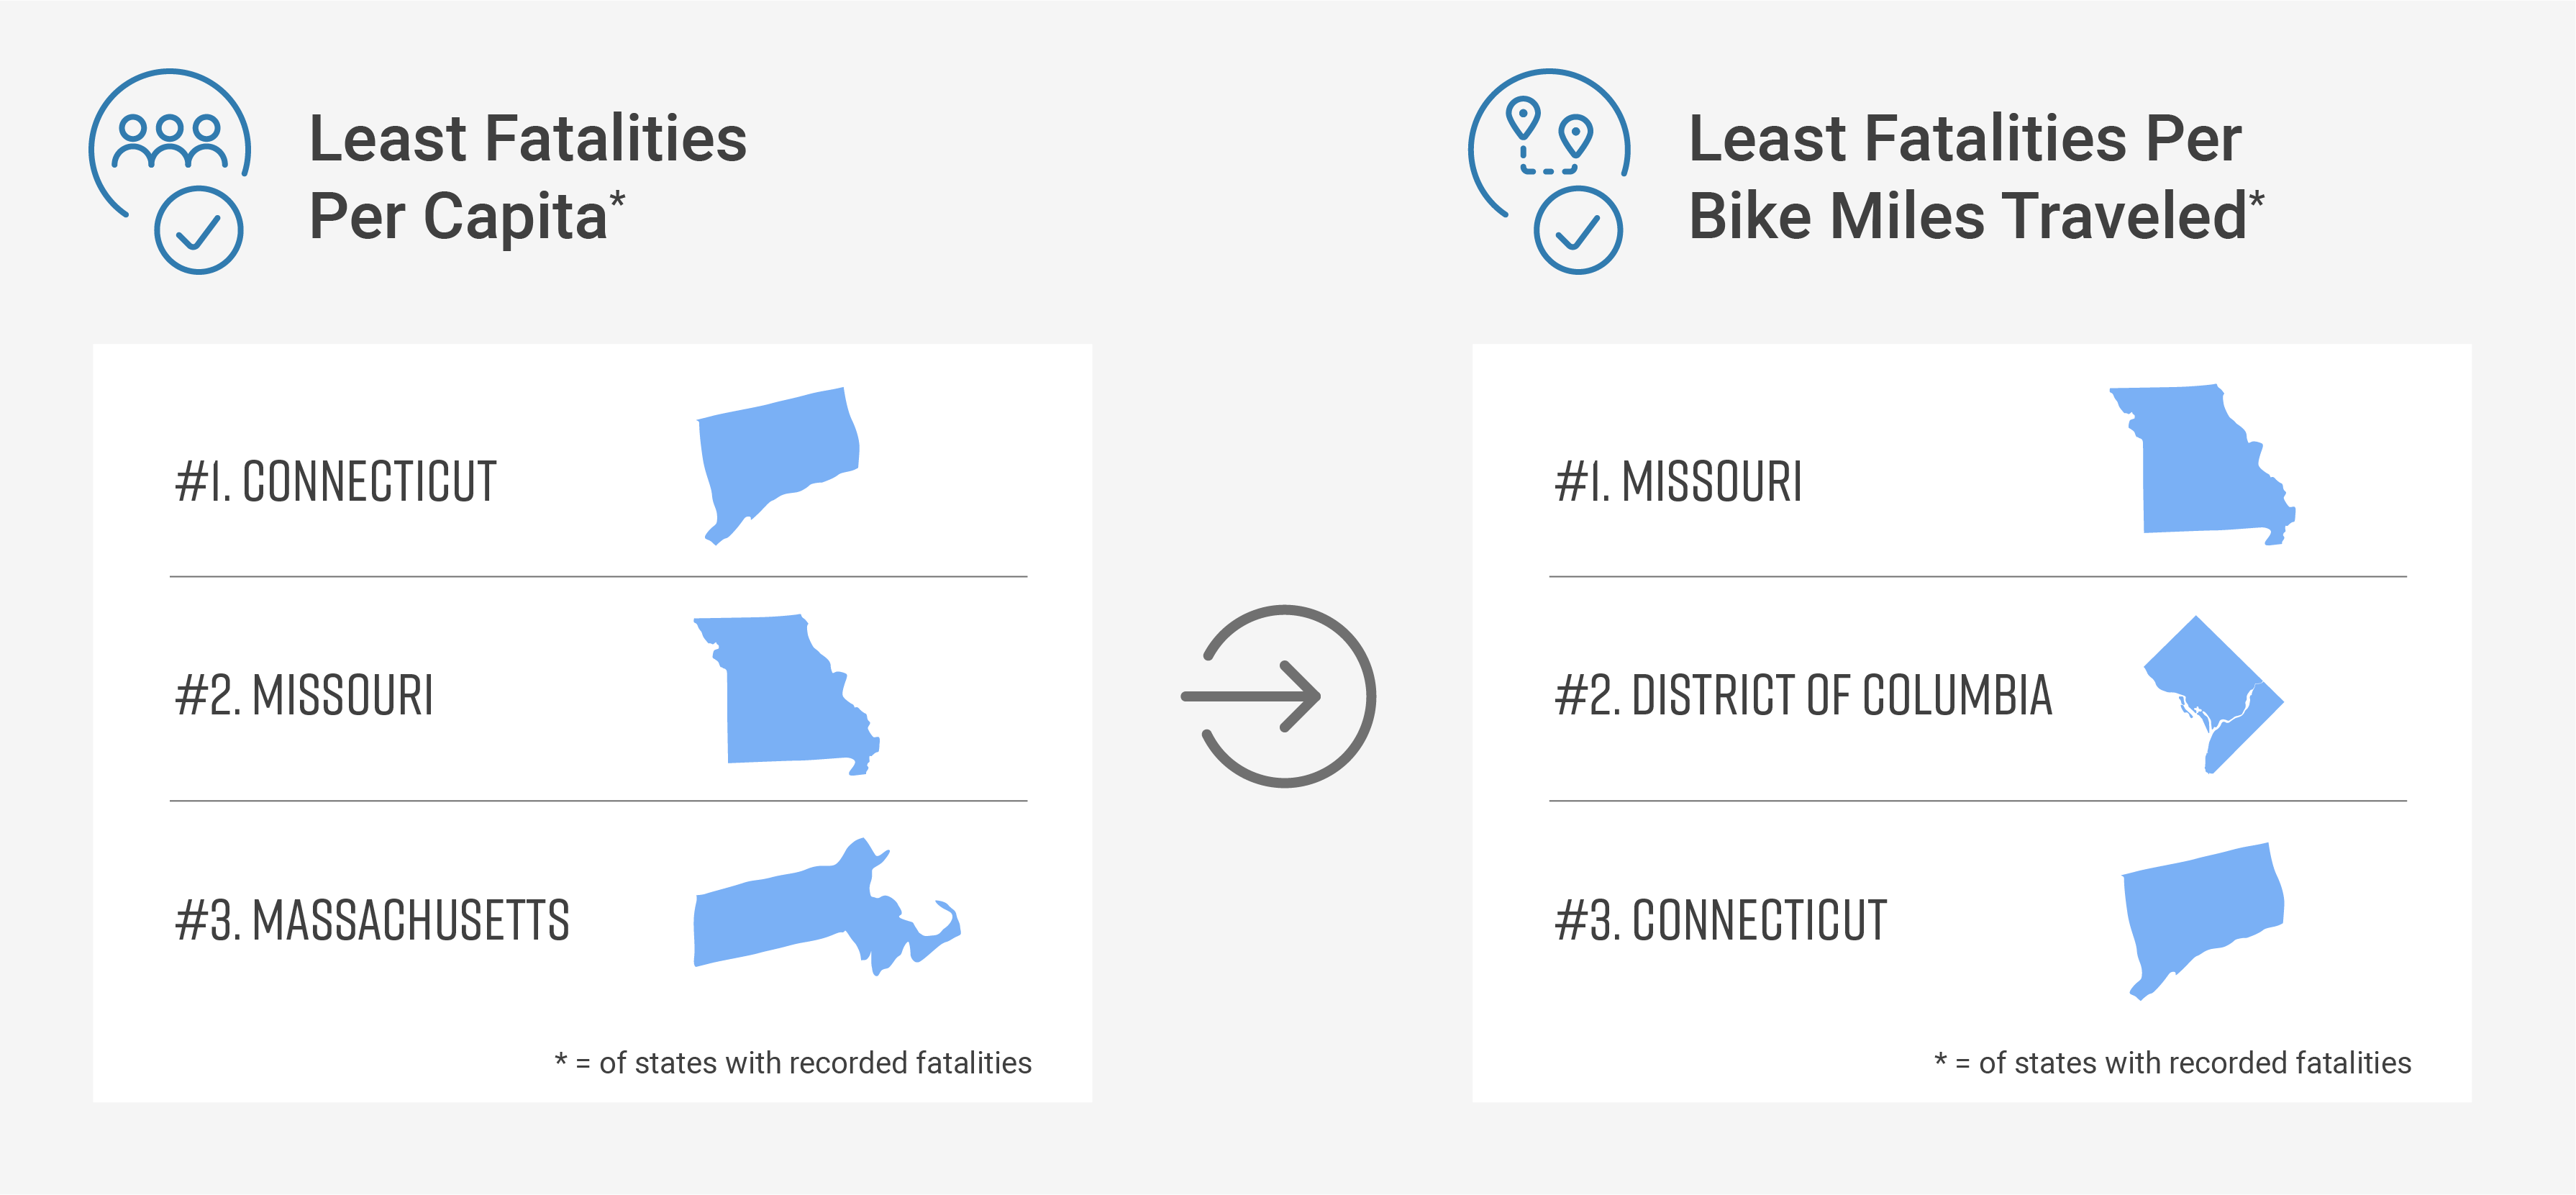
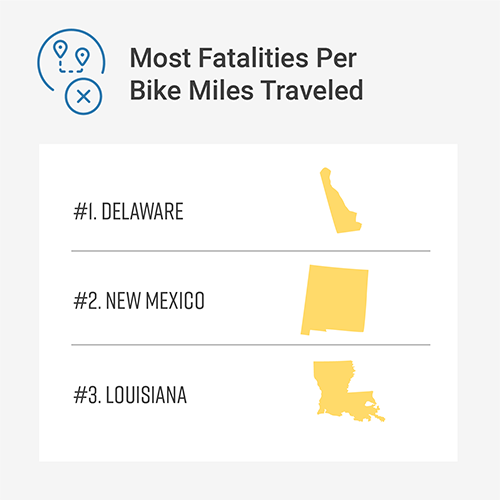
Of the 45 states we analyzed, Missouri and Connecticut stayed in the top three safety rankings both per-capita and measured by BMT. Louisiana and Delaware are both among the three least-safe cycling states when measured either way.
Finally, two New England states, Maine and New Hampshire, had the largest drops in bike safety ranking, followed by North Carolina.
Get the Data That Matters for Your Locality
Ultimately, not a single cycling fatality is acceptable to cities, states, and municipalities that are working hard to create safe cycling conditions. However, measuring exposure instead of per-capita fatalities helps analysts and planners be more specific about pinpointing problem areas — and identifying where to invest in the most promising improvements.
To provide a real-life example, we analyzed Washington D.C. to show how planners can combine detailed cycling metrics with their safety data resources to improve local cycling.
Learn more about the bike safety report

Regional Analysis

Methodology