
The COVID-19 pandemic created unprecedented challenges for transit systems across the country. As ridership has plummeted, transit systems face substantial budget and service cuts.
But transit will be a critical element of the new U.S. government administration’s emphasis on climate-friendly transportation. How can our transit systems bounce back?
StreetLight can now offer even stronger support to those researching transit’s past and planning for its future. StreetLight InSight® has added on-demand Bus and Rail Metrics for the U.S. and Canada, now included in our Multimode subscription.
Understand Who Takes Transit Where
Just as with our Bike and Pedestrian Metrics, Bus and Rail Metrics provide a suite of powerful data tools for analyzing travel behavior, including changes over time. Flip open your laptop and instantly access what you need:
- Complete passenger boarding-to-alighting activity to capture trips without the sample-size challenges of surveys
- On-demand information to monitor ridership trends and adapt to changing COVID-19 conditions
- Demographics, including race and income, to make well-informed decisions through a social equity lens
- Seamless integration with other data sets, allowing for contextual insights
- Empirical data to validate assumptions about travel behavior and ridership conditions
Our current data offering encompasses key months of 2019 and 2020. We are continually expanding and updating Transit and all other StreetLight Metrics.
Rebuild With Climate-Friendly Transportation
Data-driven insights from our enhanced Transit Metrics can help transportation planners, transit system managers, and other agencies support increased calls to build carbon-friendly travel networks. Transit data, with a lower carbon footprint than single-passenger vehicles, can support a fact-based strategy for post-pandemic recovery across all travel modes.
For example, planners can compare specific route ridership levels in a pre-COVID time period in 2019 to the same time period in 2020. This helps highlight macro-level trends, such as where ridership rose or fell. They can also analyze O-D pairs to understand and adjust high- or low-demand travel routes.
Fact-based intelligence can assist in rebuilding transit ridership, lowering a city’s carbon footprint by shifting vehicle travel to bus and rail.
Make Travel Truly Equitable
Title VI requires that transit routes serve all metro regions equitably, and demographic information is critical for social equity analyses. Transportation planners can use our O-D Metrics for Bus and Rail modes to understand how transit ridership matches demographics in the travelshed areas for various transit stops.
With a deeper understanding of passenger demographics, planners can determine which lines have the highest proportion of low-income riders. They can also compare those demographics with the Census Block Groups where stops are located.
As a sample use case, we ran an O-D analysis using our Bus Metric with Trip and Traveler Attributes for a four-month period in 2019. This analysis of Massachusetts Bay Area Transit (MBTA) bus passengers with trip destinations in the greater Boston area illuminated the following insights:
- Approximately 47% of trips are by passengers with an income less than $50k.
- Approximately 58% of trips are by White passengers.
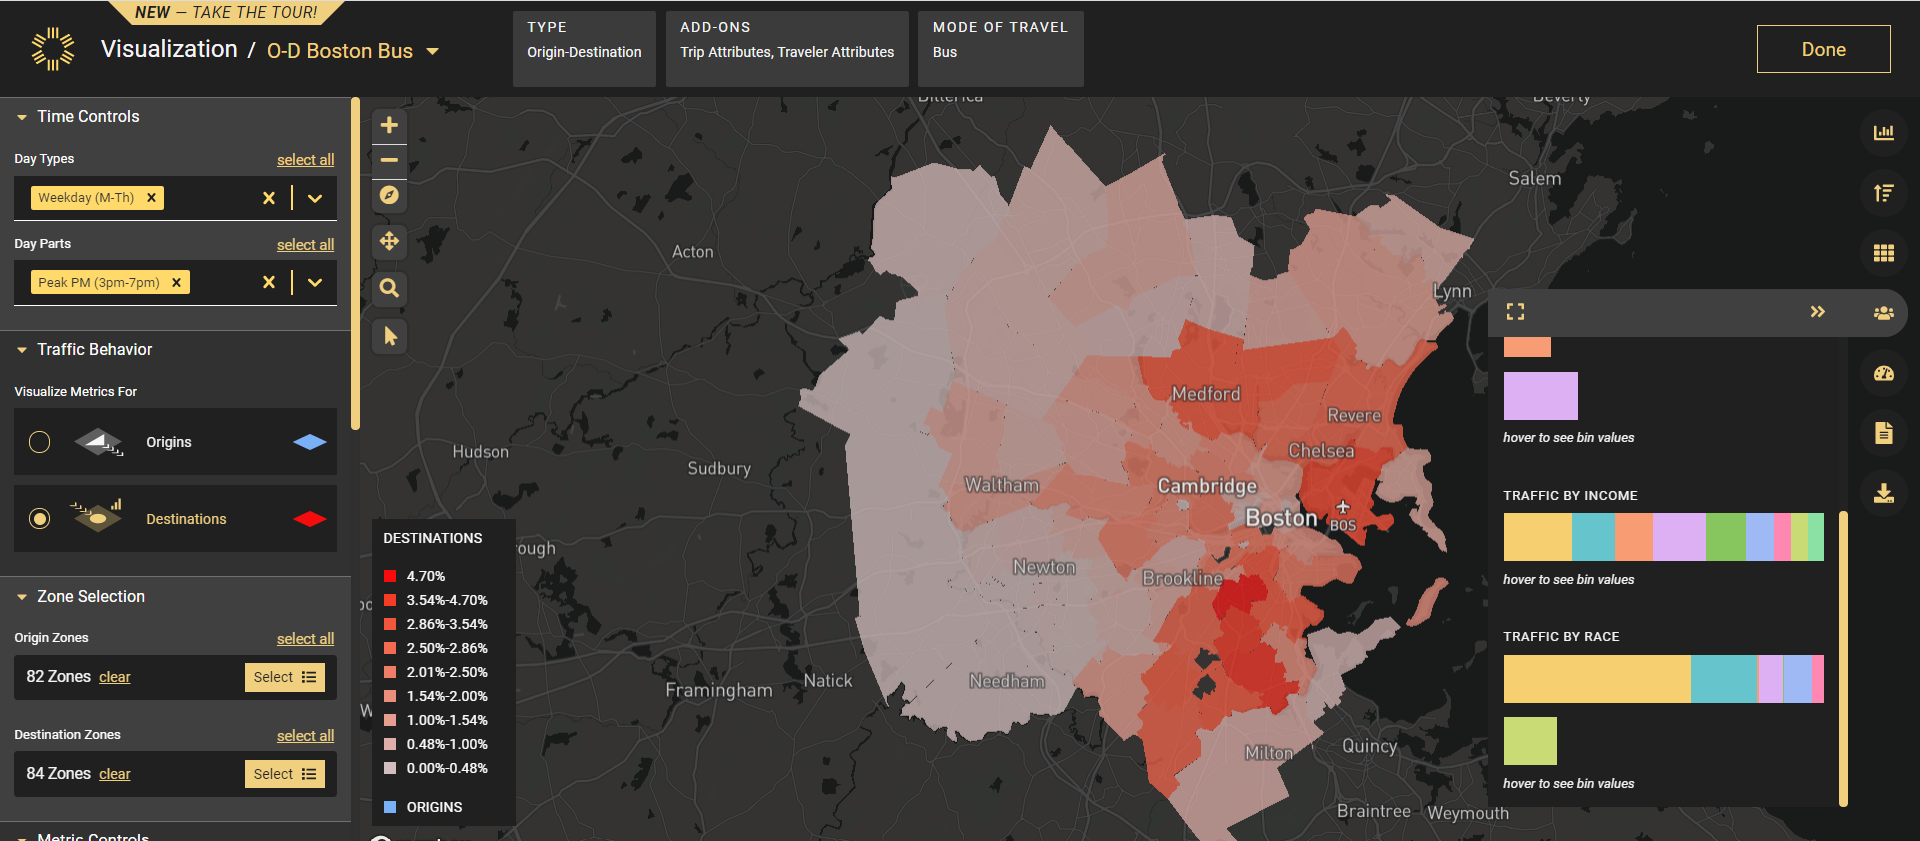
Figure 1: Visualizing Boston’s transit ridership by income and race in StreetLight InSight®.
We also analyzed Bay Area Rapid Transit (BART) morning commute ridership on a transit line between the East Bay and San Francisco comparing April 2019 to April 2020.
- In 2019, 35% of trips came from passengers with income lower than $50k, but that number rose to 53% in 2020.
- In 2019, 44% of commuters were White, compared to 39% in 2020.
Comparing this data to a city’s overall demographics can provide a deeper understanding of how reliant low-income residents are on bus and rail transit, proportionate to the population at large. These insights can help planners visualize where resources may need to be re-distributed along routes.
Trust Validations Against Leading Agency Counts
StreetLight’s Metrics are derived from several types of data, including general Location-Based Services (LBS) data and well-validated bus and rail ridership counts.
We confirmed strong correlation between the StreetLight Index and rail station-level monthly total ridership statistics, published by BART, MBTA, and the Chicago Transit Authority.
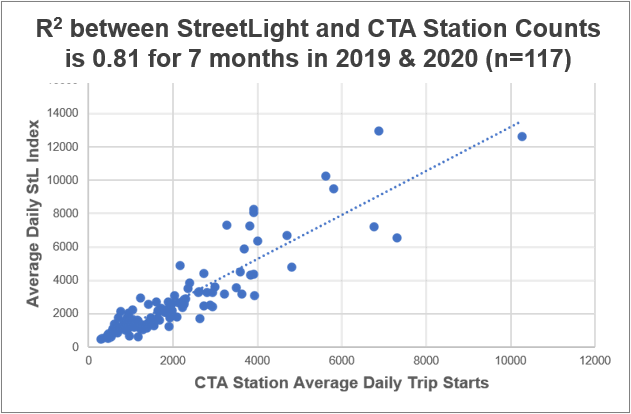
Figure 2: High correlation between StreetLight and transit station counts.
We confirmed strong correlations between the StreetLight Index and bus stop-level monthly total ridership statistics, published by Los Angeles County Metro Transportation and Central Ohio Transit Authority.
For more about our Transit Metrics methodology and validation, see the technical details in our extensive Bus and Rail Methodology and Validation White Paper.