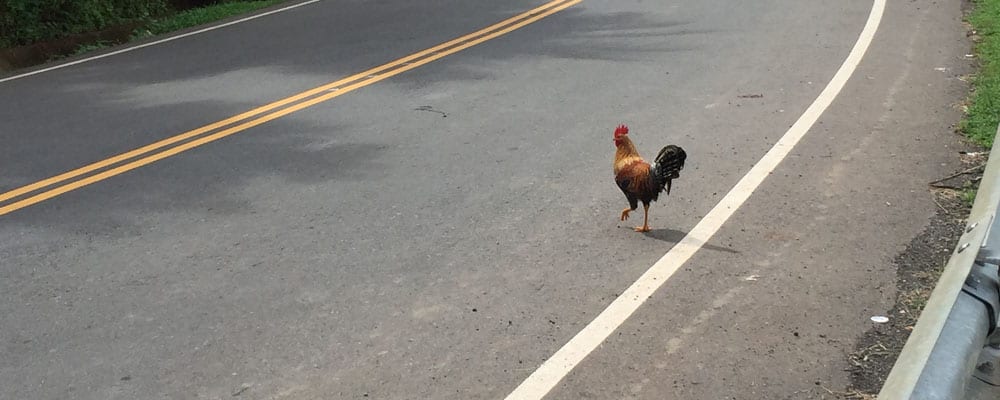
If your local transportation department has not started planning for the backyard poultry trend, now is the time to start. The rapid increase in backyard poultry numbers introduces new challenges for local transportation professionals, as the potential for an increasing number of birds playing chicken on local roadways could grow in direct proportion.
Why Did the Chicken Cross the Backyard?
A 2013 survey conducted by the U.S. Department of Agriculture found that nearly one percent of all U.S. households surveyed reported owning backyard fowl, and four percent more planned to start in the next five years. That’s over 13 million Americans flocking to the backyard poultry scene, with ownership spread evenly between rural, urban and suburban households.
“Now, more than ever, it is important for transportation planners to have access to empirical data to know why the chicken crossed the road,” said a local transportation planner from Virginia. She added, “It is critical for planners to have a reliable source of data to determine the frequency of chicken crossings and where they are occurring most often. If we are able to get this type of data we will be better able to predict when a rogue chicken may decide to fly the coop, and the probability of that bird impacting the road network.”
After speaking about this new transportation challenge with several local planners, StreetLight saw an opportunity to add to our bicycle and pedestrian metrics.
Introducing Poultry In Motion
Today, StreetLight Data launches Poultry in Motion: the first-ever Big Data metrics analyzing poultry mobility patterns. StreetLight Data has teamed with a company that collects data through its proprietary CDK (Chicken Development Toolkit), which has been integrated into many mobile chicken apps.
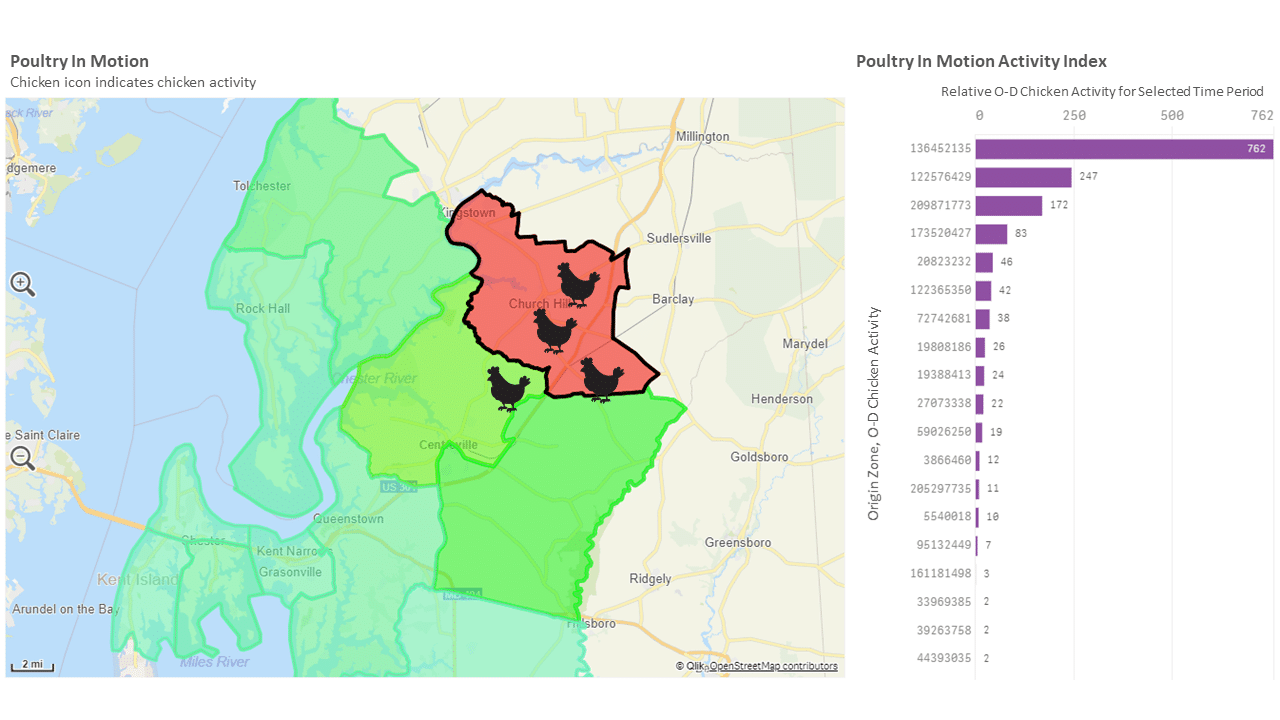
Relative chicken activity in Richmond, Virginia neighborhood.
Thousands of anonymous backyard chickens across the country have already opted-in, with hundreds more being connected every month. StreetLight can now harness the power of this vast and diverse data set to determine why the chicken crossed the road and much more.
Using Poultry In Motion, local transportation professionals can:
- Determine the purpose of a chicken’s trip across any local road in the United States or Canada. Trip Purpose is provided for Coop-to-Other Side of Road, Coop-Based Other, and Non-Coop-Based.
- Determine the average duration of local chicken trips and the speed that they are crossing the road by the hour of the day.
- Compare the impact of cooped versus free-range chickens on local roads.
- Identify common destinations among backyard chickens within a town or neighborhood to better route poultry traffic.
In the age of Big Data, privacy is of utmost importance. StreetLight never provides data on the movement of individual birds – the Poultry In Motion metric is provided only for groups of composite chickens.
By the end of 2019, StreetLight anticipates we will have a poultry sample that is representative of 15% of all adult birds currently residing in the U.S. and Canada.
Want to Learn More?
When it comes to data on backyard chickens, don’t just wing it. Contact StreetLight today to learn about the benefits of using the Poultry In Motion metric for your organization.
StreetLight affirms that no chickens were tracked for this April Fool piece. But, we do provide bicycle and pedestrian metrics in StreetLight InSight. Click below to learn more.