
Today’s commercial travel analysis is becoming more complicated, and traditional data methods are struggling to keep up. For example, small-package delivery is done more and more by people in their own personal cars – how can we accurately capture that information? This increasing complexity necessitates better and more granular data about commercial traffic, and Big Data can help.
Here we’ll review six popular examples we see over and over again when planners and agencies are trying to understand commercial vehicles in their communities.
The first three examples focus on communities trying explicitly to improve goods movement and commercial vehicle flow. The next three, which are in fact more common in our experience, focus on trying to understand and manage the impact of commercial traffic on some other aspect of the community.
A few quick clarification points – we currently only measure road movement, so will not include trains, planes, or shipping in this discussion. In addition, a “community” could be a city, neighborhood, MPO, or State DOTs, as well as the consultants who work with them. Finally, in these examples we combine all commercial vehicle movement but in practice communities often like to break out heavy-duty freight from medium- and light-duty goods movement. Thus, we refer to this group of vehicles as “commercial vehicles” throughout the examples.

How StreetLight InSight Can improve Commercial Vehicle and Goods Movement Analyses
Example 1: O-D Matrices for Transportation Demand Modeling
This example will be familiar to most people in the planning world. Many of our customers use the StreetLight InSight web app to run an origin-destination analysis to calibrate or seed freight-demand models, as part of their ongoing planning activities. The image below shows a simple O-D visualization for American Canyon, California.
Users often compare morning to midday to evening traffic, and compare commercial to personal O-D patterns all with a few clicks. Users also like to “zoom in” and do special O-Ds for particular areas of interest, like ports or warehouse clusters.
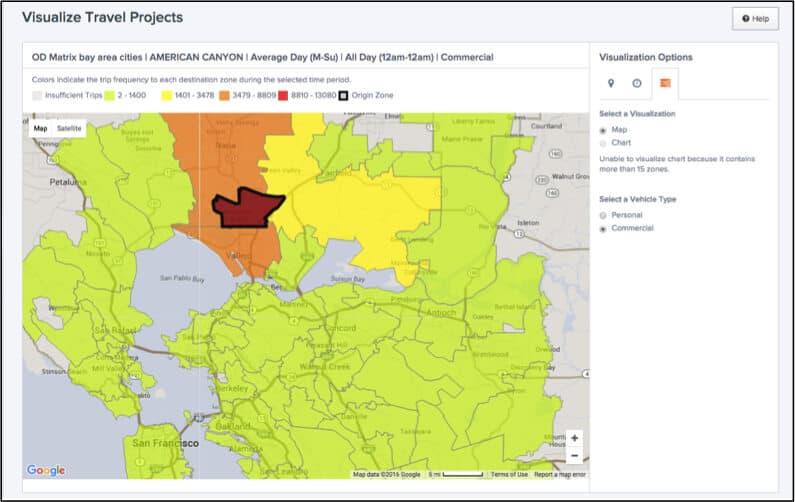
Figure 1: Simple O/D matrix visualization for commercial vehicles in the Bay area.
Example 2: Commercial Vehicle Routing
Because we use GPS data, which has five-meter spatial precision, we can determine which routes trucks took between origins and destinations. Many customers use this for transportation demand modeling for freight, as in our example 1. In addition, customers look at which on- and off-ramps trucks take, and differences in travel times to improve way finding, understand road wear, and more.
Example 3: Planning for New Environmental Regulation
Some of our customers use StreetLight InSight to help plan new regulation, both modeling the potential impact and figuring out how to support local commercial vehicle owners in complying.
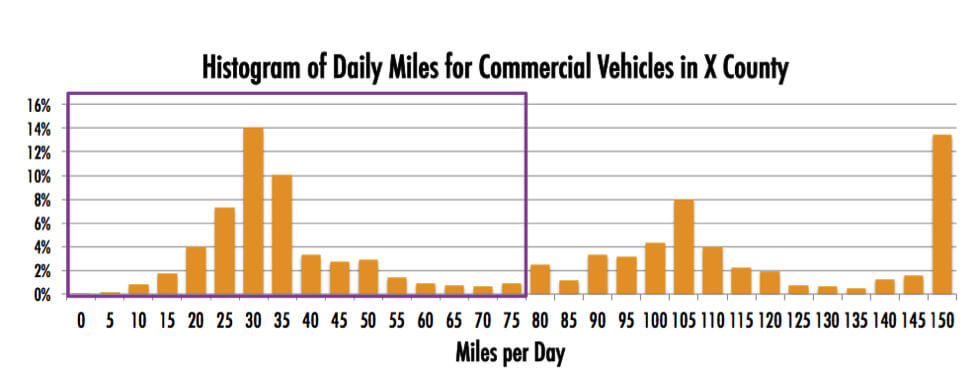
For example, as shown in figure 2, customers can look at the distribution of total trip length for trucks in a particular county. This highlights what share of trucks could reasonably use an alternative fuel (like natural gas or electricity) that has a shorter range than conventional diesel trucks.
Example 4: How Does Commercial Traffic Compare to Personal In this Traffic Jam?
Commercial vehicles often take a lot of blame for traffic jams, and policy makers often find it easier to work with commercial traffic to provide incentives to shift driving time. Many of our customers like to compare the behavior of commercial and personal vehicles in the same traffic jam.
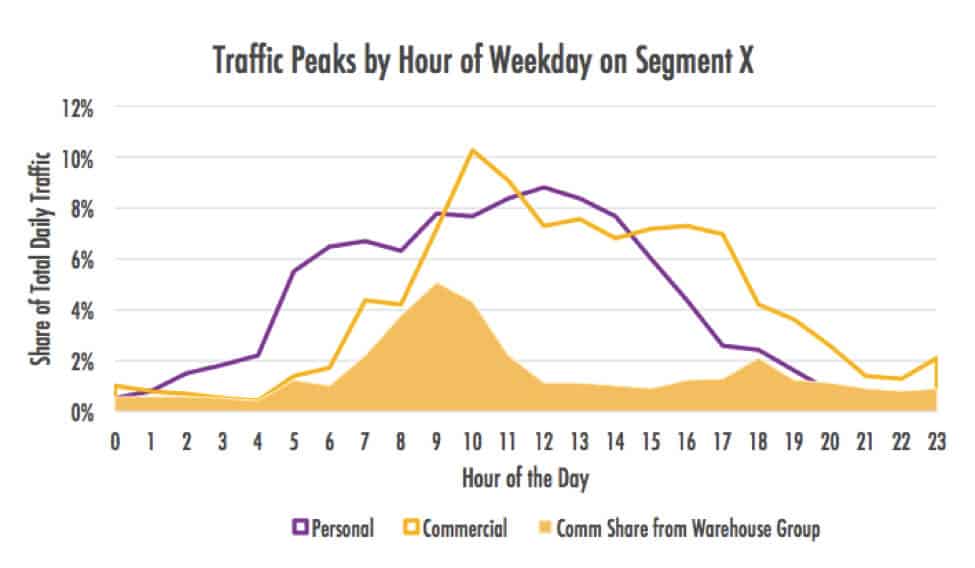
For example, as shown below, we see the “load curve” of personal vehicles throughout the day on a particular segment that has terrible morning rush hour congestion (purple line). Local stakeholders complain that big trucks exacerbate the problem. We can also look at the load curve for commercial vehicles (yellow line). Finally, we look at the share of commercial vehicles on the road segment going to two nearby warehouses (yellow area).
We see in fact that the commercial vehicles peak after the morning rush with the exception of the trucks going to the two warehouses. Now policy makers can target their outreach and incentives to this particular set of drivers. This is a simplified example, but demonstrates the value of analyzing both types of driving together.
Example 5: Freight and Economic Development
Many, many customers want to answer a simple question – what share of the vehicles using my roads are actually doing something for my community (either stopping for lunch or picking up goods)? This is also called an Internal-External analysis. StreetLight InSight can answer this question in a few clicks.
For example, the image below shows an analysis of I-95 southbound going into Richmond, Virginia. The chart shows the share of vehicles that stop in the city versus those that pass through and leave by a particular roadway. We see that more personal vehicles than commercial vehicles are actually going to the greater Richmond area ( 42% vs. 29%). This alone is useful information to a transportation planner.
We also see that passing-through trucks are twice as likely to take I-295 SB out than personal vehicles. This offers intriguing possibilities – why do the trucks prefer it? Are there toll or road stop implications worth considering?
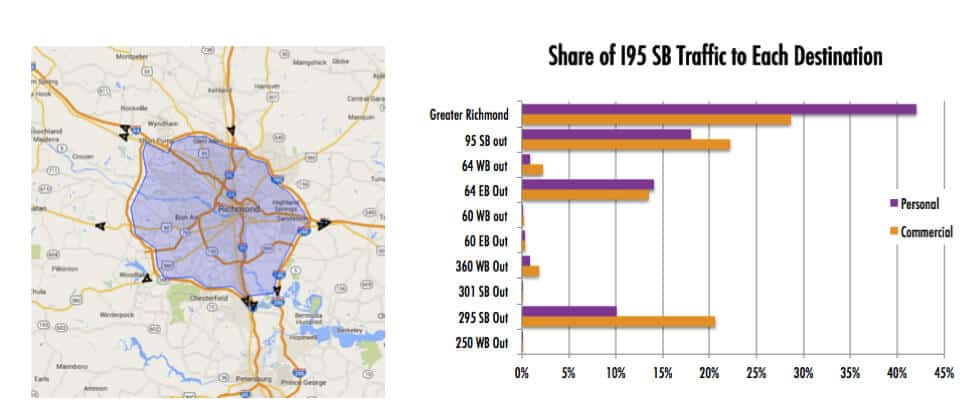
Figure 4: Example of a combined personal/commercial internal-external analysis for Richmond, VA.
Example 6: Freight and Tolling
Many clients are interested in the tolling implications of our metrics. For example, a client in San Diego wanted to know if recent changes in tolling prices had in fact resulted in drivers moving to a less-congested roadway. The metrics revealed that, in fact, personal drivers reacted as expected in the morning rush hour. But commercial drivers appeared not to react at all. Thus, the policy makers not only had confirmation that their policy worked, but guidance in how to spend time and outreach efforts to make it work even better.
The Next Five Years
In conclusion, here are the main opportunities, challenges, and trends we see for Big Data for commercial and freight analytics in the next five years.
Opportunities
- Empirical measurement radically speeding up and enriching what behaviors can be measured and modeled.
- Measuring changes over time for deeper understanding of impacts of policies and infrastructure investments.
- An emphasis on measuring goods movement and non-goods movement transportation interacting in the same system.
- Integration of mobile data with IoT sensors data.
Challenges
- Ensuring Industrial and personal data privacy (hint: use professional processors like StreetLight!)
- Figuring out how to define “goods movement.”
- Helping communities go beyond using Big Data to simply replace surveys, but implement transformational measurement practices.
In the future, we see a broader, more complex definition of goods movement in more constrained city environments with more complex regulatory and infrastructure planning demands. The best way to begin to measure, manage, and model this future is to use Big Data-driven analytics.