It feels like everyone is trying to make sense of the high-tech direction in which mobility is heading. Data by itself is just noise, but when Big Data is organized into helpful analytics, it can provide valuable ongoing transportation insights.
But how should it be organized? To choose the most effective and accurate analytics, users must understand what Big Data for transportation is, where it comes from, and how it is created.
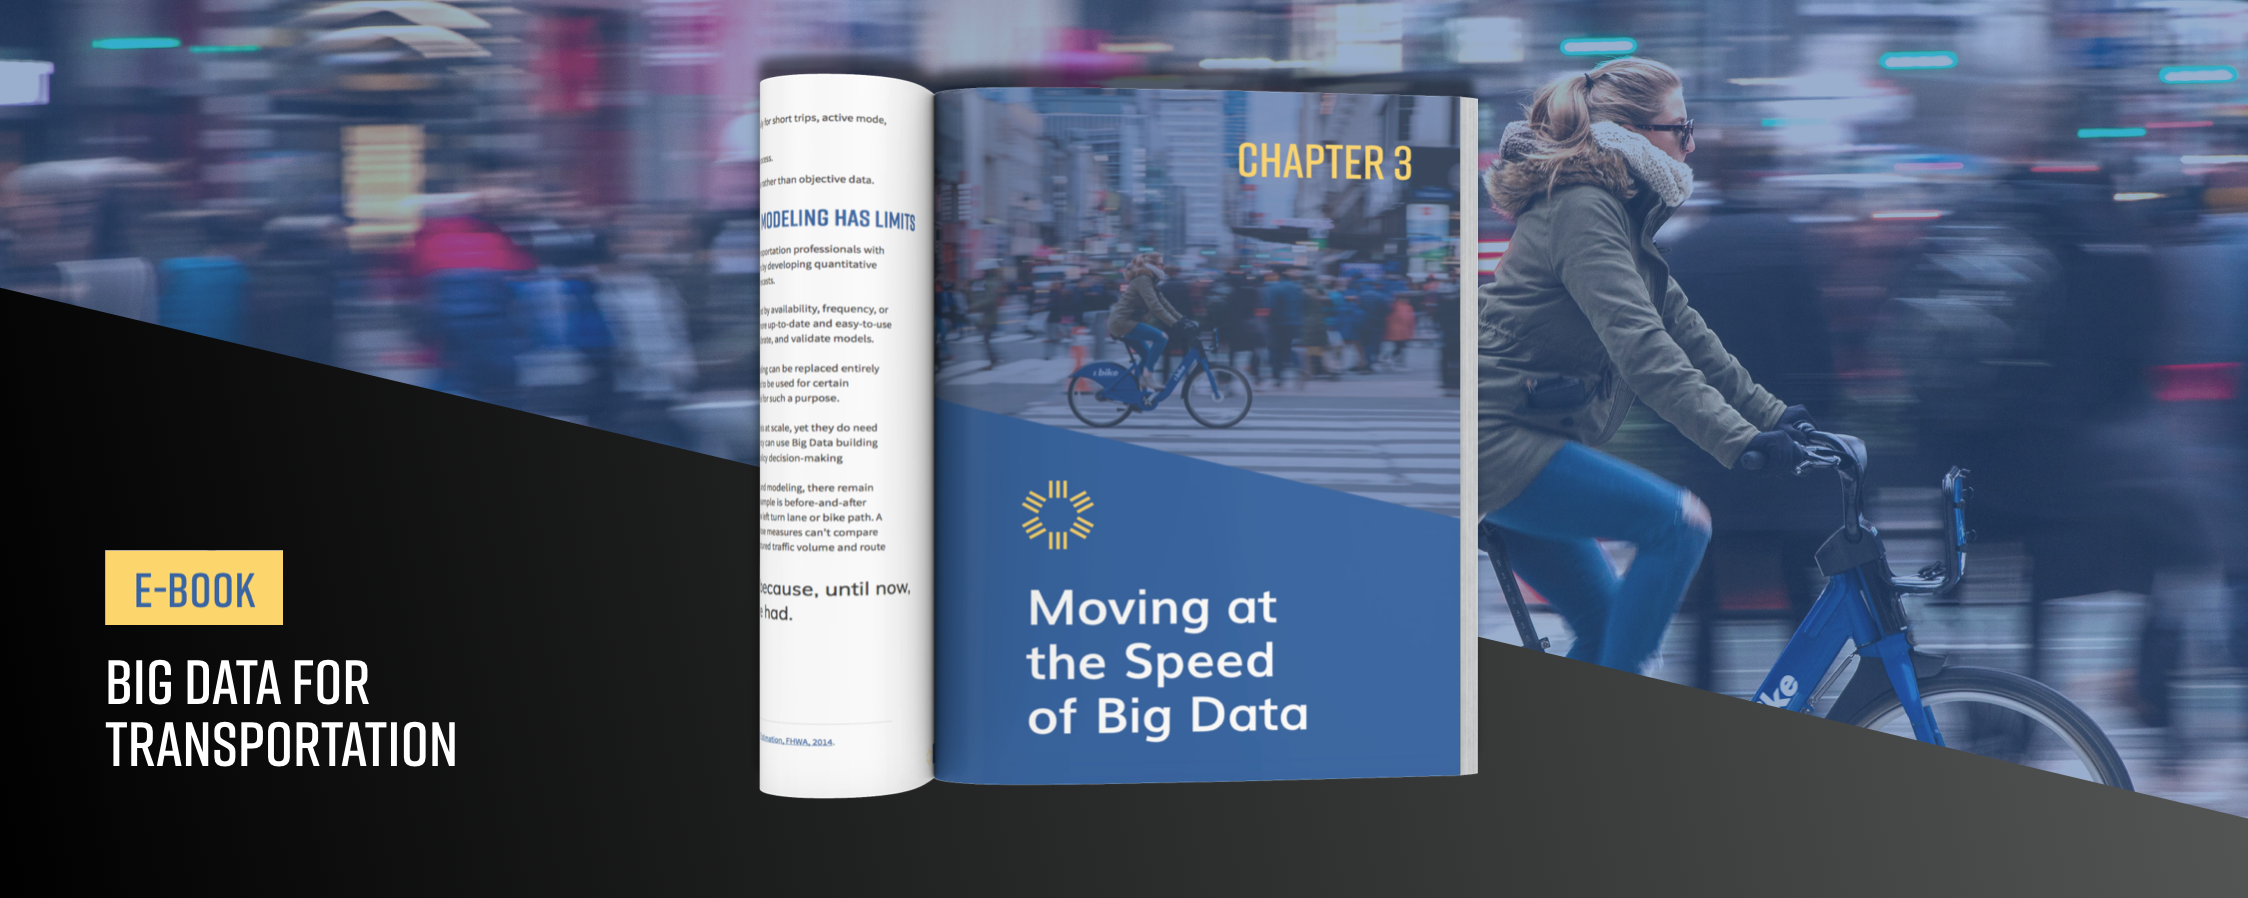
In part one of our Modern Mobility series, we examined the growing challenges facing today’s transportation experts. Part two revealed where traditional analytics methodology falls short. Here, we examine how Big Data for transportation works and, more importantly, how to evaluate transportation analytics.
What’s Behind Big Data?
Big Data is collected from applications installed on mobile devices — Location Based Services (LBS), and from navigation GPS systems in cars and trucks. The data is then contextualized, aggregated, and normalized into travel patterns to create metrics, or analytics.
Much like modeling relies on complex mathematical formulas, transportation Big Data metrics rely on computer algorithms and, sometimes, machine learning. Software engineering and data science expertise is increasingly important for understanding and evaluating Big Data sources for transportation metrics.
At a minimum, data scientists should be able to provide some level of transparency by describing the data sources used, how the data is handled, and explaining (at a high level) the modeling behind Big Data algorithms and machine learning models.
A company with an effective data analytics solution should also have multiple proven uses with actual customers for their metrics, and not simply theoretical applications.
Big Data Privacy Protection
Responsible companies creating transportation analytics use Big Data in ways that do not facilitate the tracking of individuals, or the sending of marketing messages targeted to individual devices (such as cellphones). Instead, such companies use Big Data to describe patterns in the movement of composite groups of people.

Best practices require that privacy protections are built into the entire product-creation process, including technical safeguards such as automated privacy and coverage checks, and multilayered anonymization and aggregation techniques to ensure the ongoing protection of data.
These technical privacy safeguards should be supported by administrative safeguards, employee training, and a robust secure storage and processing infrastructure that includes ongoing system audits and controls.
Validating Transportation Analytics
Validation is a critical step that confirms the integrity and consistency of Big Data analytics. Transportation analytics should be validated against an existing data set that has been confirmed for accuracy. In most cases this is data from permanent road sensors, bicycle, and pedestrian counters.
Validated travel model results can also be used to confirm the comprehensiveness of Big Data analytics, as can household travel surveys and U.S. Census data. Multiple validations can also be used to support the reliability of a single analysis.
Eight Questions for Analytics Providers
Searching for a source for Big Data for transportation metrics? These are the eight key questions for evaluating analytics providers:
- How big is the sample size? The larger the sample size, the lower margin for error in the data. Data suppliers should be transparent about sample sizes, particularly for individual analysis results.
- How many data sources? The most comprehensive and unbiased data sets draw from multiple sources.
- How frequently are the data sources updated? Regular updates allow for more granularity and greater understanding of trends over time.
- Are there coverage gaps? Ideally metrics should be able to drill down to rural areas, small streets, and individual intersections.
- What modes do the metrics include? Metrics should be able to identify travel by personal and commercial vehicles, transportation network company driving, bicycle trips, pedestrian trips, transit, and more.
- Do the analytics include trip- and traveler-specific detail? Look for analytics providers that include demographic information, trip purpose, visitor information, and more.
- Do the analytics offer date-specific measurement? Specifying dates allow for the measurement of movements during historical events, and enable the creation of before-and-after studies.
- How is the analytical information accessed? Look for an on-demand platform with access to run multiple studies, rather than a one-time download of a single analysis.
The only constant about Big Data is that it is constantly changing. Transportation analytics providers must evolve with the various and emerging Big Data by bringing in new sources and recalibrating algorithms literally every day.
A powerful analytics solution isn’t a magic answer to every question or problem that planners and managers face, but does offer a flexible, up-to-date, and easy-to-use tool in the transportation toolbox. Such a solution can facilitate quick testing of a hypothesis; support and feed existing data sources like modeling and sensors; provide facts to inform public discussion or opinion; feed factoring and expansion, and more.
Download our eBook to see eight real-life case studies that illustrate the ways Big Data is helping planners, managers, engineers and others move at the speed of today’s transportation industry.