SAFETY STUDIES
Lead with multimodal and granular trip and traveler insights to power your safety investment decisions. Minimize traffic fatalities and injuries with transportation data that can help identify critical roadways and areas with vulnerable road users.
Utilize data-based evidence to:
- Accelerate adoption of the Safe System Approach
- Support HSIP, Vulnerable Road User Safety Assessment, SS4A, and more
- Promote Vision Zero and Complete Streets policies
- Encourage community involvement and public outreach
GET STARTEDREAD CASE STUDY
Save time and money by automating data collection and ensuring a safety-first approach for all projects

Develop a path to zero fatalities by identifying high-risk locations in your network with volume, speed, and other trip data.

Ensure safety initiatives are equitable with historical data on household, employment, income, and disability status.

Prioritize safe active transportation infrastructure, justify funding, and encourage public involvement with proven bike and pedestrian data.
“We no longer have to make assumptions about people’s trip activity and travel behaviors. Now we have data to support our research, and it separates fact from fiction.”
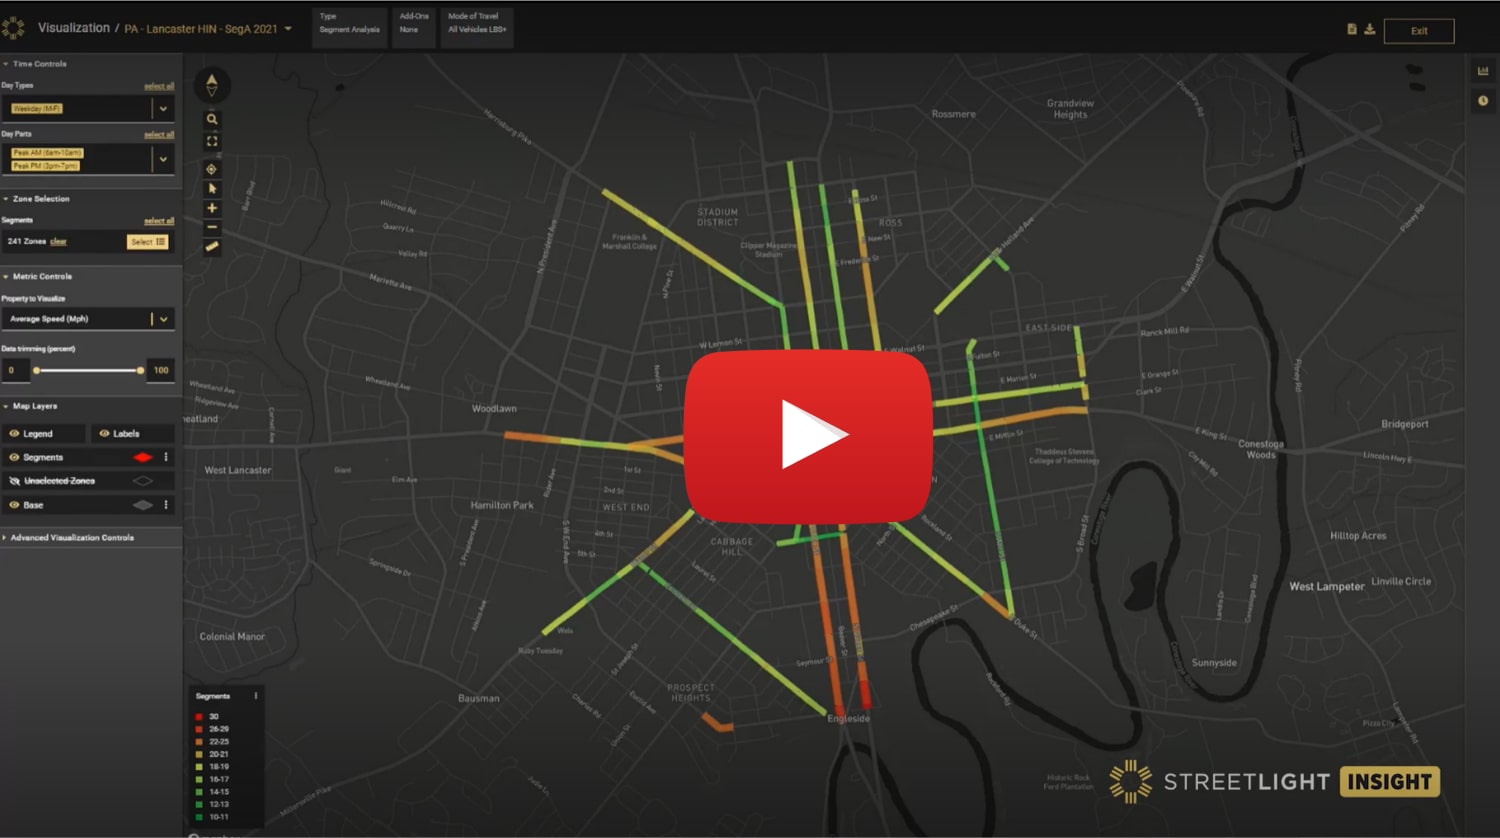
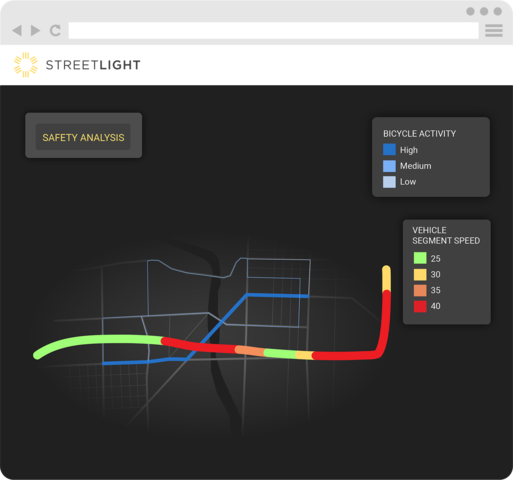
SAFETY STUDY DEMO
Analyze potential risks to bicyclists and pedestrians on a roadway
See how planners can look at speed, traffic volume, and bicycle and pedestrian activity on a roadway to determine the potential risk to road users and normalize total crashes to create an effective safety exposure model.
WATCH VIDEO
Ensure safety infrastructure investments are focused with multimodal and demographic insights
Which locations are high-priority sites?
Visualize volume, VMT, speed, bike and pedestrian activity to identify high-risk intersections or corridors.
When are safety incidents likely to happen?
Compare trip and traveler activity by time of day and day of the week.
Which road users are most vulnerable?
Access historical multimode and demographic data (age, race, disability) to identify vulnerable users.
Which safety countermeasures are most effective?
Compare changes in travel time, traffic volume, speed to measure the effectiveness of safety projects.
Prioritize projects and suggest countermeasures with quick access to empirical data
Explore additional solutions to complete your transportation picture
SAFETY DATA HANDBOOK
Save Lives with Data-Driven Transportation Safety Planning
This Safety Data Handbook shares key vehicle, bicycle, and pedestrian data and how to use it for safety initiatives including Vision Zero, Complete Streets, MIRE requirements, and workplace safety.
READ SAFETY HANDBOOKVIDEO
Analyzing Data at Scale for Safe Streets Project
StreetLight was used in Pinellas County to assess what factors were contributing to the rise in “kill or serious injury” (KSI) collisions and devise Safe Street strategies.
ROAD DIETS
The Data Behind Effective Road Diets
By removing or repurposing lanes of traffic, a road diet can improve safety, cut emissions, and reduce traffic. See how they work, with real road diet examples and the data behind their success.
READ IT NOWCOMPLETE STREETS
The Complete Guide to Complete Streets
Want to make streets safer for ALL road users? See how Complete Streets initiatives save lives, and how digital traffic data can help implement them effectively.
Talk to Us
Get multimodal data to deploy innovative strategies that tackle safety concerns for all road users.
*indicates a required field