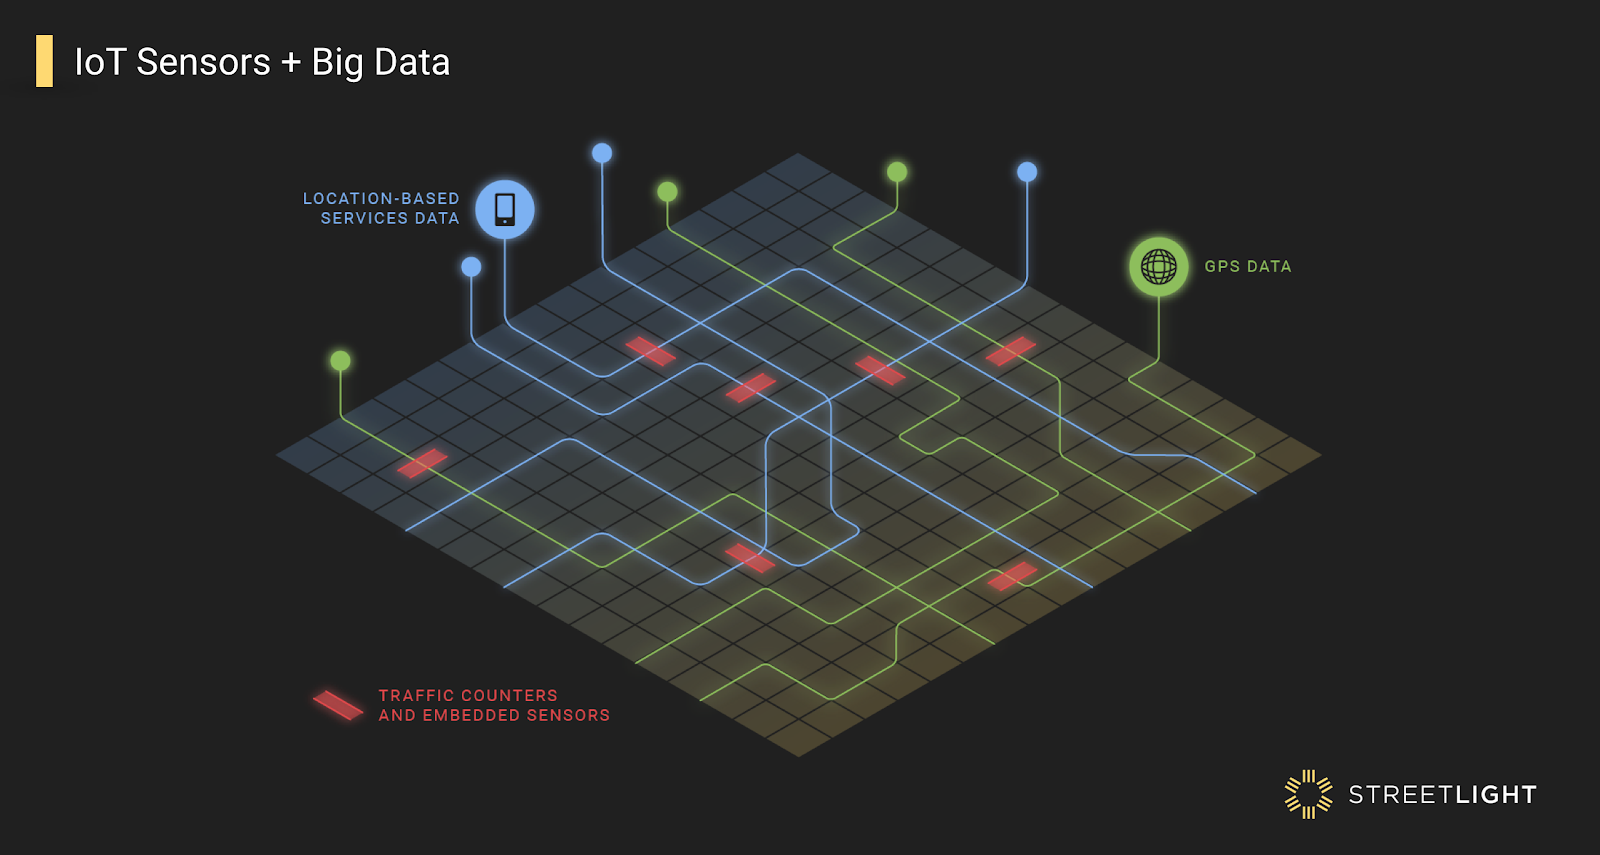
For decades, states, cities, and municipalities have invested in Internet of Things (IoT) infrastructure and Smart City sensors for measuring transportation, but few have been able to comprehensively connect the data dots they’ve been collecting.
One example is embedded road sensors (usually electrically conductive loops installed in the pavement, sometimes video or radar options) that provide traffic counts, but are built only into a tiny fraction of our roads.
This leaves a lot of gaps between “data dots” that the billions of location records from smart phones and navigation devices can solve. StreetLight Data recently rolled out updates to our 2018 AADT suite of metrics, expanding our North American traffic counts to virtually every roadway in both the U.S. and Canada. Our accuracy improved by 21% overall, to an R-squared correlation of .96 (for more details on our validation data, see our white paper).
How did we get such great results? By fusing public IoT transportation data with our proprietary mobile data.
This process illustrates our philosophy about how IoT and Big Data are not in a race — they need each other to enable truly smart and cost-effective transportation leadership.
While most of our clients, understandably, think of us as the company that specializes in Big Data from mobile devices, we think of ourselves as the company that fuses such Big Data with lots of other data streams, including IoT. Machine learning that fuses lots of sources, millions of times over, gives us accurate, meaningful results.
Our experience leads us to this conclusion: By fusing a reasonable number of permanent, well-maintained IoT sensors with our mobile data resources (and some excellent data science) we can provide robust, accurate, evolving data that describes transportation activity on every road, sidewalk, bikelane, and neighborhood. We apply this sort of fusion every day at StreetLight, and look forward to increased synergy as more and more IoT transportation sensors roll out.

Benefits and Drawbacks: IoT Transportation Sensors
IoT transportation sensors, in particular permanent sensors that count cars, pedestrians, bikes and other important assets, have some key strengths. Primarily, if well maintained, they can be very accurate, providing a consistent count at a precise location.
They have a few really important weaknesses as well. The first is upfront cost: A typical permanent road sensor costs $25,000-$80,000+ to install according to the Georgia Department of Transportation, and a permanent bike and pedestrian counter costs $9,000 (without installation).
The second, oft-overlooked drawback is ongoing cost: The maintenance for these sensors exceeds installation costs over time. If maintenance is deferred, the counters lose accuracy, causing misreadings and havoc.
These sensors only count at one location, and don’t capture contextual information such as vehicle origin, destination, income, tourist status, etc.
In short, installing a network of the most basic IoT transportation sensors at every mile — or even every hundred miles! — across a road, bike, or pedestrian network would be absurdly expensive. Plus, it wouldn’t even give us the richness we need to make good transportation decisions.
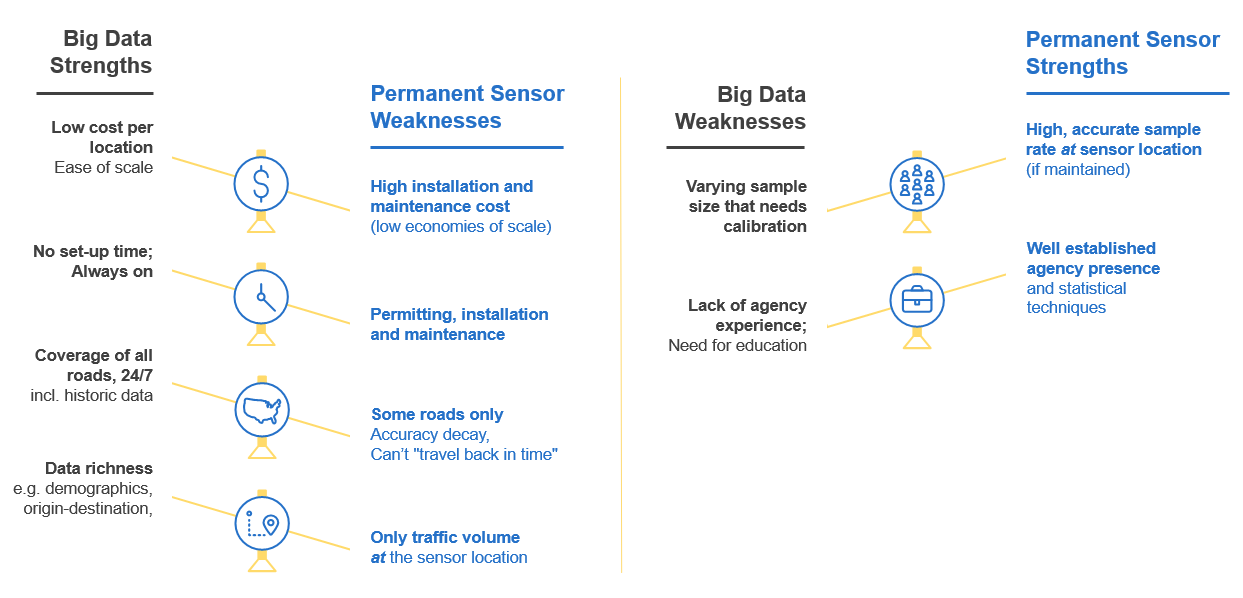
Figure 1: Summary of the strengths and weaknesses of both methods that we address with our “fusion” approach.
Benefits and Drawbacks: Big Data
Big Data like that which StreetLight sources from LBS and GPS has several critical strengths. First, it’s ready to go for any location. There is no set-up or installation process. Simply select a location in our software. This means that the marginal cost of creating another analytic (adding another corner, or 1000 more corners) is quite low.
Second, Big Data allows patterns to unfold over time and space. Thus we can see richer information like origin and destination, inferred demographics, and much more.
There is one detriment: Big Data is changing all the time. It’s a new, dynamic source that sometimes creates fresh challenges. For example, at StreetLight our sample size of usable trips increases every month. A larger sample size means more accuracy! But a changing sample size can make it difficult to accurately measure trends from month to month.
Why Fusion Works: IoT Sensors + Big Data
Successful utilization of transportation data is not a matter of replacing all IoT or permanent counters with mobile device data. Fusion gives us the best from both measurement methods. This means maintaining some permanent counts for vehicles, and continuing to build a reliable array of permanent counters for bikes, pedestrians, and other key modes of travel.
The ideal system blends this sensor array with massive mobile data into a programmatic, regular system which compares, recalibrates, and adjusts each data set based on the information gleaned from the other.
The result? More accuracy, more spatial granularity, and a better reflection of an increasingly complex transportation landscape. All this additional richness will be available at a much lower cost per mile, and with far more rapid updates.
Transportation nerd note: You can think of this is an evolution of the model in which permanent counters are used to create seasonal factors for temporary count expansion, but for the era of Big Data.
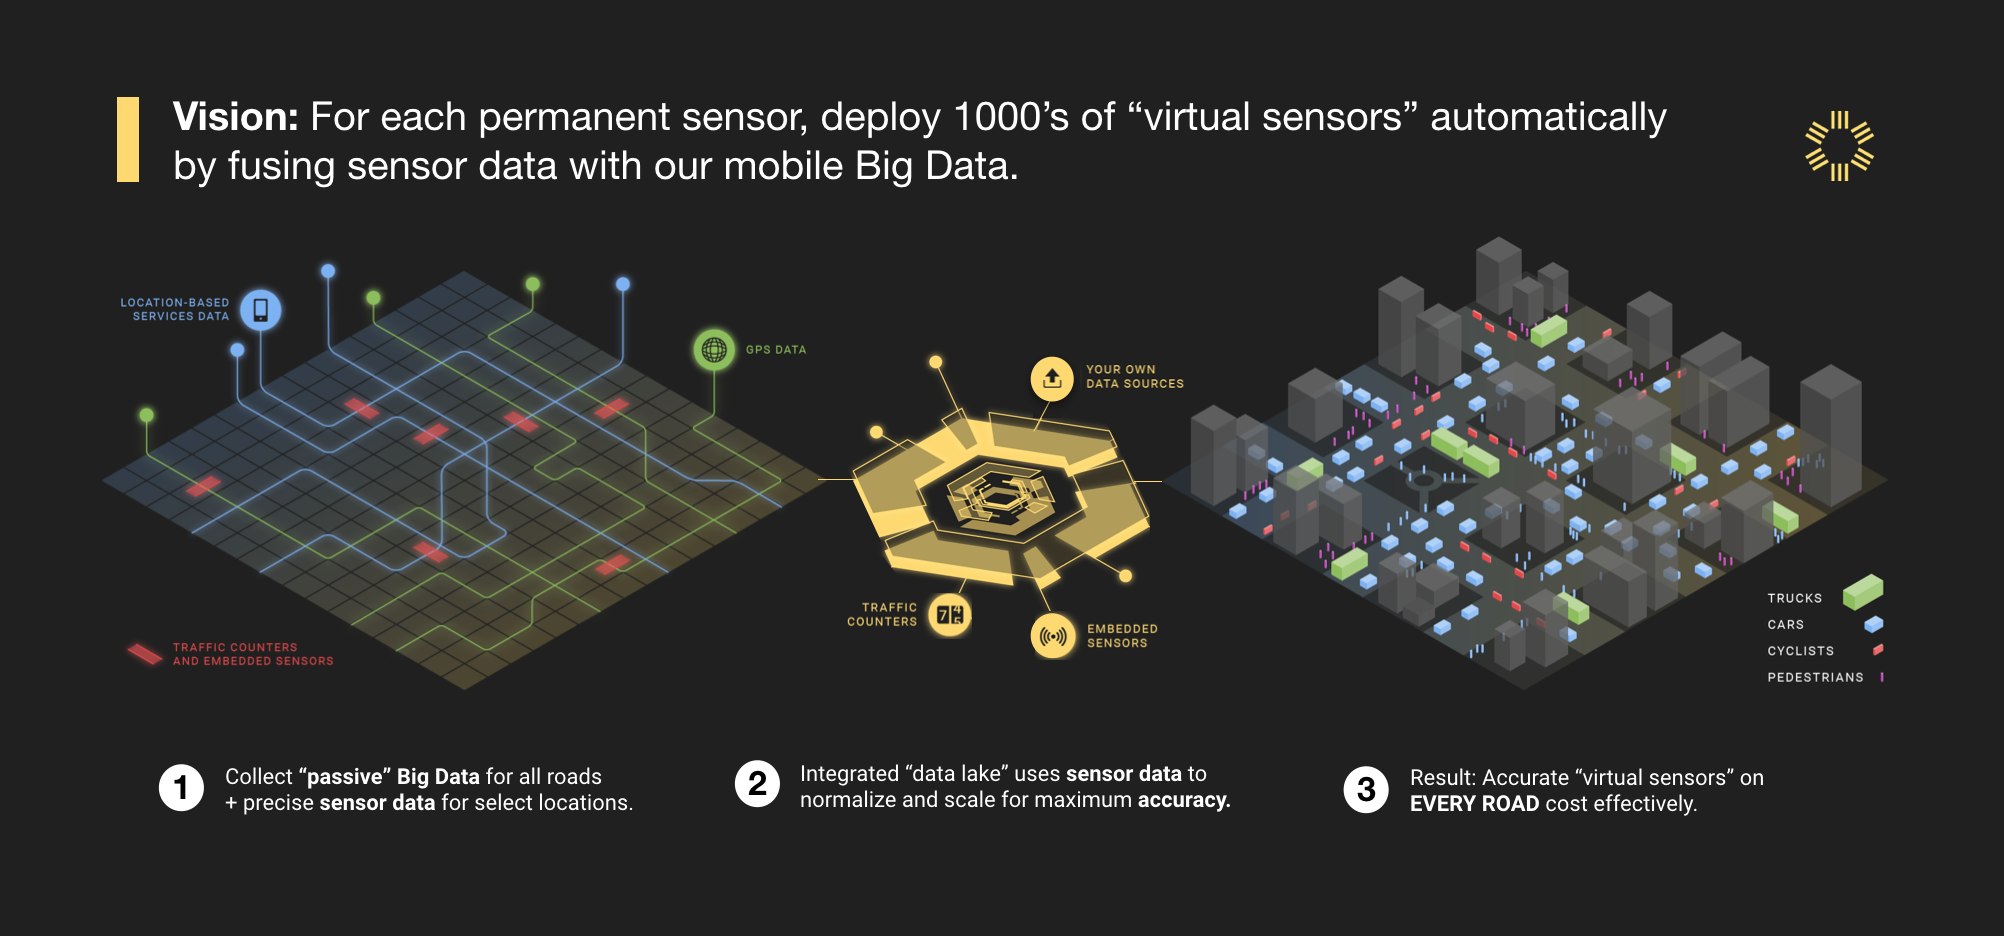
Figure 2. How it works: Fusing IoT sensor data with our mobile Big Data
Putting Fusion Into Practice
StreetLight puts this into practice regularly, as exemplified by our new monthly AADT metrics. Here is the fusion process we perform monthly:
- Acquire publically available data from thousands of permanent vehicle counters.
- Classify these count locations by various factors including geography, urban density, weather profile, and more, ensuring a good distribution of counts across all classes.
- Measure the penetration of our Big Data against those counters
- Use our machine learning system to integrate all this information (our white papers can explain the details).
Now users of our AADT estimates in the U.S. and Canada get the benefit of fusing those permanent counters and Big Data together.
The Road Ahead for Transportation Data
We continue to expand this vision and apply it to vehicular traffic by type (trucks, buses, etc) as well as critically under-measured modes like pedestrians and bikes. However, there are far fewer permanent bike and pedestrian counters installed and maintained (and pumping reliable public data).
Meanwhile, we’ve set up tools for StreetLight InSight® users to add data from their vehicle, bike and pedestrian counts. We’re also calling on data providers to partner on alternate modes — to expand our vision for fusing IoT and Big Data — and help the industry gain access to even better mobility data.