
With bicycling on the increase across the country, organizers should be expecting record numbers of riders at upcoming charity rides. Many of these riders either will be new to cycling, or will have returned to it recently after a long hiatus. For inexperienced cyclists, sharing the road with fast-moving vehicles can be too terrifying to consider.
How can organizers identify potential high-risk areas, and choose routes where cyclists feel safe? I analyzed one of the country’s largest and most well-known charity rides to share ways that riders and organizers can plan routes and maximize safe event participation.
Ride Along With Pelotonia
Encompassing three days of events in Columbus, Ohio, Pelotonia began raising funds for cancer research in 2008. The 11 different bike rides available range from 25 to 100 miles each, providing options for all levels of rider skill and fitness.
Pelotonia makes extensive efforts to prepare cyclists for road riding by offering safety tips on the website and training ride leaders to coach and guide riders during the event.
There are many options that go into choosing a charity ride route, and while safety is one of the most important elements, no ride can remove cars entirely from the equation. As a special projects engineer at StreetLight Data, I have extensive transportation data at my fingertips. I was curious to see what our Metrics could reveal about vehicle traffic on Pelotonia’s routes.
Analyzing Vehicle Volume and Speed
I ride my bike to run errands, get exercise, and explore new places. I’m used to planning long routes, including a cross-country ride several years ago. Two of the most important factors I consider when planning a route are car volumes and speeds on the roads I’ll be riding.
Many of Pelotonia’s rides share the same road segments. To analyze them, I downloaded the KML files for each of the routes and used GIS to combine and split them at regular intervals. I then uploaded them as line zones to our transportation analytics software platform, StreetLight InSight®.
I can calculate volumes and speeds in StreetLight Insight® by simply running a Segment Analysis on the 2019 event (2020 was cancelled due to COVID restrictions, and 2021 routes haven’t yet been announced). I used the platform’s default settings to analyze metrics by average day, weekday, and weekend day, and then further by general time of day. I’ll be looking specifically at average weekend day speed and Volume Metrics from 2019.
Counting Columbus’ Cars
The shortest and longest routes for Pelotonia start in downtown Columbus. My visualization shows immediately that these are the higher-volume roads for vehicles, with vehicle volume decreasing the farther you get out of town. Some segments on South High Street see around 12,000 cars on the average weekend day.
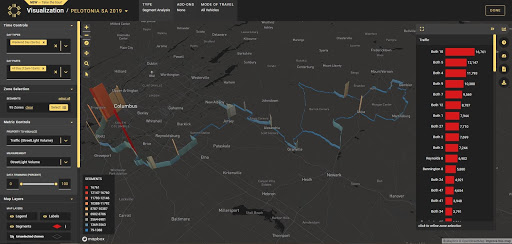
Figure 1: Vehicle volume on the Pelotonia cycling routes.
There also appear to be a few half-mile segments where the bike route takes roads with 10,000 cars on the average weekend day – places for cyclists to be extra vigilant. One short segment (only about 1,500 feet) sees more than 16,000 vehicle trips on an average weekend day.
Seeing Where Vehicles Speed Up
Vehicle traffic volumes decrease the farther away you ride from Columbus, but average speeds go up. The half-mile segments with about 10,000 vehicles on the average weekend day have speeds up to 35 mph. Some roads have a 50 mph average for speeds on weekend days, which means plenty of cars are driving even faster. And that 1,500-foot high-volume section averages speeds of 40 mph, which makes it definitely the most dangerous segment.
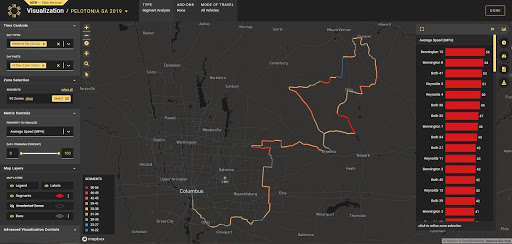
Figure 2: Vehicle speeds on the Pelotonia cycling routes.
This is something I’d want to consider when selecting a route – would I prefer roads with low traffic volume but high speeds, or the other way around? I personally favor low traffic, so I would opt for one of the routes that start outside of town. Although cars are traveling faster, I feel safer with fewer cars, and the ride is quieter and more enjoyable.
Which Routes Are Safer?
Those doing a century ride (100 miles) can make a route choice at around the halfway point. The Bennington Church route turns to the west and the Reynolds Road route to the east (one can also choose to ride only portions of these two routes).
In terms of traffic and speeds, these two options look fairly equivalent to me. Riders fit enough to take on a century are usually experienced in sharing the road with vehicles, and are likely to make their route choices based on other factors, such as amount of climbing, scenery, etc.
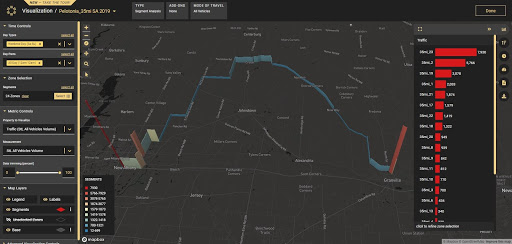
Figure 3: Vehicle volume on the “beginner” 35-mile Pelotonia route.
For beginners, there are two routes that Pelotonia recommends – the 25- and 35-mile routes. I studied these routes to learn more about what vehicle traffic the riders are likely to encounter.
The 25-mile option, although shorter, is the first 25 miles out of Columbus. It therefore shares the road with a higher volume of cars than other routes, but they are traveling at slower speeds.
On the other hand, the 35-miler is a completely different route. The ride utilizes lower-volume roads, and also takes place on a Sunday. A Segment Analysis on this route shows very low weekend traffic and speeds mostly in the 30s and 40s. Pelotonia also mentions that the 35-mile route has less climbing.
Overall, it looks like the 35-mile option may be the safer route for beginning riders uncomfortable with sharing roads with vehicles. Less time on the roads doesn’t always mean less risk for cyclists.