After Donald Trump’s election in 2016, we noticed a major uptick in complaints about traffic in his Manhattan neighborhood. That’s no small feat, especially given that New Yorkers are known for complaining about traffic – just ask Jerry Seinfeld. (For the record, we complain about traffic a ton in San Francisco, too.) However, we hesitate to use subjective grumbling to measure the impact of events. Thanks in part to cognitive biases, people have a tendency to exaggerate traffic and other negative events. Since we were curious about exactly how much travel patterns changed in New York after the election, we decided to use Big Data to crunch the numbers ourselves. (Note: Our study originally appeared in USA Today. Click here to read the article.)
Our Analysis: All the Best Data
Using StreetLight InSight®, our easy-to-use web application for transforming Big Data into transportation analytics, we zeroed in on trips that took Fifth Avenue from 57th Street to 55th Street, passing right by Trump Tower (See figure 1 below). This corridor was selected because two of Fifth Avenue’s five lanes were closed to traffic soon after the election. Our goal was to answer two basic questions:
- How much slower were the speeds of personal vehicle trips using this corridor, on average?
- How much longer, on average, did it take for personal vehicles to drive down Fifth Avenue from 57th Street to 55thStreet?
We ran two sets of Metrics* in StreetLight InSight to create a before-and-after analysis. To account for seasonal trends, our “before” period was the last three weeks of November 2015, and our “after” period was the last three weeks of November 2016.

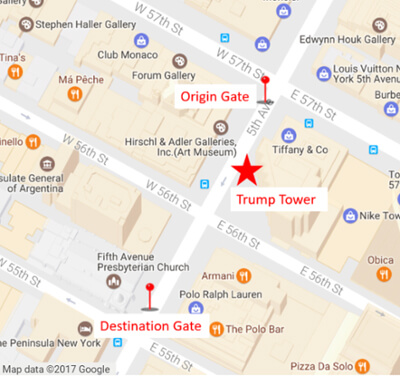
Figure 1: For this StreetLight InSight analysis, we set up two “pass-through zones” – gates that tell StreetLight InSight to analyze the trips that pass through them – on Fifth Avenue. Our origin zone was right after 57th Street and our destination zone was right before 55th Street. This set-up allowed us to analyze all of the trips in our sample that used this corridor.
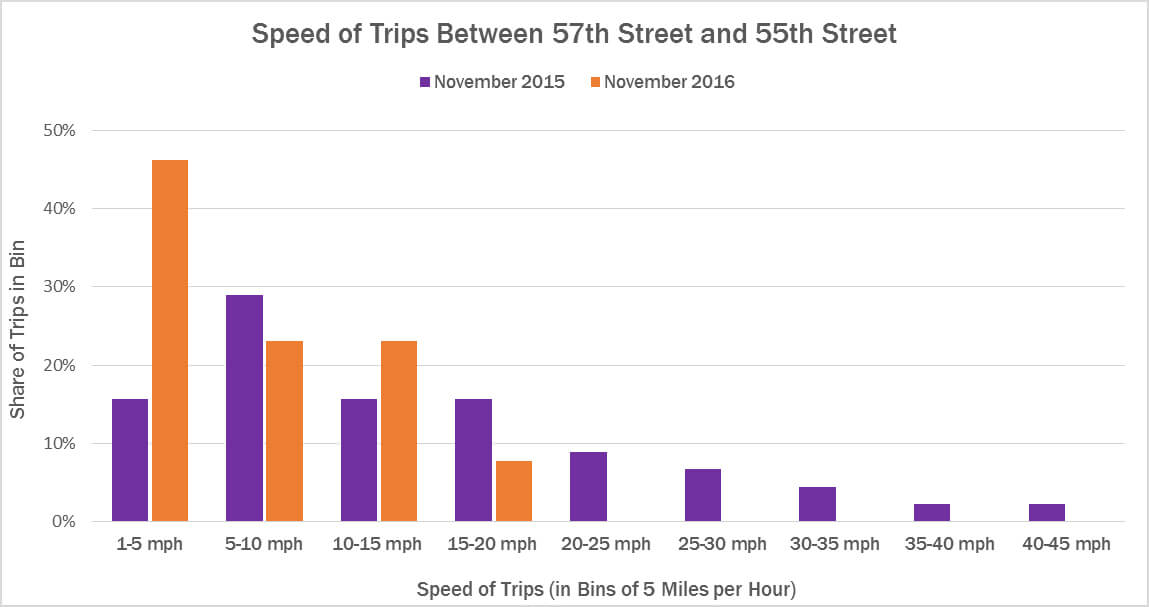
Figure 2: This chart shows the percentage of trips that passed through the corridor at various speeds. In 2015, only ~16% of trips had average speeds between 1 and 5 miles per hour. In 2016, ~46% of trips were that slow. In addition, the 24% of trips over 20 miles per hour that occurred in 2015 simply did not appear in our 2016 sample.
The trip speed was particularly interesting to us: Given that the average speed was 15 miles per hour in 2015, it’s not as though drivers were accustomed to zipping down Fifth Avenue. After taking a closer look, we saw that the difference can be most attributed to a big jump in the share of trips that were going extremely slowly – barely at a crawl – as well as an absence of trips above 20 miles per hour (see Figure 2 above).
There was not an across-the-board decrease in speed. Instead, the share of extremely slow trips nearly tripled. That is a dramatic difference, especially since sitting in a slow-moving car has a tendency to make time pass slowly, too.
Trump Traffic Impact Is Huge
Based on our analysis, President Trump’s election had an extremely significant impact on Fifth Avenue’s traffic. By combining this data with comprehensive origin-destination and corridor metrics for Fifth Avenue and its parallel streets, New York City traffic engineers could empirically evaluate the ways that drivers have responded to the lane and street closures.
This information could add value as they make plans to mitigate the pain of this traffic, including steps like establishing detours, rerouting transit lines, or simply telling drivers about how much additional time to budget for trips down Fifth Avenue.