The Labor Day public holiday celebrates American workers by giving them the day off – or at least, that’s the idea. Here at StreetLight Data, we wanted to find out how many American workers are still commuting to their jobs on Labor Day. The results were surprising: Only about ~56% of American workers get the day off nationwide, with some variation in results across different states. In this blog post, we’ll show you how this type of analysis can help planners prepare for traffic flow for holidays, vacation times, and other special events.
Working on Labor Day: The Analysis
For this study, we analyzed aggregate commuter travel patterns in every state during September 2016. The travel pattern data was derived from geospatial data created by mobile devices; specifically, we used anonymous location records created by smartphone applications that provide Location-Based Services.
Note: We defined a work commuter as someone who goes to the same place during daytime hours most days. This means our analysis does not include workers like plumbers who visit different places each workday.
We wanted to find out:
- What share of workers go to their place of employment on Labor Day?
- Are travel patterns on Labor Day and Labor Day weekend different from other days in September?

Which States Work More?
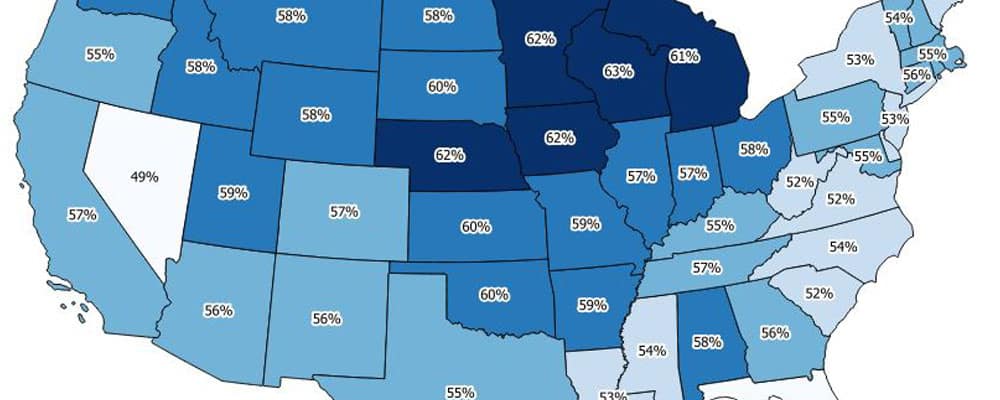
We found that many commuters are still doing their typical commutes on Labor Day. Figure 1, below, shows the share of workers in each state that took the day off on Labor Day 2016. Here are the highlights:
- Northern states seem to take Labor Day to heart the most. Workers in Wisconsin, Minnesota, Iowa, Nebraska and Michigan are more likely to get the day off than any other state.
- Workers in Nevada and Washington, DC are the least likely to get the day off.
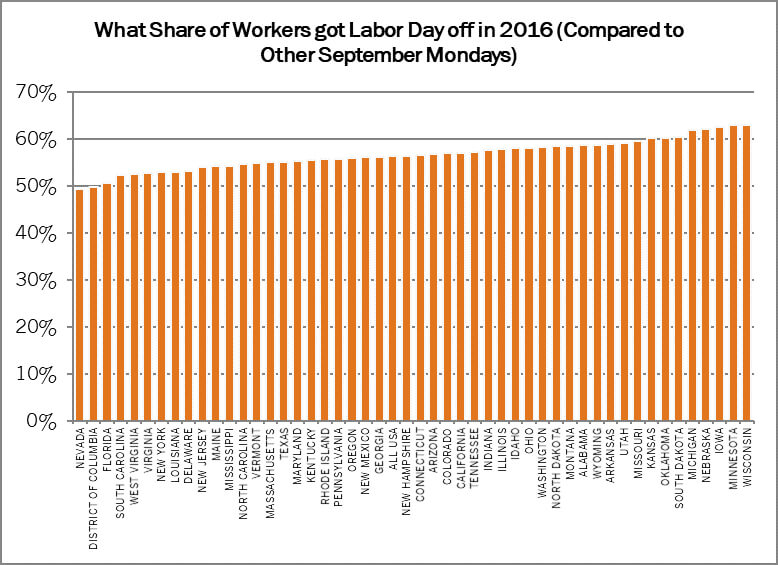
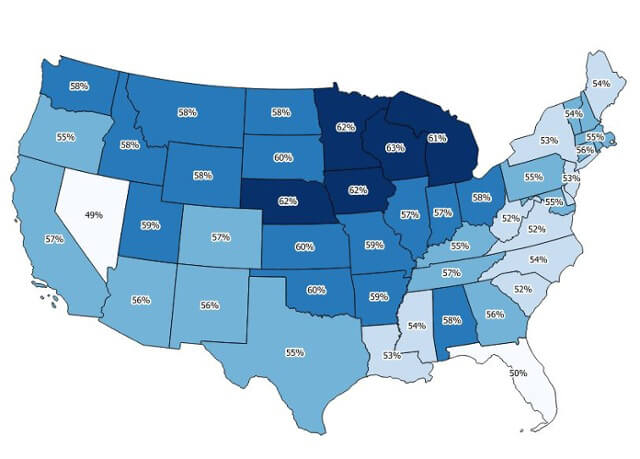
Figure 1: The heat map and chart above visualizes the share of workers in each state that did not commute to their workplaces on Labor Day in 2016.
Next, we decided to go beyond states and look more granularly at travel patterns in individual block groups. Block groups are a Census designation – basically, they’re small neighborhoods that tend to have populations of 600 to 3,000 people.
As you can see in the map in Figure 2, there’s a lot of diversity in Labor Day vacations at the block group level. In fact, vacations appear to be correlated with the industry of workers. For example, agricultural districts seem to be extremely unlikely to take the day off. This makes intuitive sense: Farm animals and fields don’t take public holidays either!
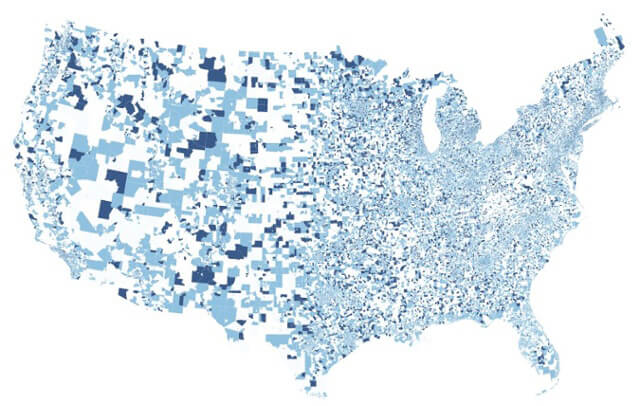
Figure 2: This heatmap visualizes the share of workers who did not commute to work by census block group. The darker the shade of blue, the fewer people commute on Labor Day.
Labor Day Data Sources
To find out who is commuting to their jobs on Labor Day, we analyzed “Location-Based Services data” or “LBS data.” This is geospatial data from smartphones that use Location-Based Services. These apps provide a service to users that is tied to their location: Think weather, shopping, and navigation apps. When these services are provided or are “backgrounding,” they create location records.
All of our LBS data records are anonymized by our suppliers so that all personal identifying information is removed before we receive it. Once we receive this data, we process it algorithmically, looking at patterns of travel activity throughout the month. The location records are organized spatially and temporally into groups in order to infer likely home and work locations and travel patterns.
This processing methodology lets us measure typical Monday commute patterns. For this study, we looked at the commute patterns every Monday in September, then compared them to Labor Day. All data are aggregated and normalized into analytics that describes groups of people, never individuals.
Conclusion
Labor Day may be a day of rest for StreetLight Data, but our analysis shows that’s not the case for many American workers, at least on the basis of their commutes.
This type of traffic analysis can really help planners optimize for their region’s holidays, and other special events. Are your workers staying home or getting the job done? Collect accurate data to make traffic flow easier either way.