Our validated Bus and Rail Metrics include demographics, trip distance, origin-destination pairs, and more. Enrich your transit data sources and access metrics for all regions and routes with the click of a button, without the sample-size challenges of surveys.
LEARN MOREWATCH WEBINAR
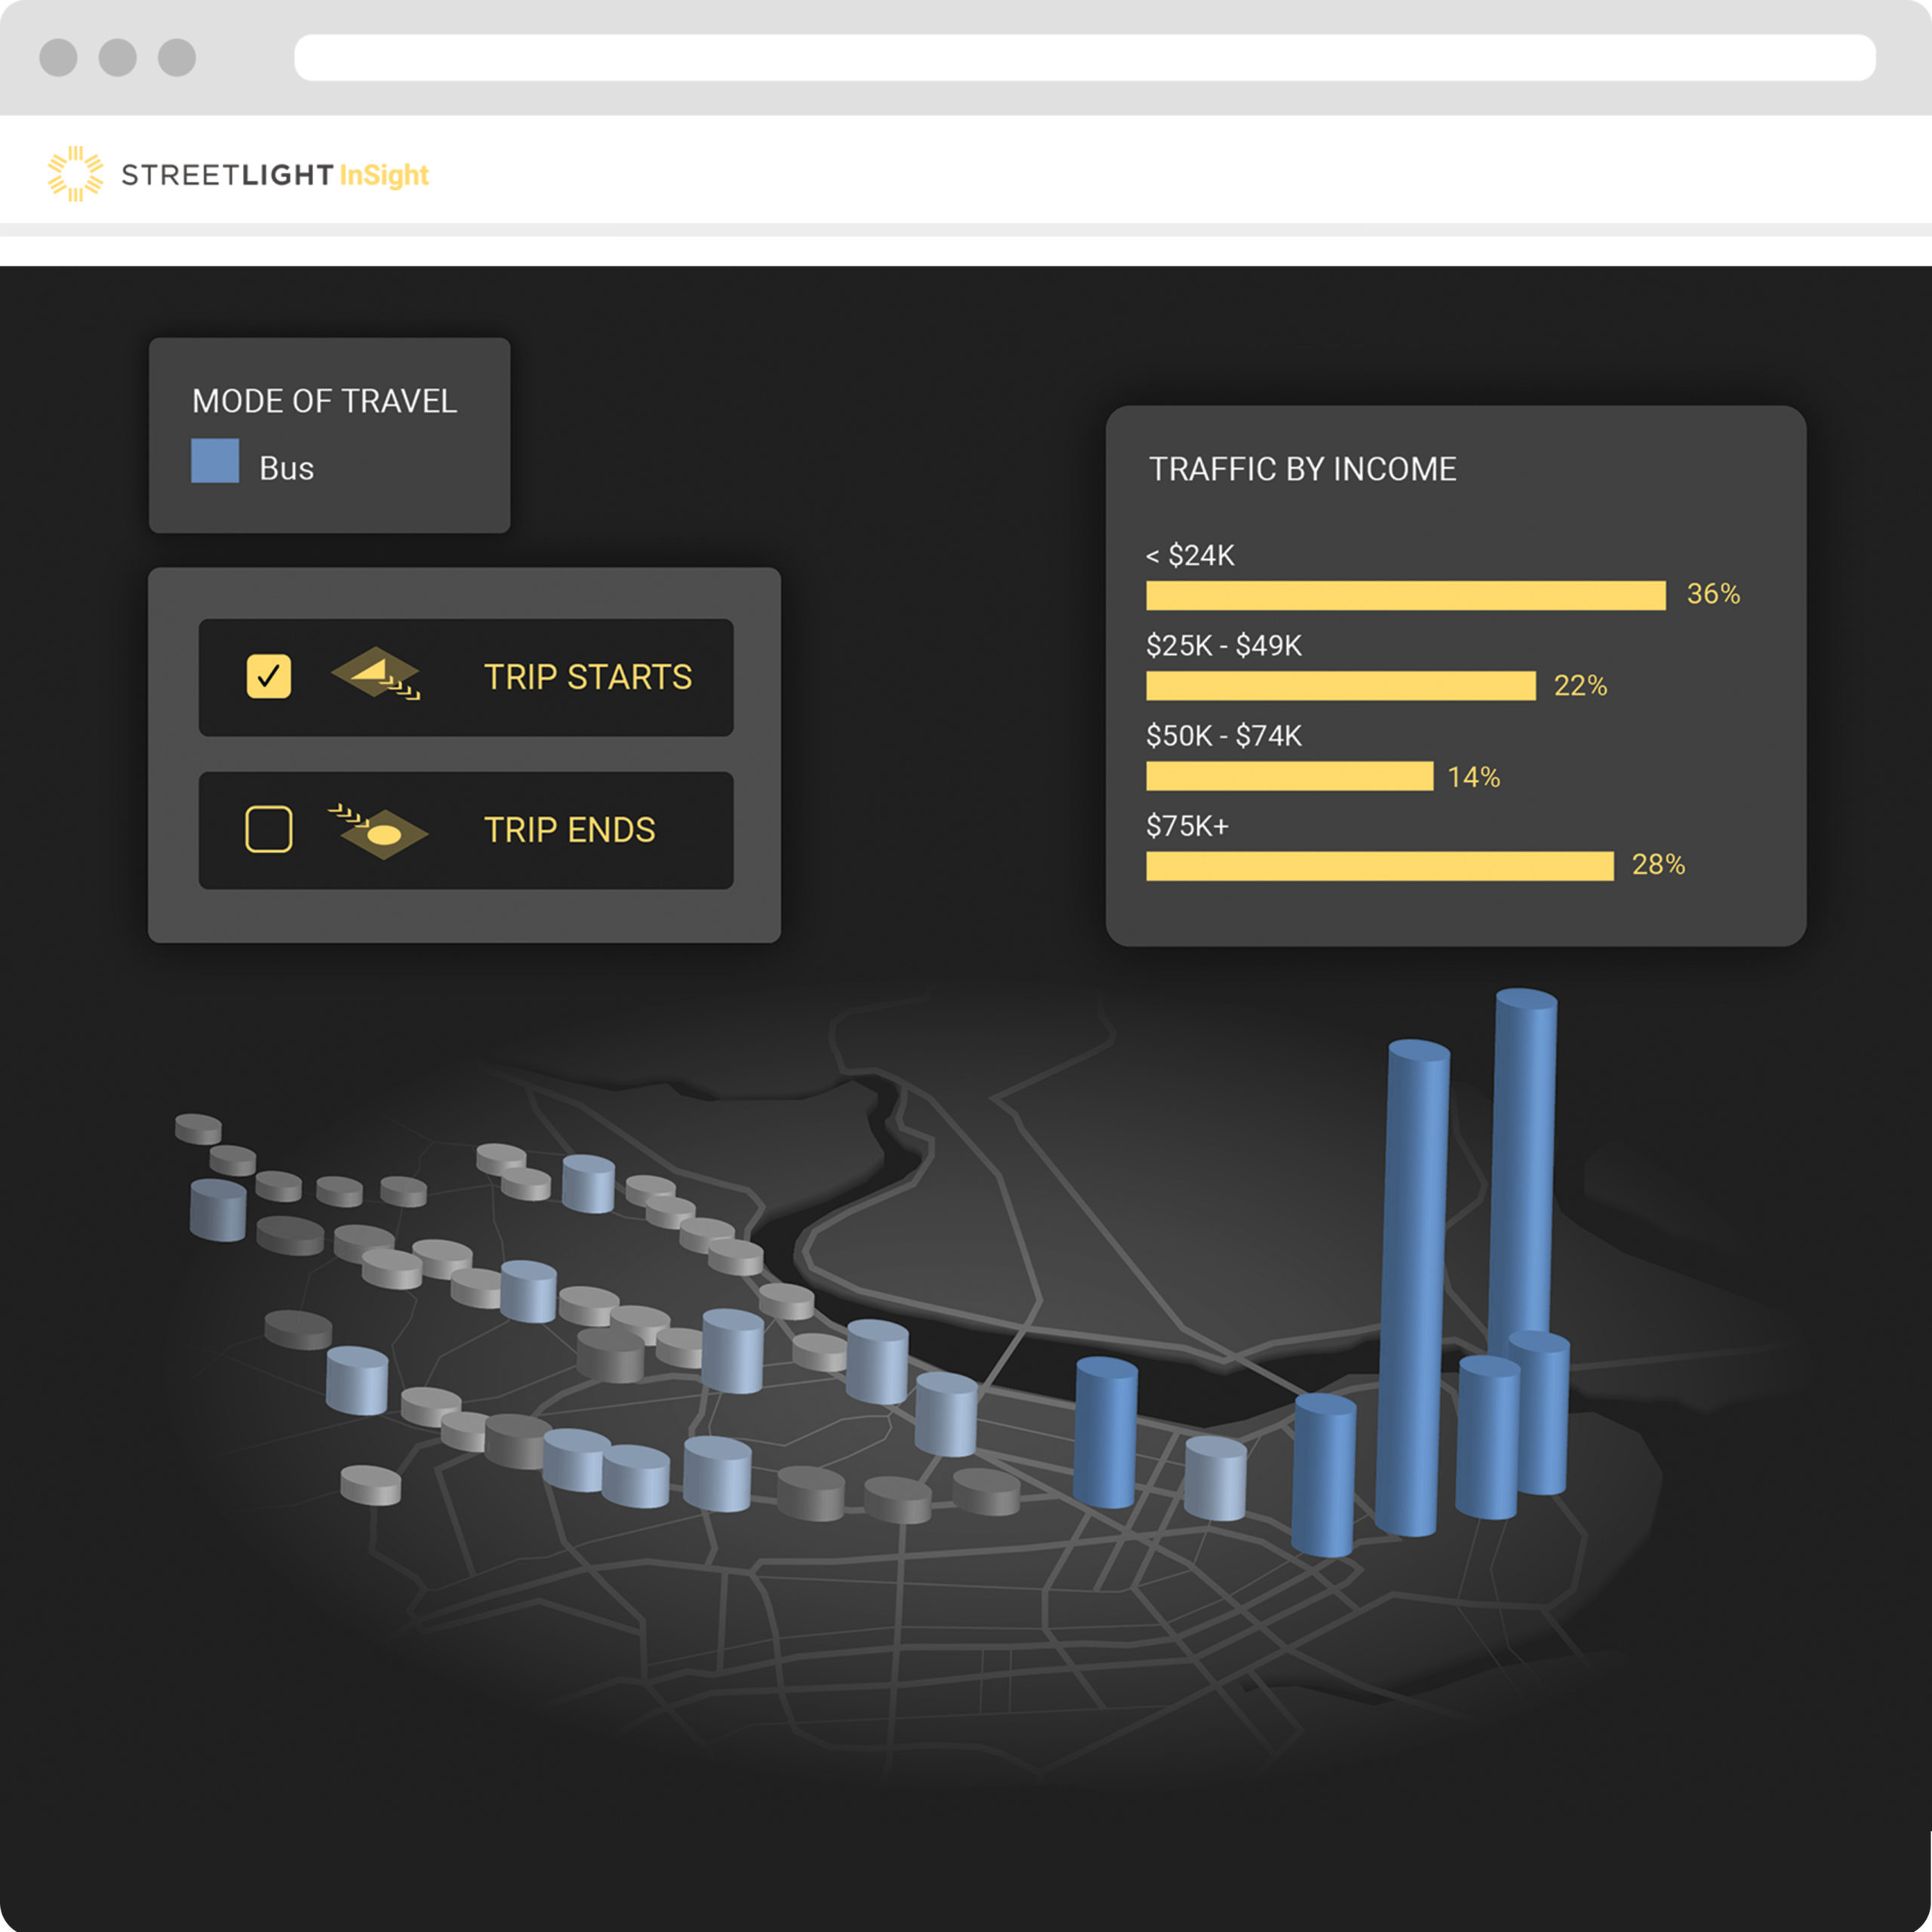
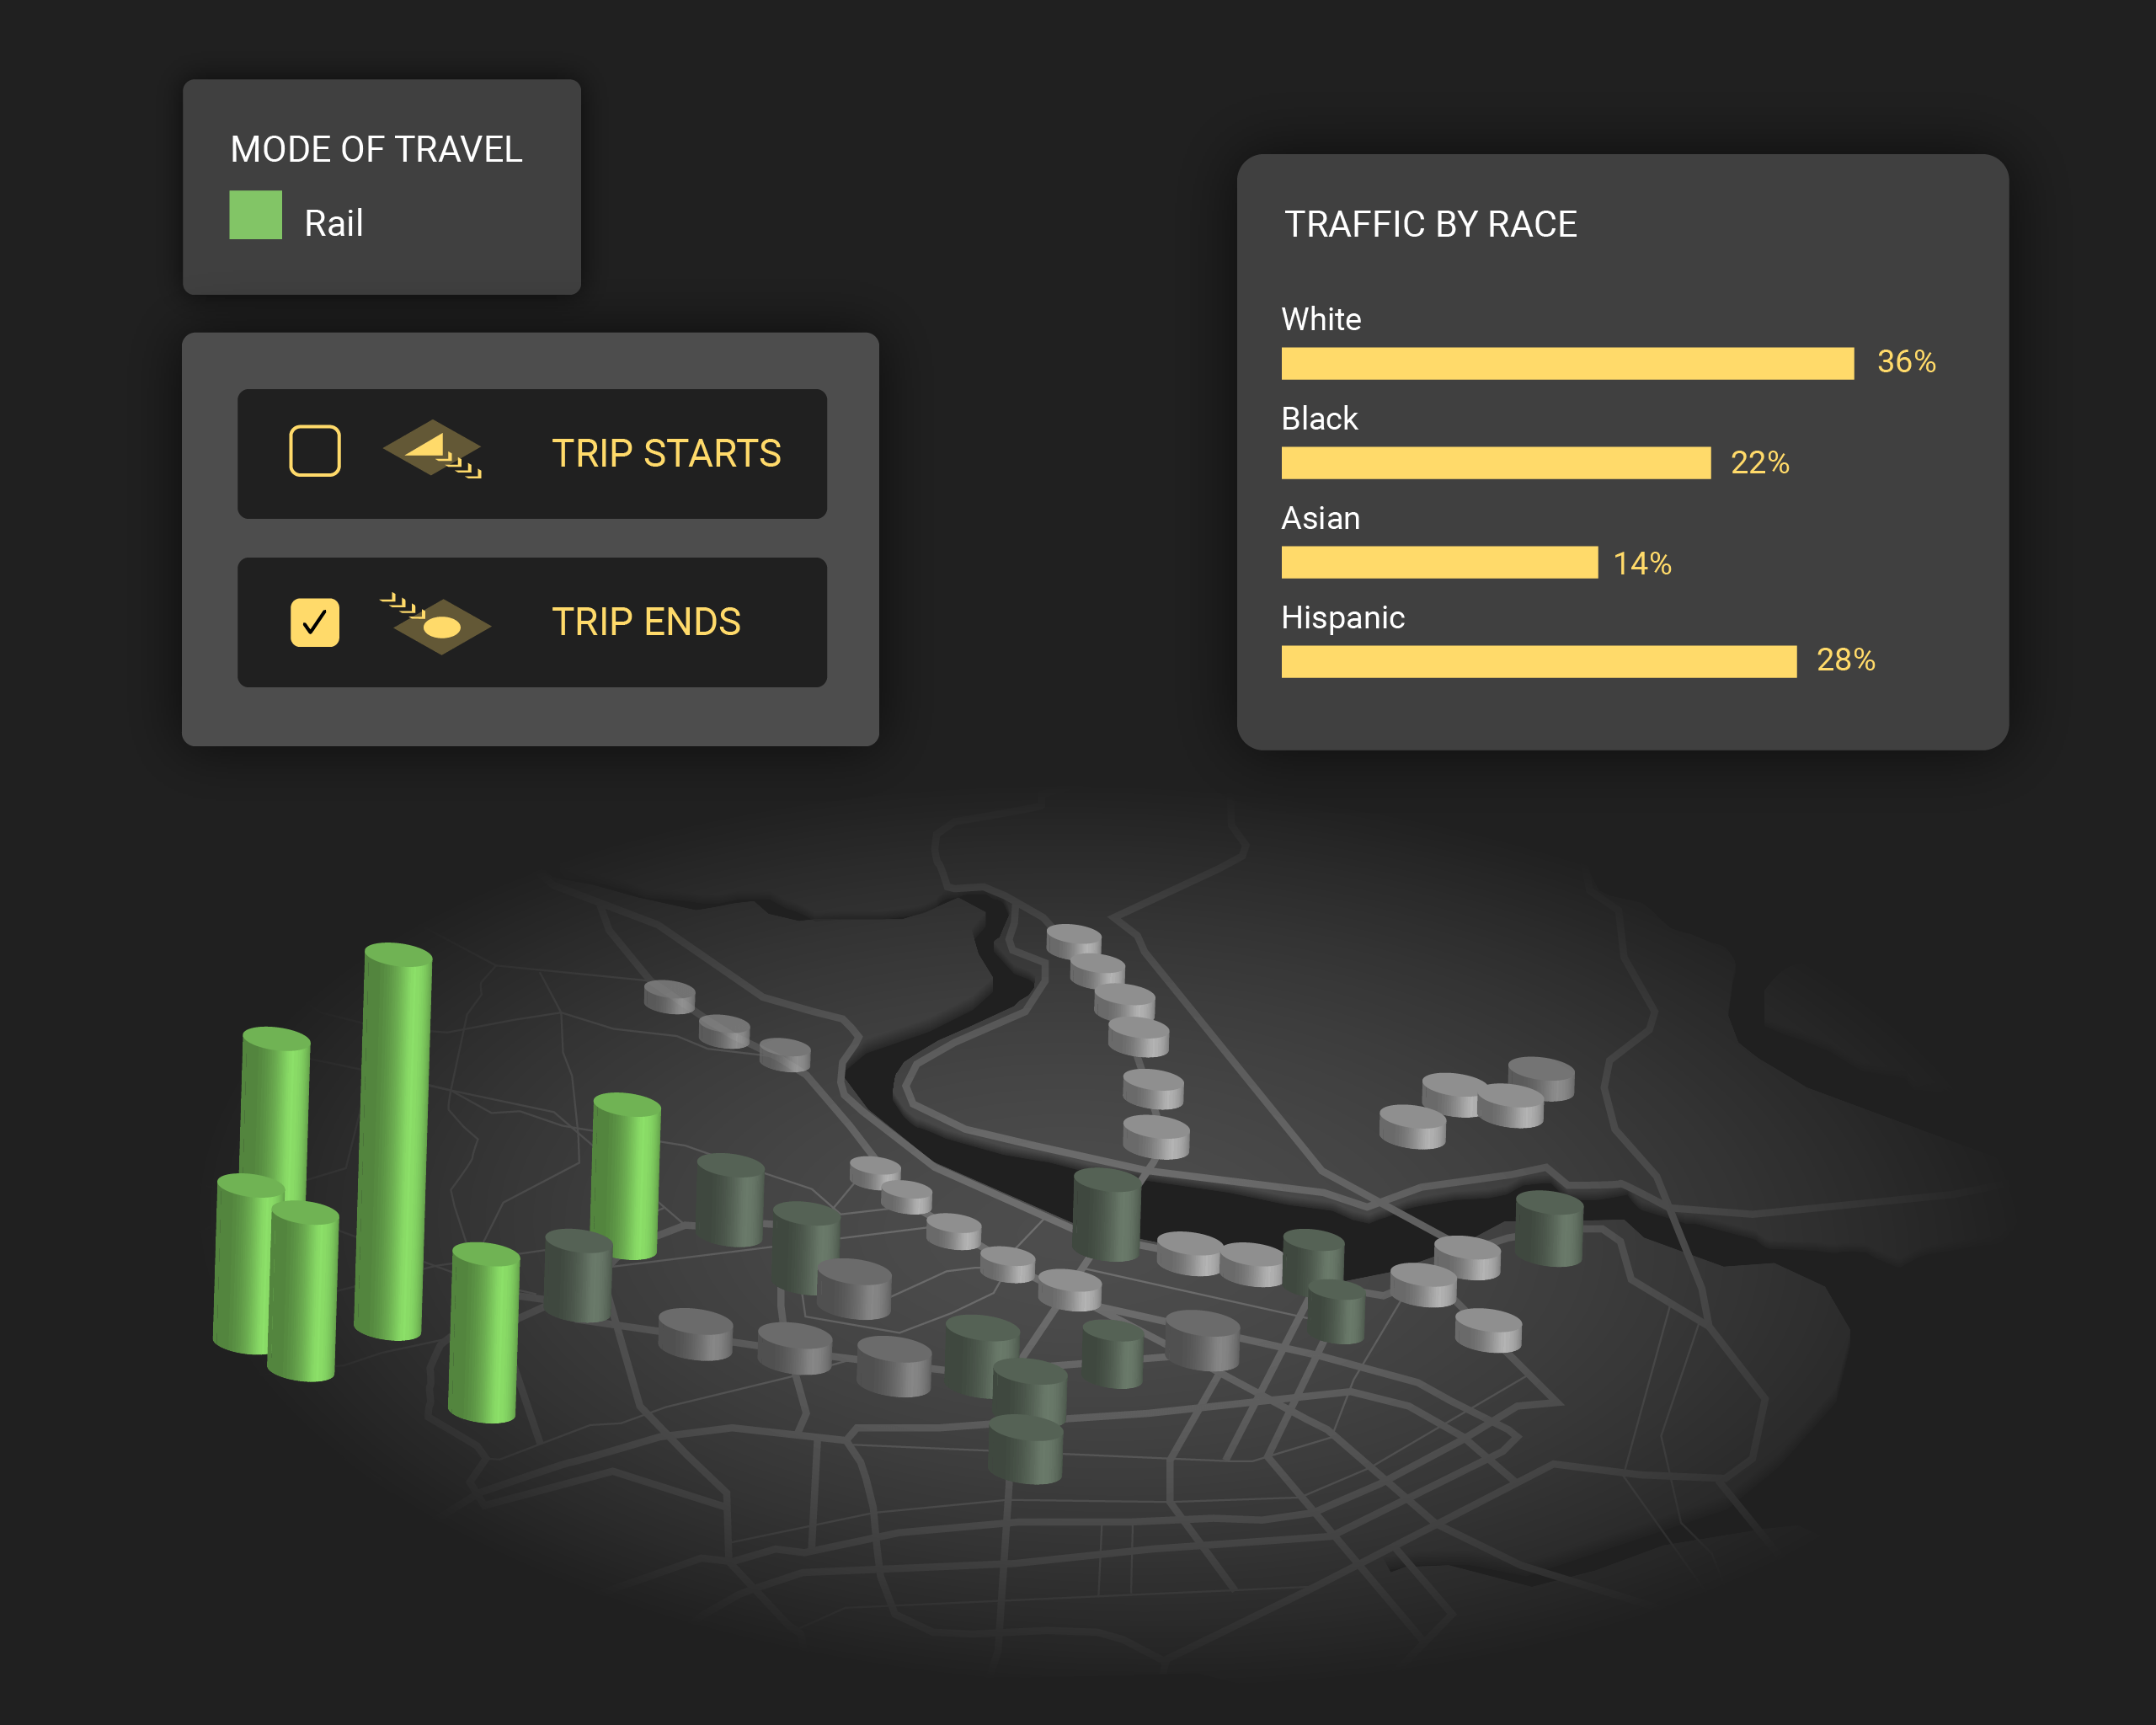
See where your riders travel the most, who they are, and how far they are going

Access millions of transit trips from 2019 and 2020
Glean powerful multimodal insights about travel patterns in the U.S. and Canada for transit planning

Aggregate demographics, including race and income
Characterize bus and rail travel patterns based on demographic Census data, to provide an equity lens
Empirical data to optimize transit data collection
Validate assumptions about travel behavior and measure passenger boarding-to-alighting activity
StreetLight’s Bus and Rail Metrics for measuring transit passenger travel patterns
TIME DISTRIBUTION
Peak hours easily available to analyze demand
TRIP ATTRIBUTES
Trip duration, trip length, and trip speed to understand quality of service
TRAVELER ATTRIBUTES
Race, income, education demographics to ensure access to equitable options
STATION, STOP, ROUTE, AND REGION DATA
Bus and Rail trip insights for the whole journey
Empirical Bus and Rail Data to help prioritize transit projects and advocate for transit improvements
- Identify most popular O-D pairs in the transit network
- Measure boarding and alighting activity at a bus stop or rail station for commute planning analyses
- Analyze bus and rail ridership across a network for corridor studies
- Understand aggregate ridership demographic data for social equity analyses
- Analyze ridership change by time of day, or day of week for service changes
Proven metrics, validated against real-world data
Review the data sources and methodology employed by StreetLight to develop our new Bus and Rail Metrics, along with validation against transit rider count data from multiple transit agencies compared to transit agency counts across the country.
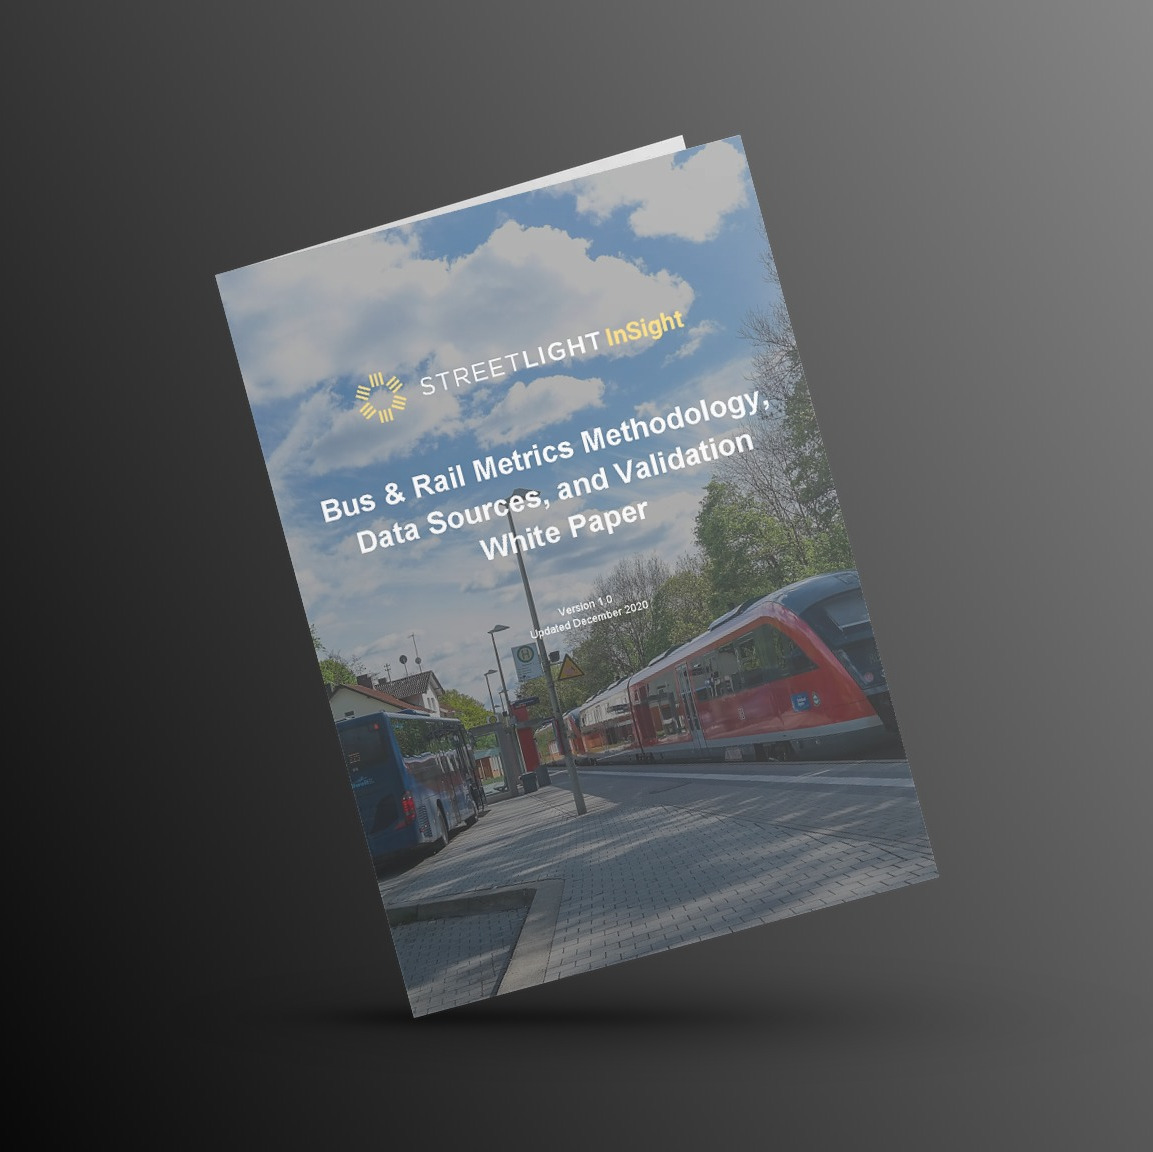
Proven metrics, validated against real-world data
Review the data sources and methodology employed by StreetLight to develop our new Bus and Rail Metrics, along with validation against transit rider count data from multiple transit agencies compared to transit agency counts across the country.
Measure COVID-19’s impact on transit with Big Data analytics
COVID-19 is impacting transit in unprecedented ways. Access 2020 Transit Metrics to understand ridership by route comparing before, during, and after COVID. Get insights on COVID’s impact on network O-D patterns, and identify where transit is most critical.
Get StartedAssess equity impact of bus routes and rail lines
In addition to demographics around transit stops, our Metrics let you analyze Census demographic data based on passengers’ aggregated home locations. Understand the social equity impact of various transit routes, and plan more effectively to mitigate impact on different populations.
Get StartedCOMPLETE STREETS
The Complete Guide to Complete Streets
Complete Streets policies help prioritize multimodal infrastructure like bus lanes and rail stations to make roadways safer and more accessible. See how digital traffic data can help implement them effectively.
READ IT NOWTalk to Us
Get on-demand bus and rail data to power your transit decisions.