
Beyond offering critical transportation analytics to planners and traffic engineers, StreetLight Data plays a key role in empowering the next generation of transportation leaders and researchers within academic settings, including at the University of California, Davis.
As part of the Travel Survey Design and Data Collection Methods course taught by Prof. Giovanni Circella at UC Davis, two particular transportation trends were measured by Daniel Rivera and Sarah Dennis utilizing the StreetLight InSight® platform: 1) the effects of COVID-19 on commuter traffic over the nearby I-80 Causeway, and 2) the changes to on-campus traffic behaviors in the summer academic quarter vs. the fall quarter.
With the help of StreetLight, these researchers were able to analyze sociodemographic characteristics of travelers, changes in trip speed and duration data, and changes in traffic volume by mode to gain a comprehensive understanding of the traffic patterns in and around campus. Here, we republish their findings.
Analysis 1: Pass-Through Zone
The I-80 Causeway has long served as a critical stretch of California’s highway infrastructure, linking the cities of West Sacramento and Davis over the Yolo Basin wetlands. Due to the natural (and often flooded) habitat that exists beneath the Causeway, the 3.2-mile stretch is the only direct connector of these cities, lacking any freeway ramps or exits to alternative highways.
Table 1: Sociodemographic characteristics of I-80 Causeway travelers in 2019 and 2020.
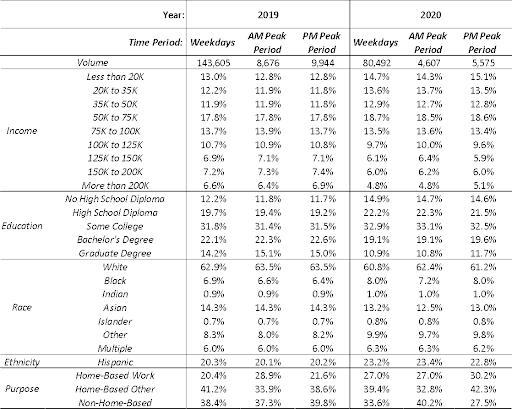
Daily commuters, including those traveling to and from the UC Davis campus, largely make up the weekday traffic that exists along the I-80 Causeway. When stay-at-home orders were enacted amid the COVID-19 pandemic, prompting a widespread transition from commuting to work-from-home policies, researchers were interested in measuring exactly how much traffic volumes shifted, which drivers were most impacted, and the characteristics of trips taken both before and during the pandemic.
Figure 1 Caption: Weekday traffic volume for 2019 (a) and 2020 (b).
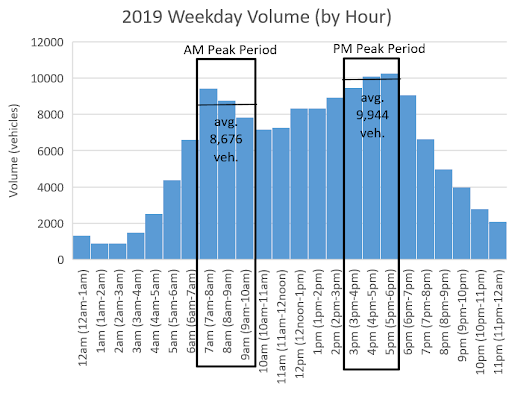
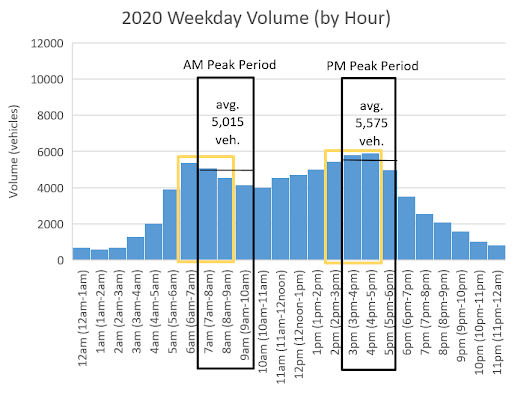
Using StreetLight’s Zone Activity analysis, researchers compared trips from a pre-COVID quarter (spring 2019) to those during a quarter amid the COVID pandemic (spring 2020). From this analysis, data found around the volume, speed, trip duration, and length of trips all suggest that the spring 2019 quarter saw notably more congestion than spring 2020. Researchers also found that 2020 saw a greater proportion of travelers with lower incomes, less education, and from minority races and ethnicities. Finally, the proportion of travelers in this segment on a home-based work trip was higher in 2020 than in 2019.
Figure 2 Caption:. Weekday traffic speed for 2019 (a) and 2020 (b).
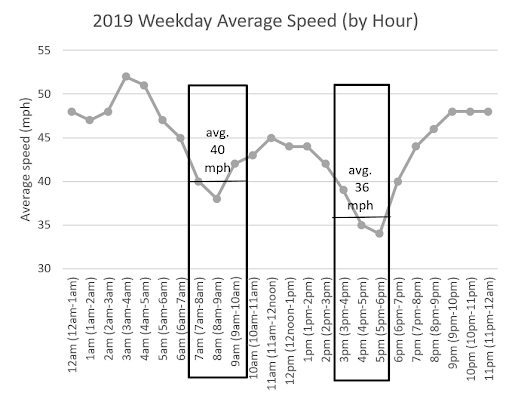
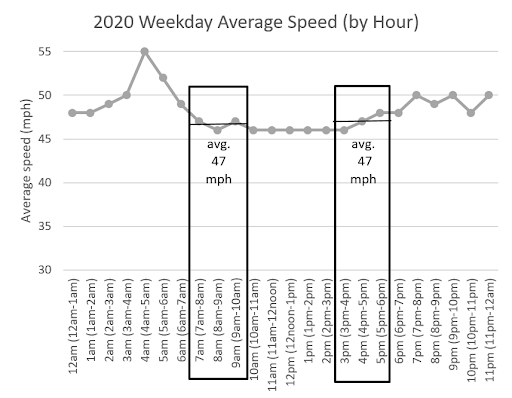
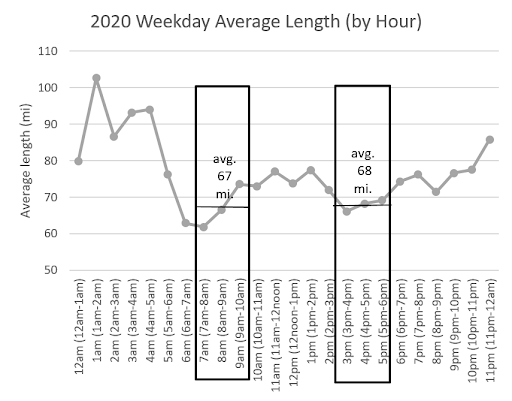
Most of the results, including increased peak-hour speeds and shorter travel times, were as expected, though StreetLight helped uncover the surprising conclusion that average trip length actually increased during COVID-19, despite drops in traffic congestion.
Analysis 2: Destination Zone
For the second part of this study, researchers analyzed traffic conditions on the UC Davis campus during high traffic periods (fall 2019) and lower traffic periods (summer 2019) to understand how traffic demands change during the academic year. Notably, a large portion of campus visitors travel by bike, so researchers compared bicycle traffic to car traffic.
The analysis found mostly predictable results — for example, the largest average daily volume (ADV) for bikes and cars occurred on weekdays midday–and the overall ADV of bikes and cars was higher in the fall than the summer due to a larger share of workers and students on campus. The average trip lengths (ATL) of bike trips in the summer and in the fall were found to be nearly the same, while the ATL of car trips was higher in the summer than the fall, and generally higher for visitors than residents and workers.
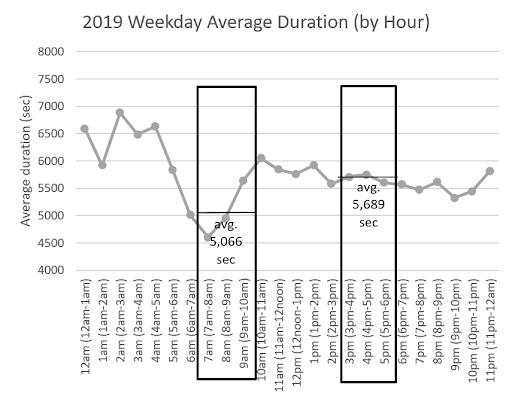
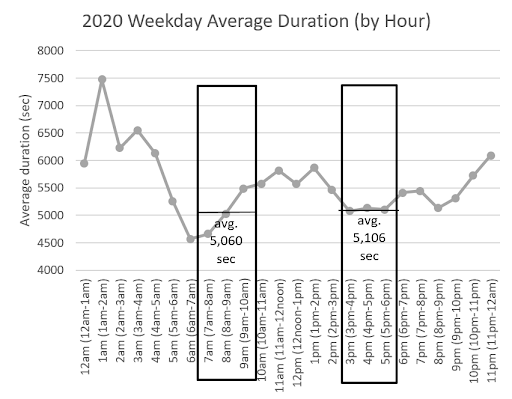
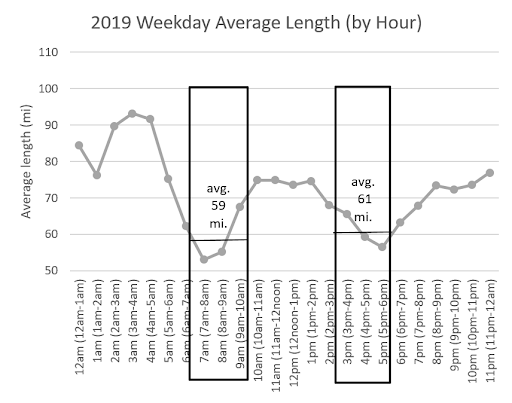
Figure 3 Caption: Weekday average trip duration for 2019 (a) and 2020 (b) and trip length for 2019 (c) and 2020 (d).
Interestingly, StreetLight Metrics also helped to uncover that the larger share of trips to the UC Davis campus originate in Davis, despite the high costs of living in the area relative to surrounding towns and cities. The rest of the trips come from the cities of Sacramento, Winters, Dixon, and Woodland.
Conclusion
The findings collected in this UC Davis transportation survey course offered both a snapshot of important campus traffic trends and a valuable training in the use of Big Data within academic research. Oftentimes, college campuses can be leveraged as small-scale “testbeds” for research that can later be applied to larger cities and regions, making them a prime environment to explore tools like the StreetLight InSight® platform.
StreetLight is proud to offer numerous resources that support academic research in the areas of transportation planning, COVID impacts, climate change, health, and more. By introducing future transportation experts to the many applications of big data, we can strengthen the foundation of our work as a sector and continue driving meaningful change on our streets.