
A major strength of Massive Mobile Data Analytics is that it’s, well, massive, and we can easily “scan” across large geographies to identify specific patterns of actual travel behavior. To leverage this, we ran a sample analysis by scanning every kilometer in California for truck stops for a given year, and found some fascinating patterns about the movement of these big (and medium) rigs throughout the state.
This simple truck analysis is a great example of a high level exploration that will identify “hot spots” of high or unusual activity, which can then be the focus for drilling down with more granular analyses. Modelers can use this type of analysis to help identify and define key origin and destination areas, as well as top routes.

To calculate this metric, we first chopped up California in a grid of 1km x 1km blocks. Next, we analyzed the relative volume of trucks stopping, or ending a trip, in each 1km grid cell. We split out the results by weight class – Medium Duty (between 14,000 and 26,000 lbs) and Heavy Duty (over 26,000 lbs). Powering this analysis was over 10 million truck trips spanning all of 2015. The trips were derived from GPS data from commercial fleet management systems that we license from our partner INRIX. Figure 1 below is a dot map representing the truck trip ends points throughout the state.
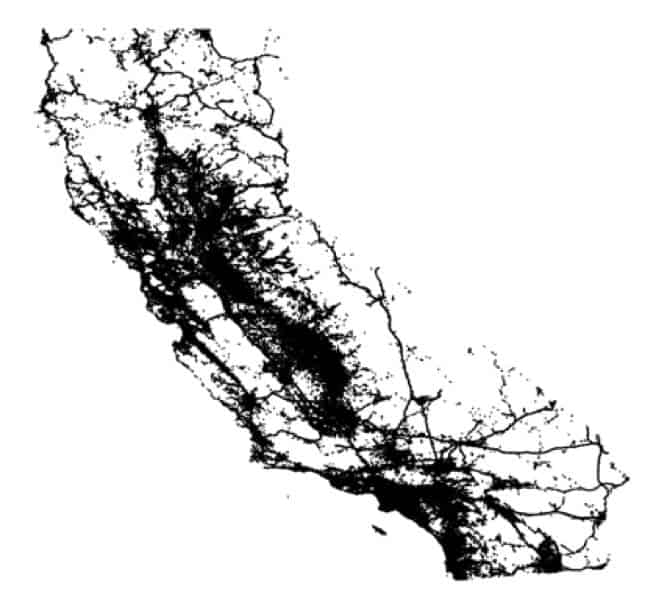
Figure 1: Dot map of truck end points within California.
The two heat maps below visualize the Truck Stop Index values for the grids across the state. Red indicates highest values, then orange, yellow and green. We eliminated grid cells with the lowest values to help simplify the visualizations. Heavy Duty trucks, unsurprisingly, tend to stop for rest, refueling, and work near to major highways and ports. Medium Duty trucks, which often are used for activities such as parcel delivery, maintenance, etc., collect in urban areas.
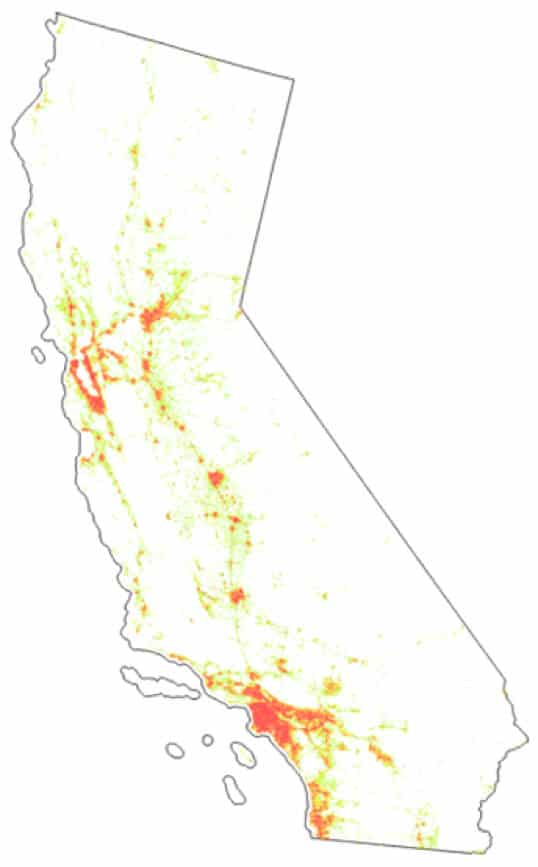
Figure 2: Medium duty truck heat map.
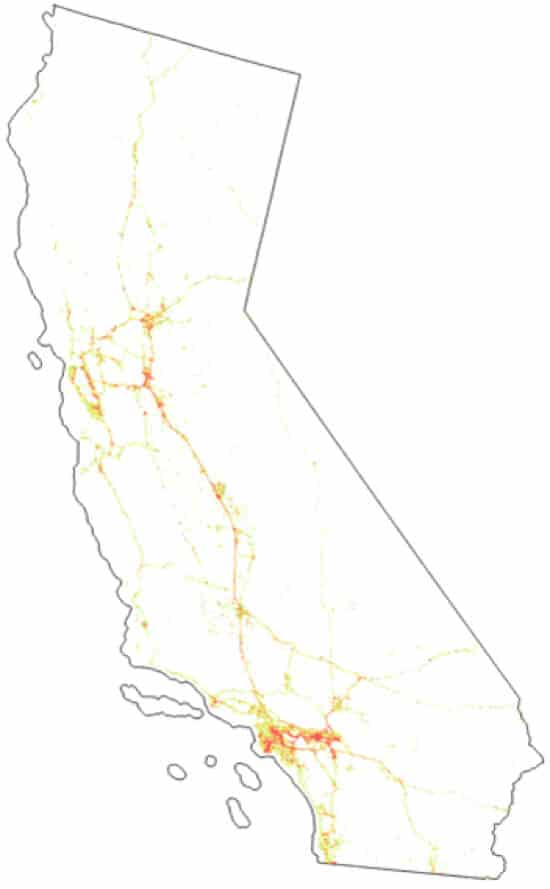
Figure 3: Heavy duty truck heat map.
We then drilled down further into some of the hot spots. Starting in an area we know well, we reviewed Heavy Duty stops in the East Bay to see if they matched our local knowledge. All but one were obvious industrial/heavy commercial areas. But not the one seemingly random spot indicated in Figure 4 below.
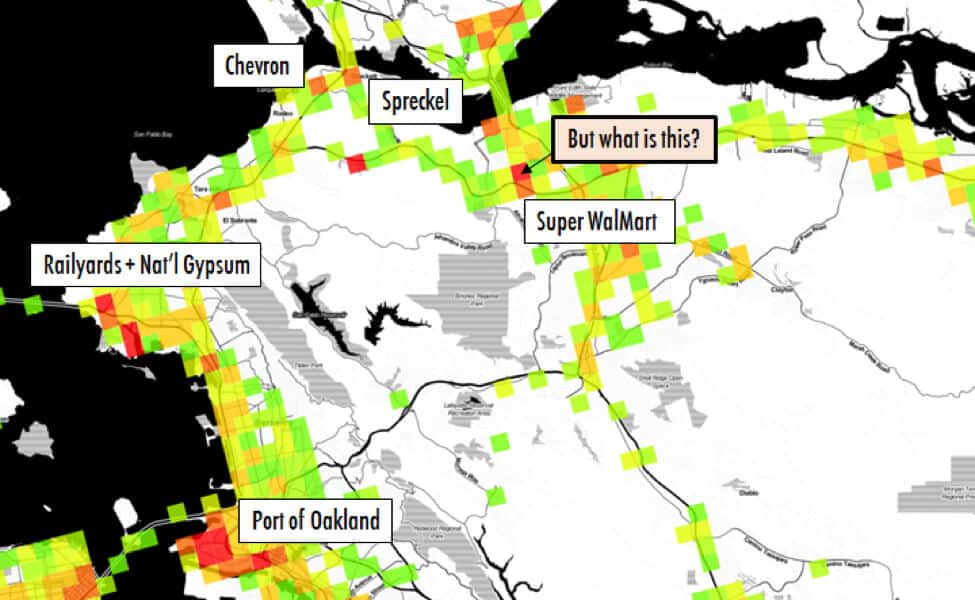
Figure 4: Heavy duty truck stops in the East Bay region.
Google Maps to the rescue. We first identified the area as a commercial portion of a neighborhood with big box retail and another nearby property that clearly contained parking lots housing trucks. Google Street View clarified that this was a KAG West Tanker facility, hence the big lot and numerous trucks.
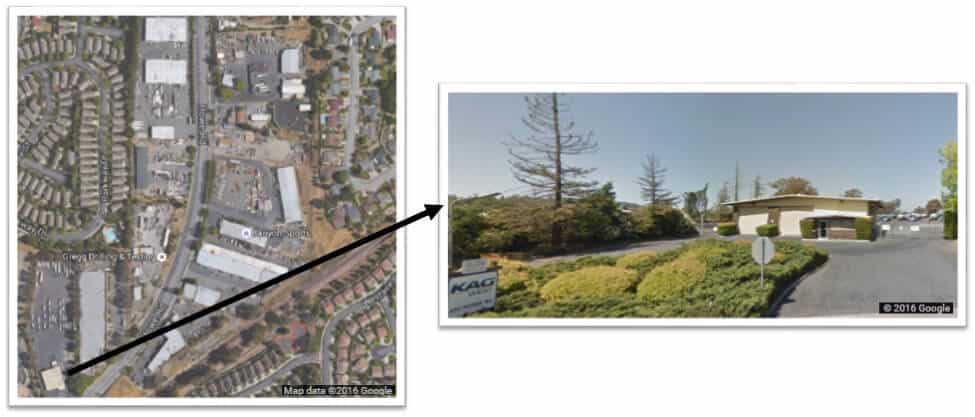
Figure 5: Deep dive into one East Bay neighborhood.
Next, we looked for an area at the other extreme and landed in Quartz, California. In this rural, desert community in Southern California, two grid cells adjacent to each other popped up as red for Heavy Duty vehicles, meaning that a lot of trucks are stopping here. Our initial thought was — is that correct? But, as shown in Figure 6 below, a review of the area confirmed there are two big warehouse/distribution facilities on that block. This does make sense, given Quart’s proximity to the Greater LA market and it’s position between Southern California and markets in the north of the state.
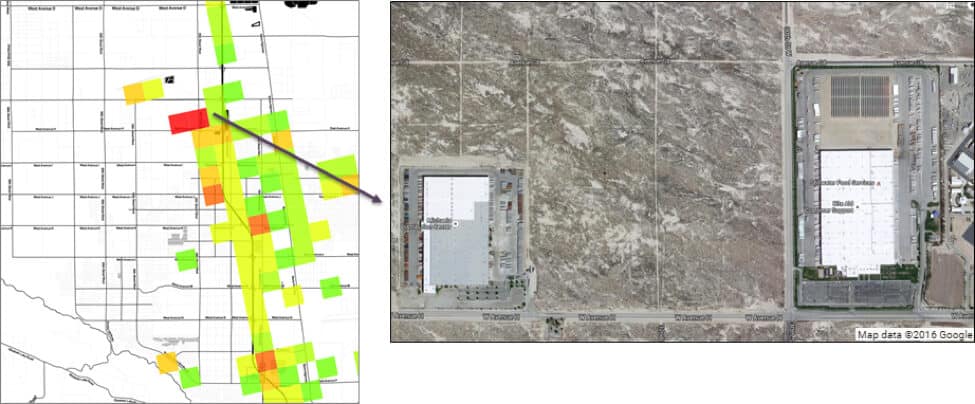
Figure 6: Deep dive into rural distribution centers.
In the end, we were able to create these metrics for truck travel throughout the entire state in a few hours, and have only begun to scratch the surface on where else to drill down for further insights. We’d love to hear if you there are any regions you’d like to explore.