
When our partner Boston Consulting Group used StreetLight’s VMT metrics to create a Trip Reduction Index, we were impressed by the methodology and the results. From calculating COVID’s impact on tax revenue to understanding how household income correlates with sheltering in place, the examples illustrate how transportation insights can be used to study the pandemic’s impact on residents, businesses, and budgets.
Just Where Are People Traveling Less?
BCG and StreetLight have studied vehicle miles traveled (VMT) statistics from the beginning of March, as the COVID-19 pandemic took hold, and created a “Trip Reduction Index” that was used to measure adherence to stay-at-home policies in each state, county, and MSA. A few key insights stand out.
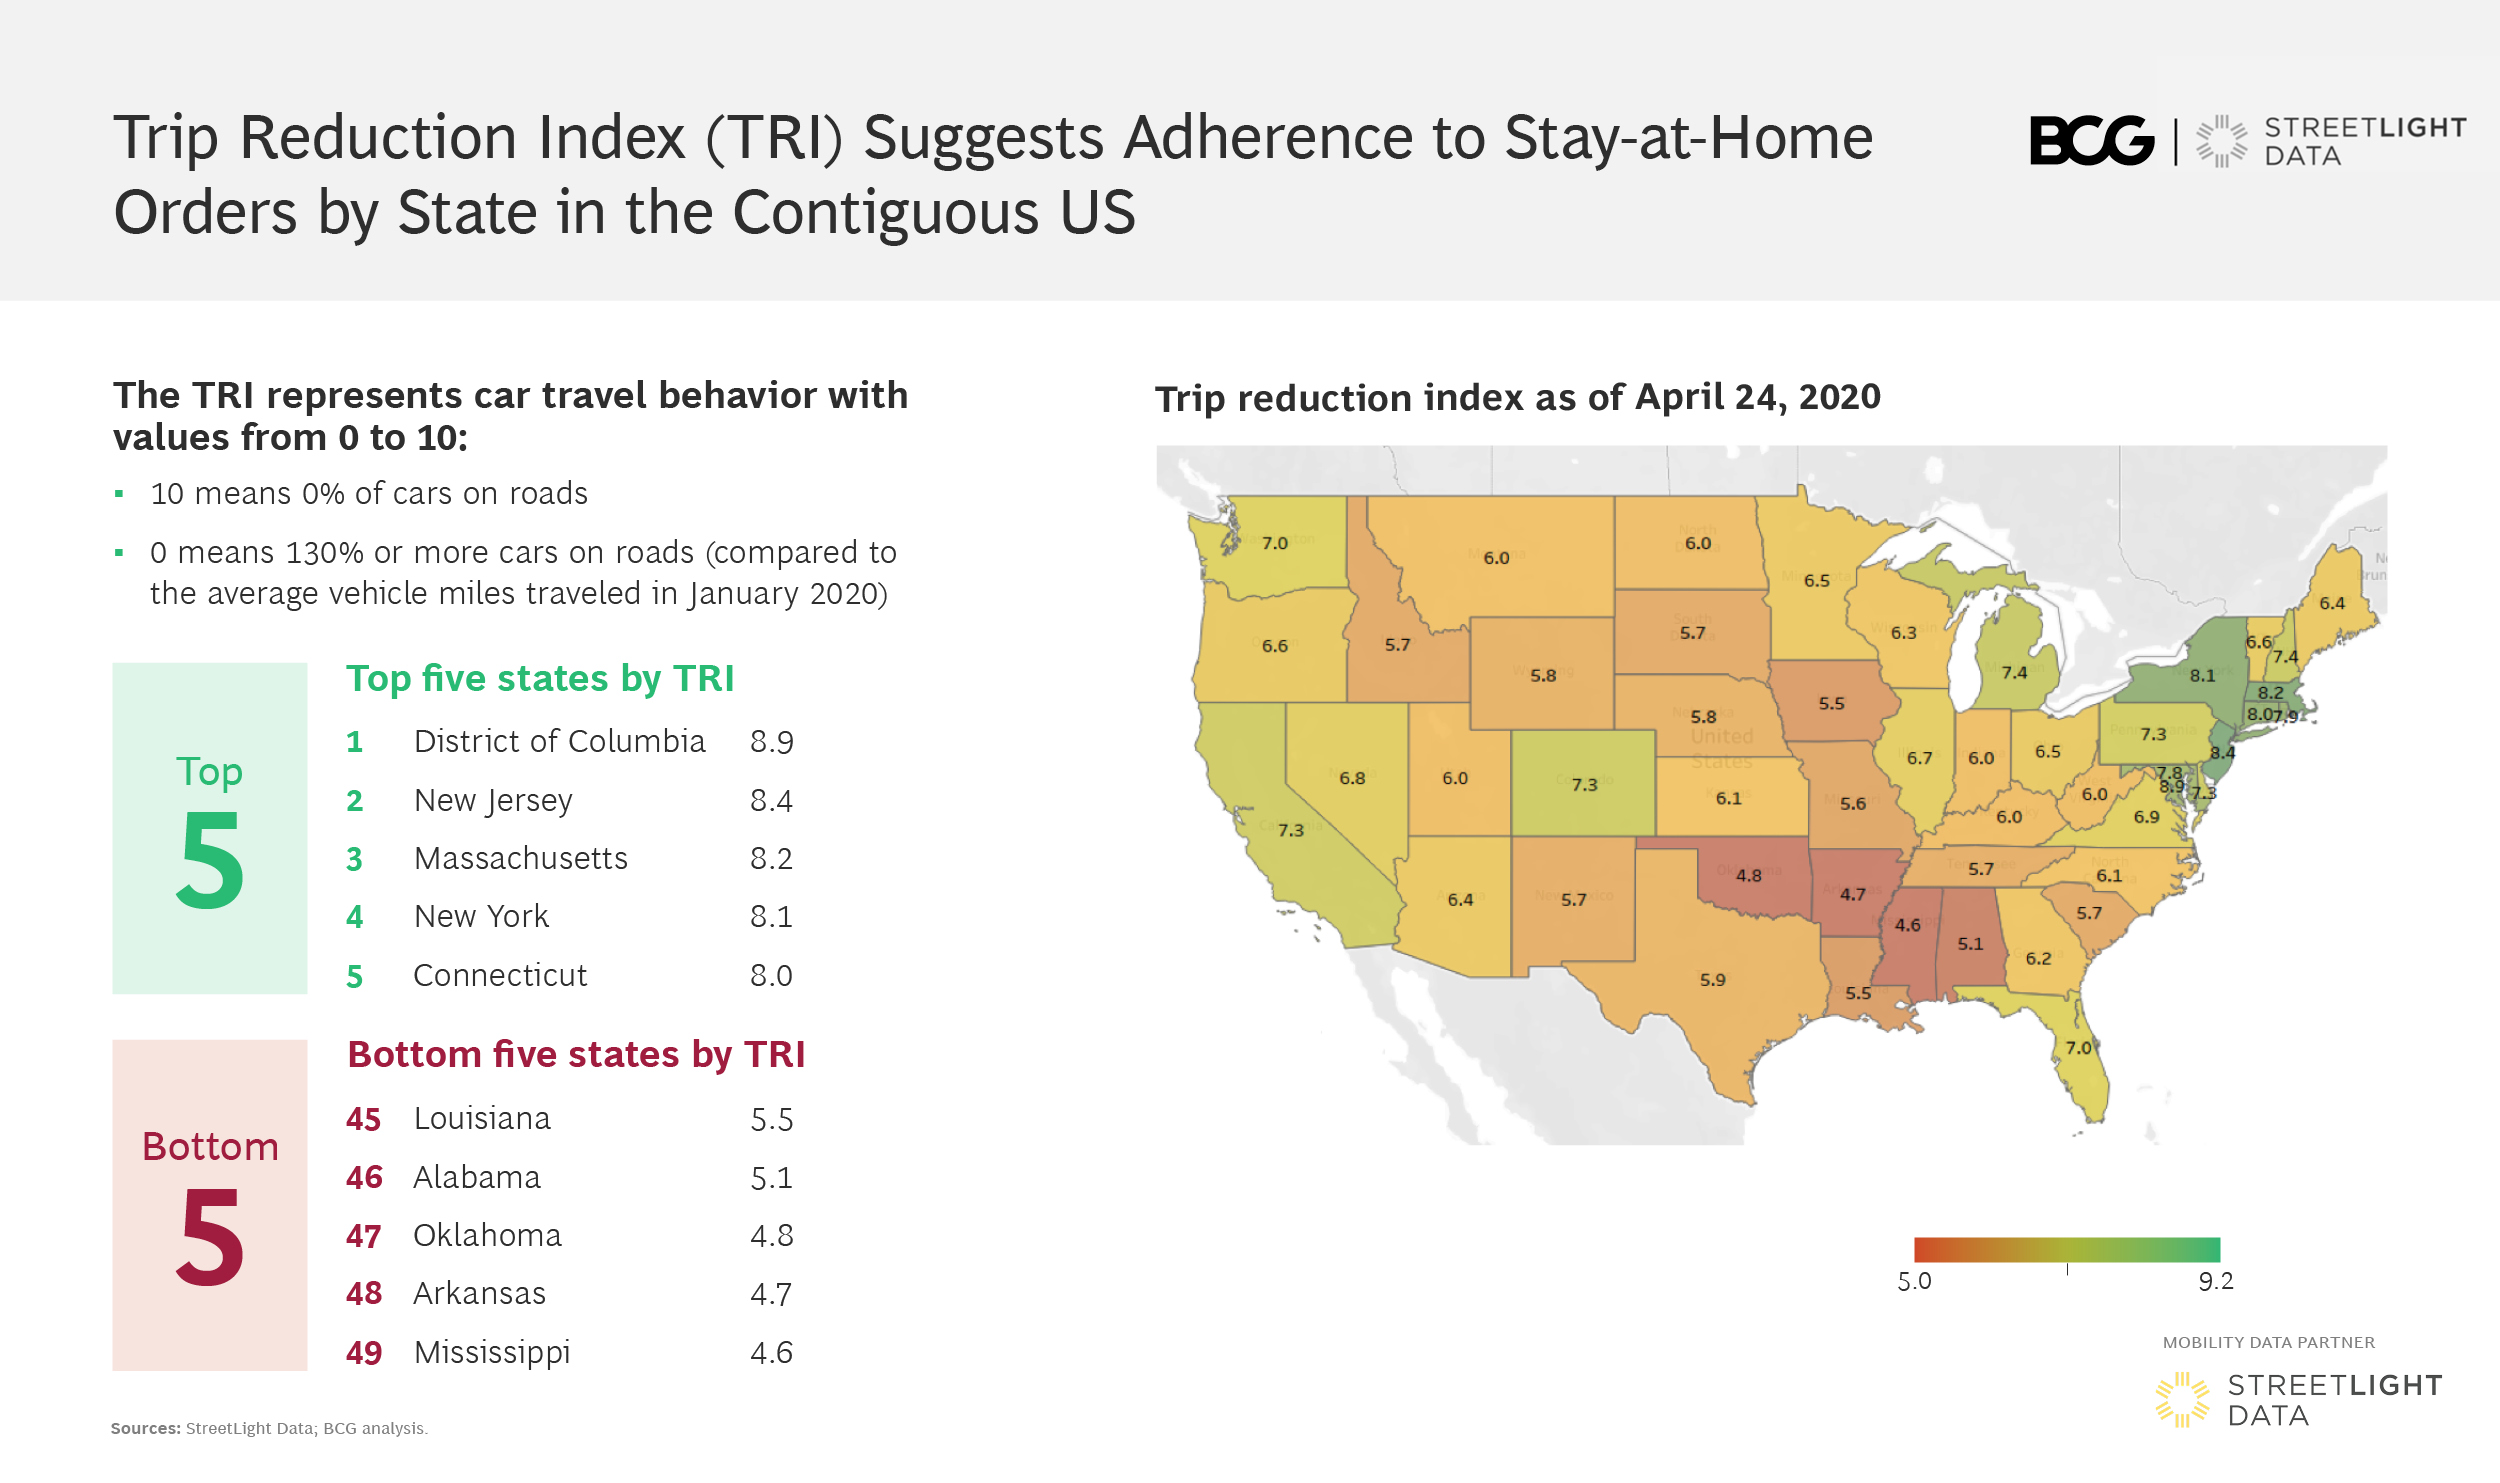
First, we analyzed the U.S. overall to see trends state by state. As shown in the figure above, COVID-19 hotspots like the NY-NJ-CT “tri-state” area, Detroit, Chicago, and California have seen the highest level of trip reductions since March.
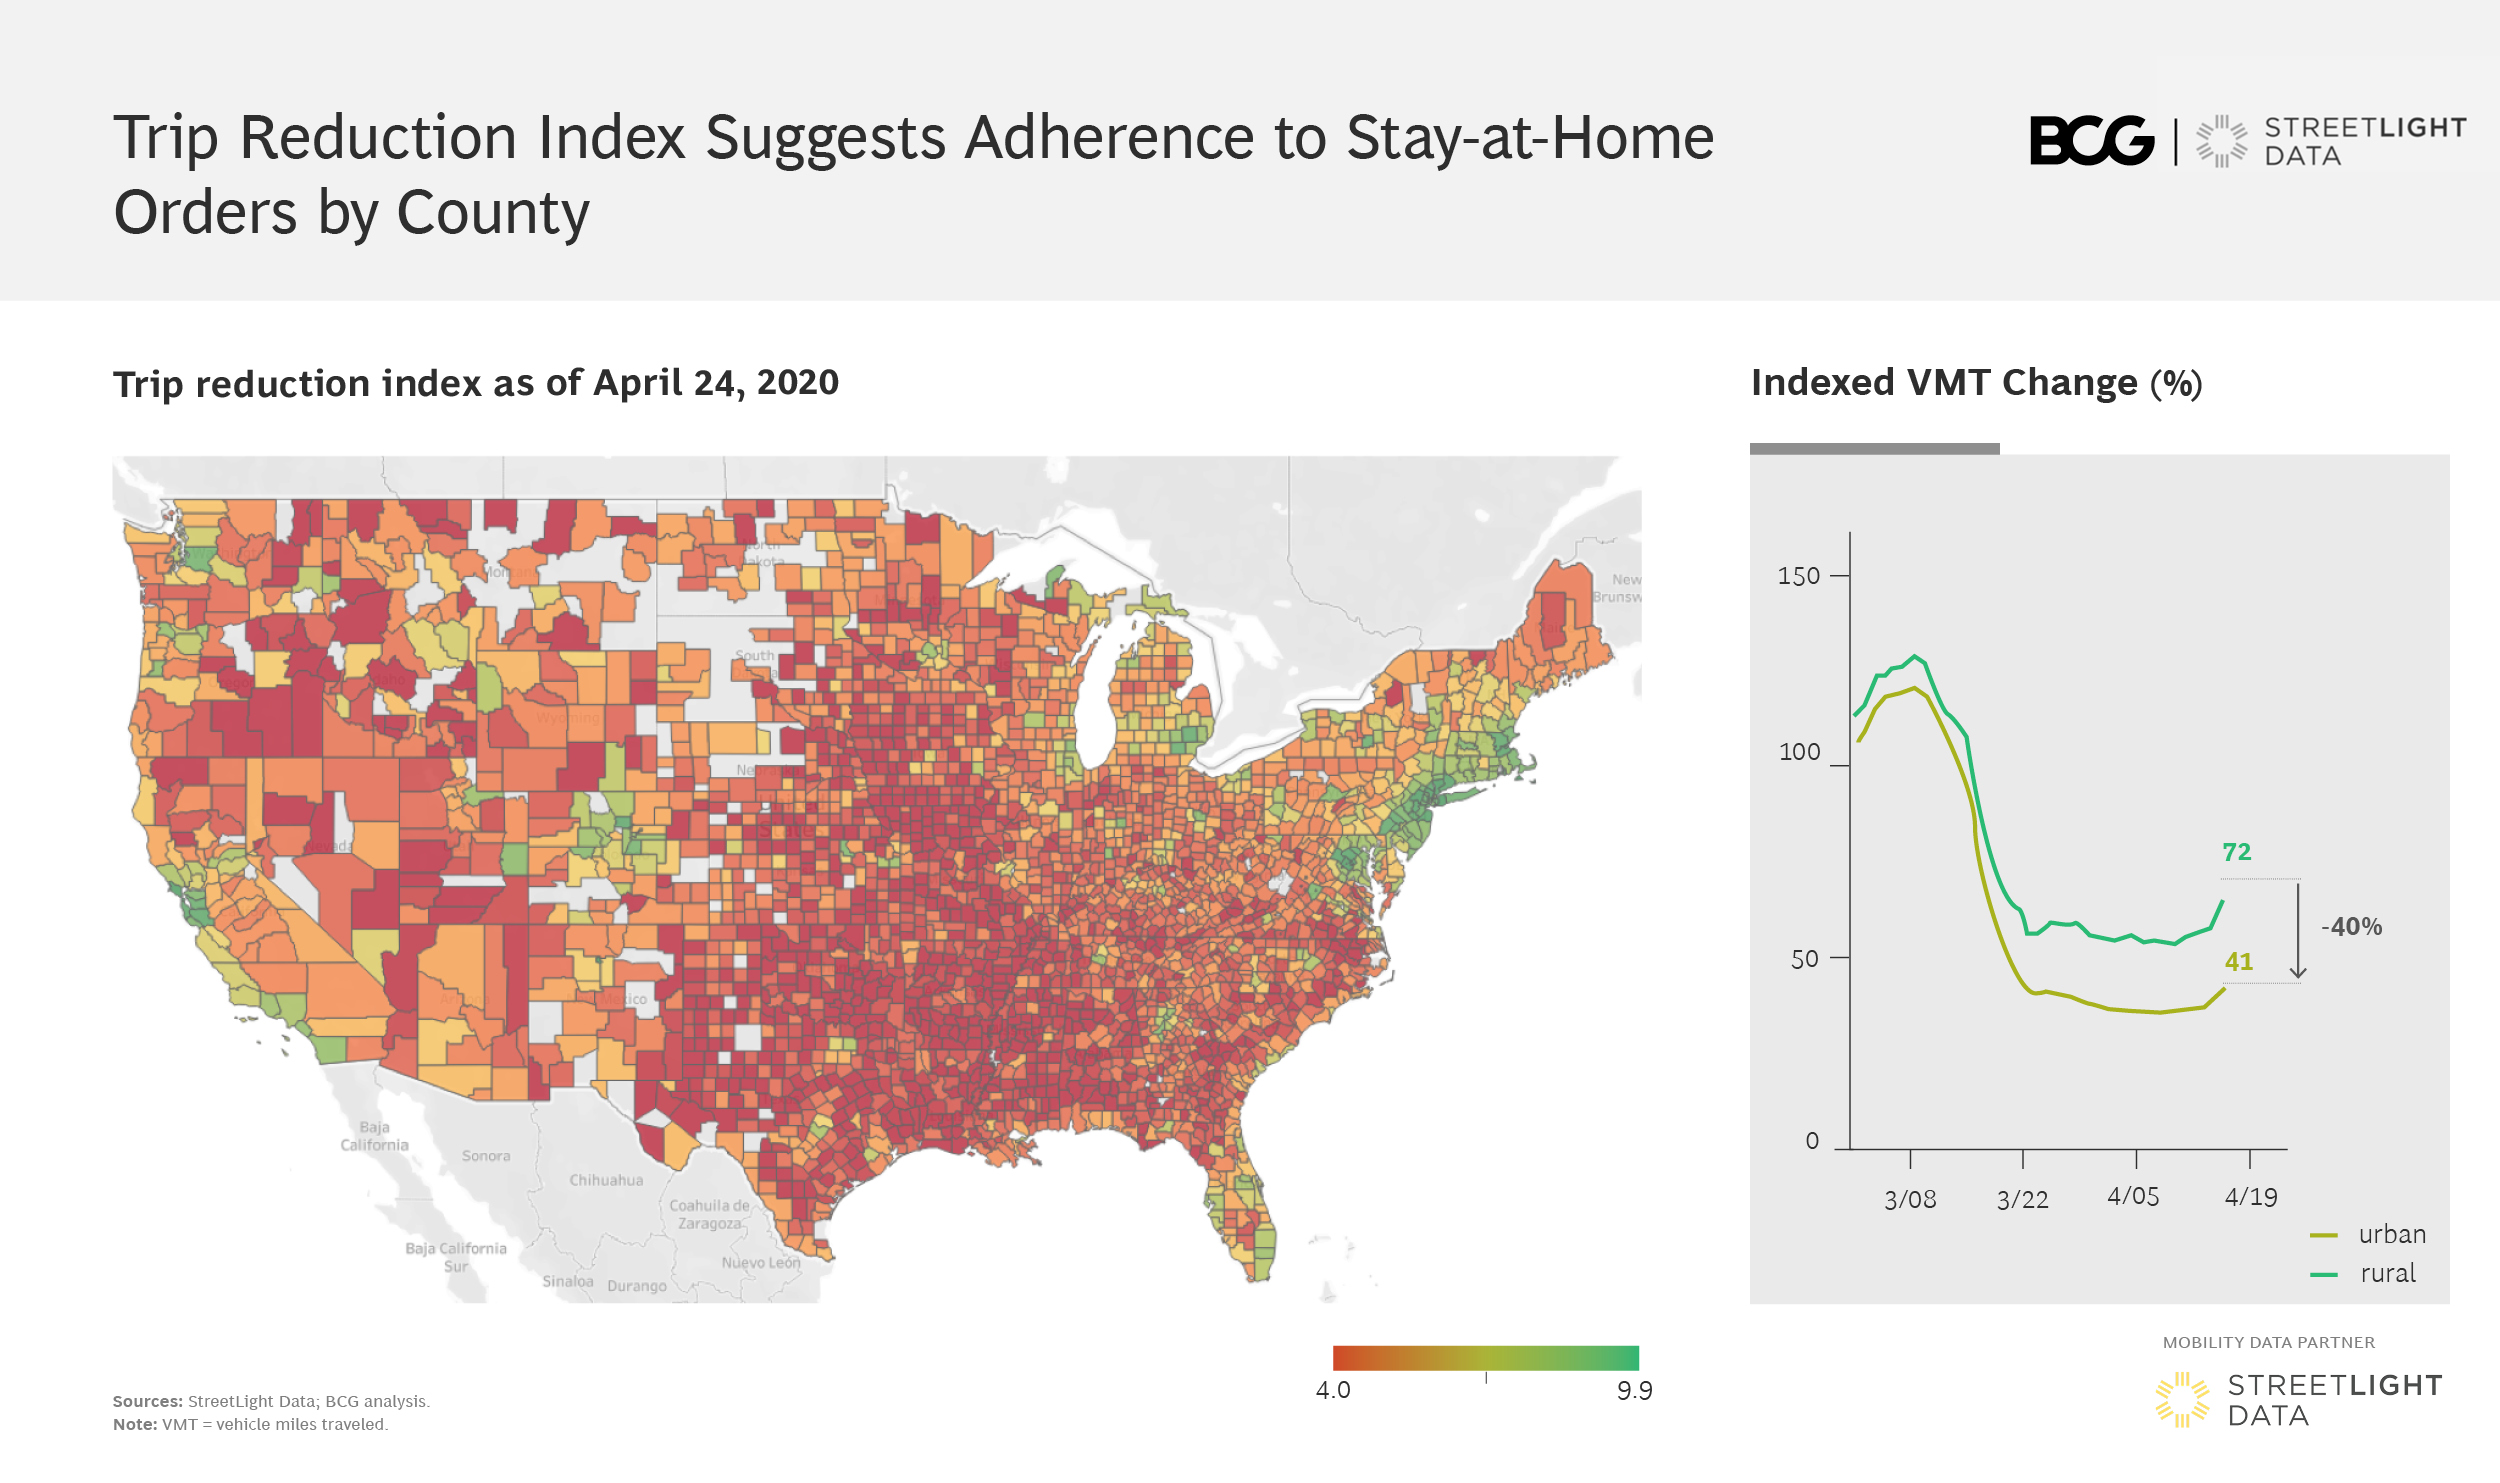
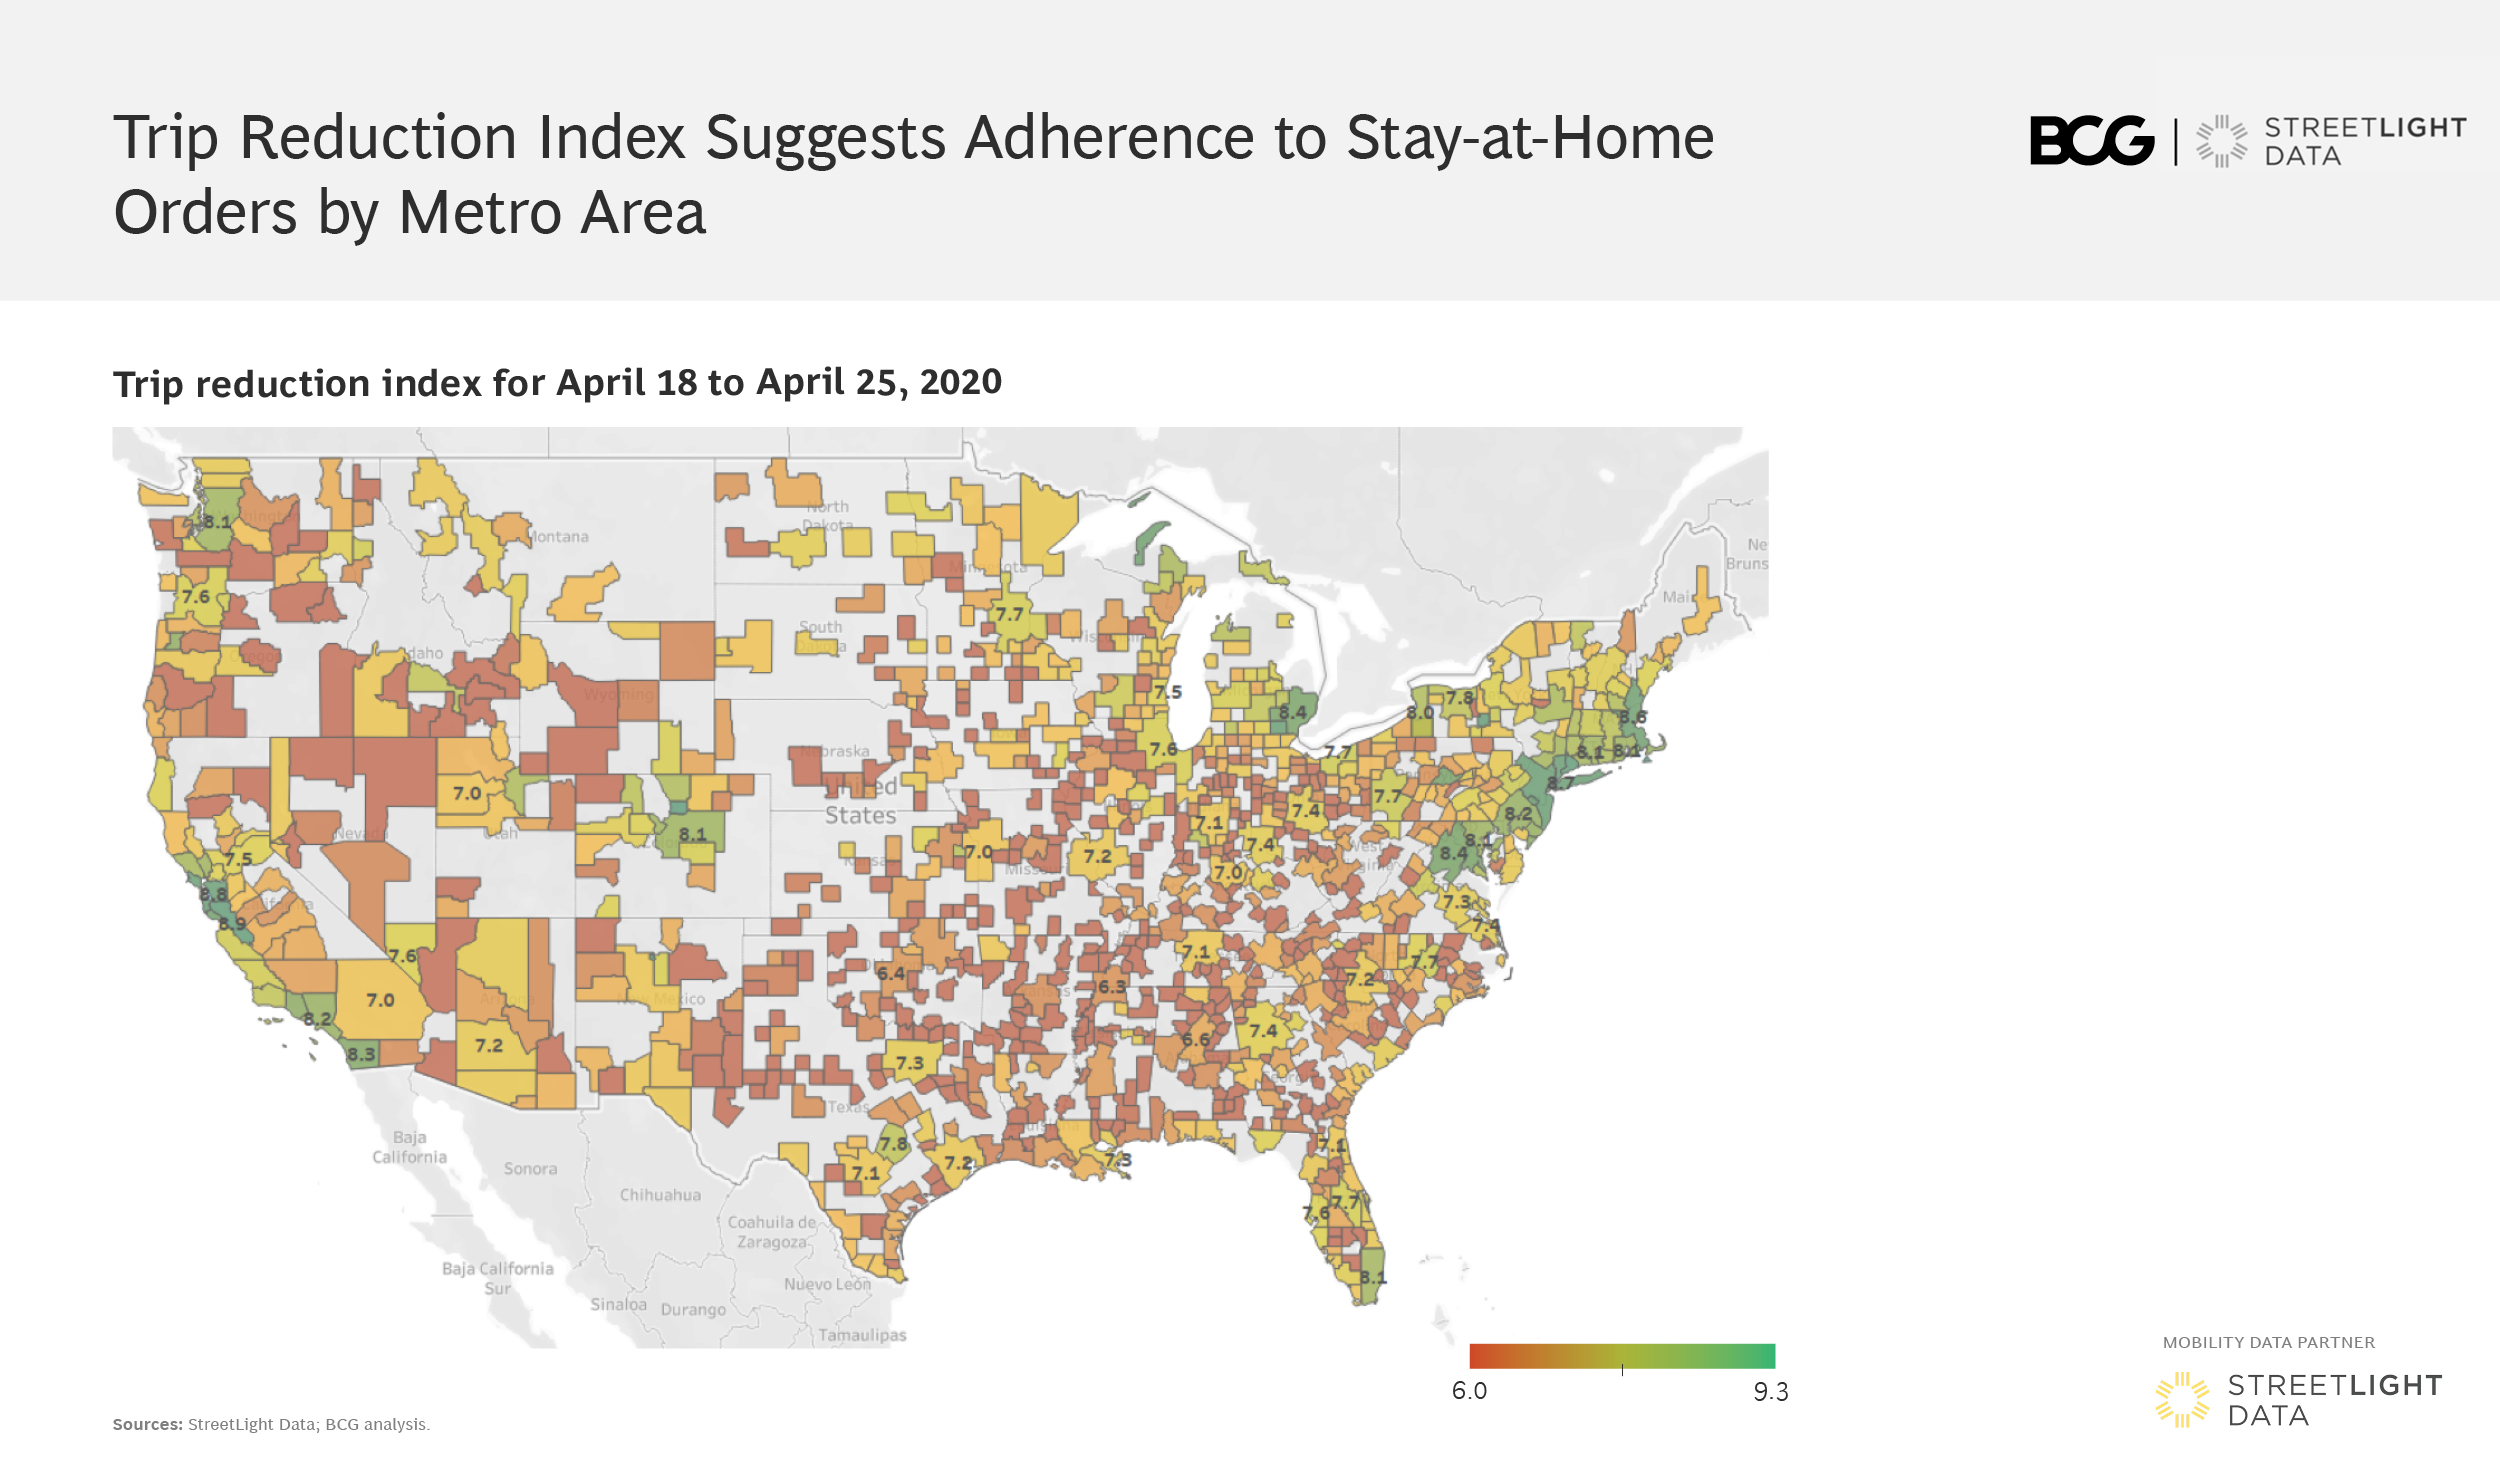
We then dug down to the county and metro-area level for a more localized analysis of VMT statistics. We found that population density is a key factor in adherence to stay-at-home orders. Urban counties saw on average a reduction in VMT by about 40% more than rural counties.
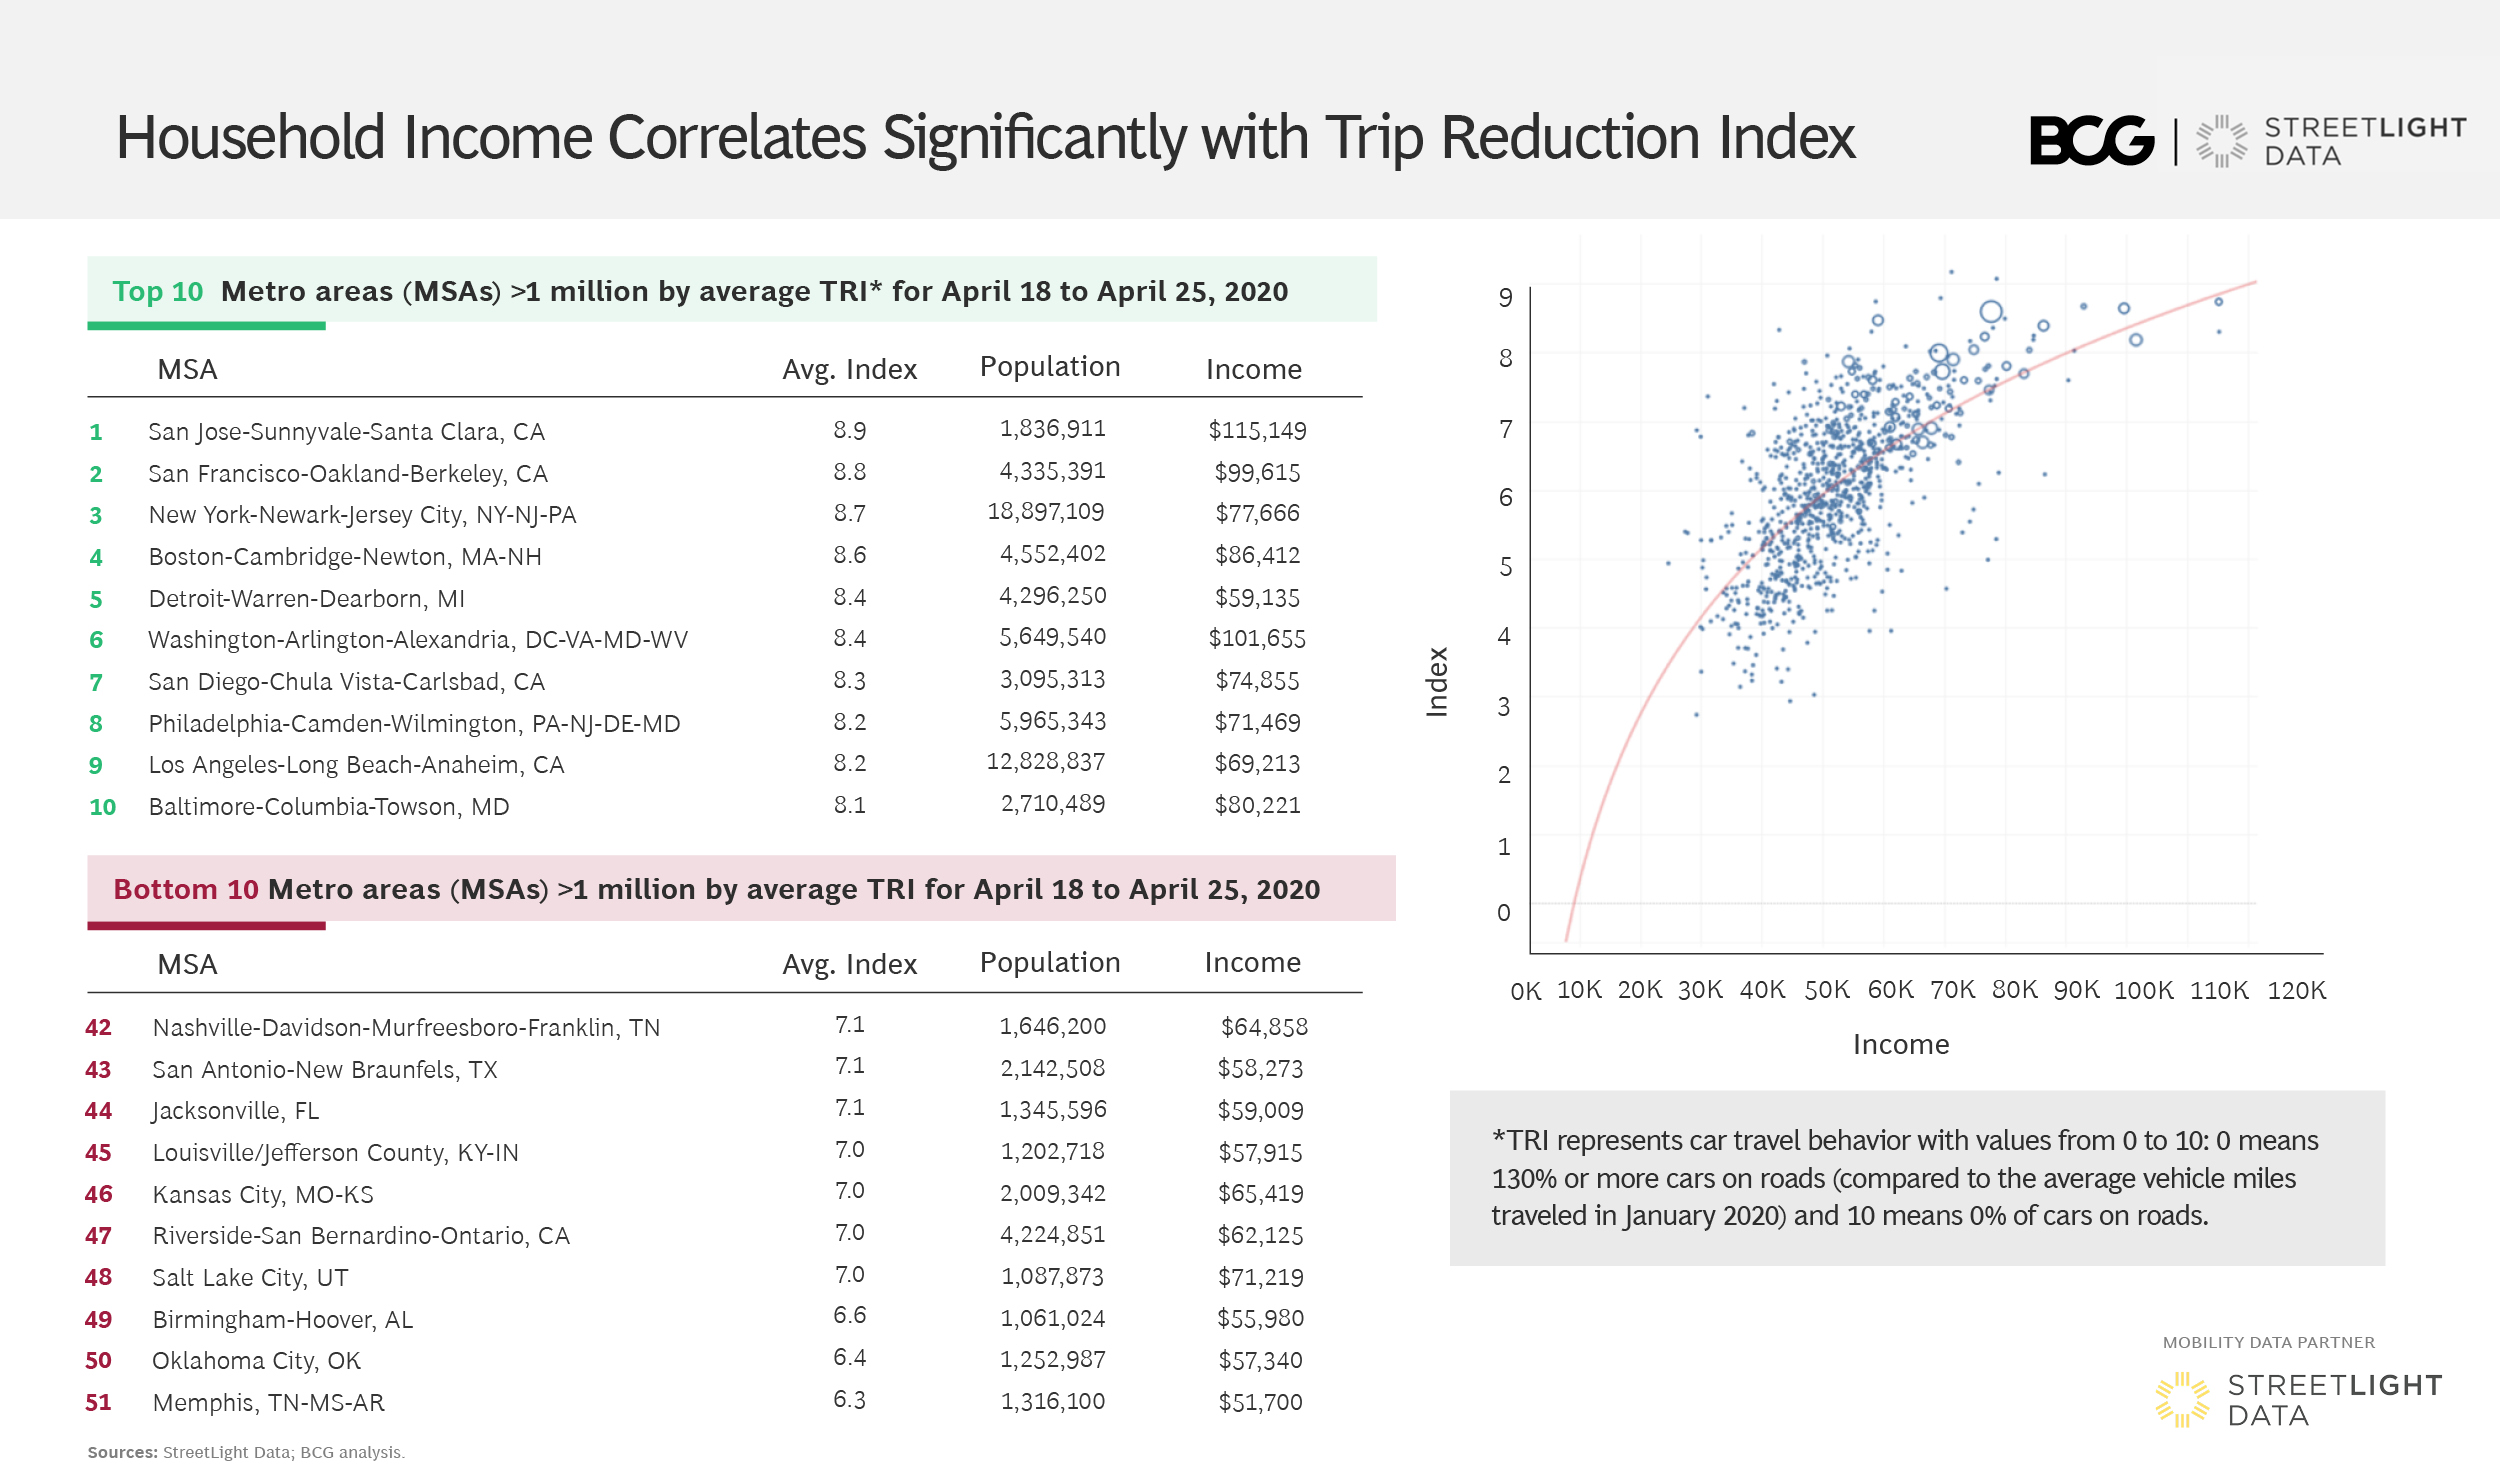
Using additional metrics from StreetLight InSight® we overlaid demographic data for an interesting finding. One of the key correlating factors for trip reductions turns out to be household income. This possibly results from the ability that higher-wage workers have to work from home, compared with those in positions requiring them to be at a physical location.
Impact on Freight and Commercial Travel
BCG and StreetLight studied VMT statistics from the perspective of commercial activity by studying trip volume at warehouses across the U.S. in March, as the COVID-19 pandemic took hold. We saw an initial surge in trip volume by approximately 10% across the top three players (the U.S. Postal Service, UPS and Fedex), driven by an uptick in online ordering at the beginning of lockdown measures. But over the long term, two of these top U.S. logistics players have experienced a 30% decline in trip volume.
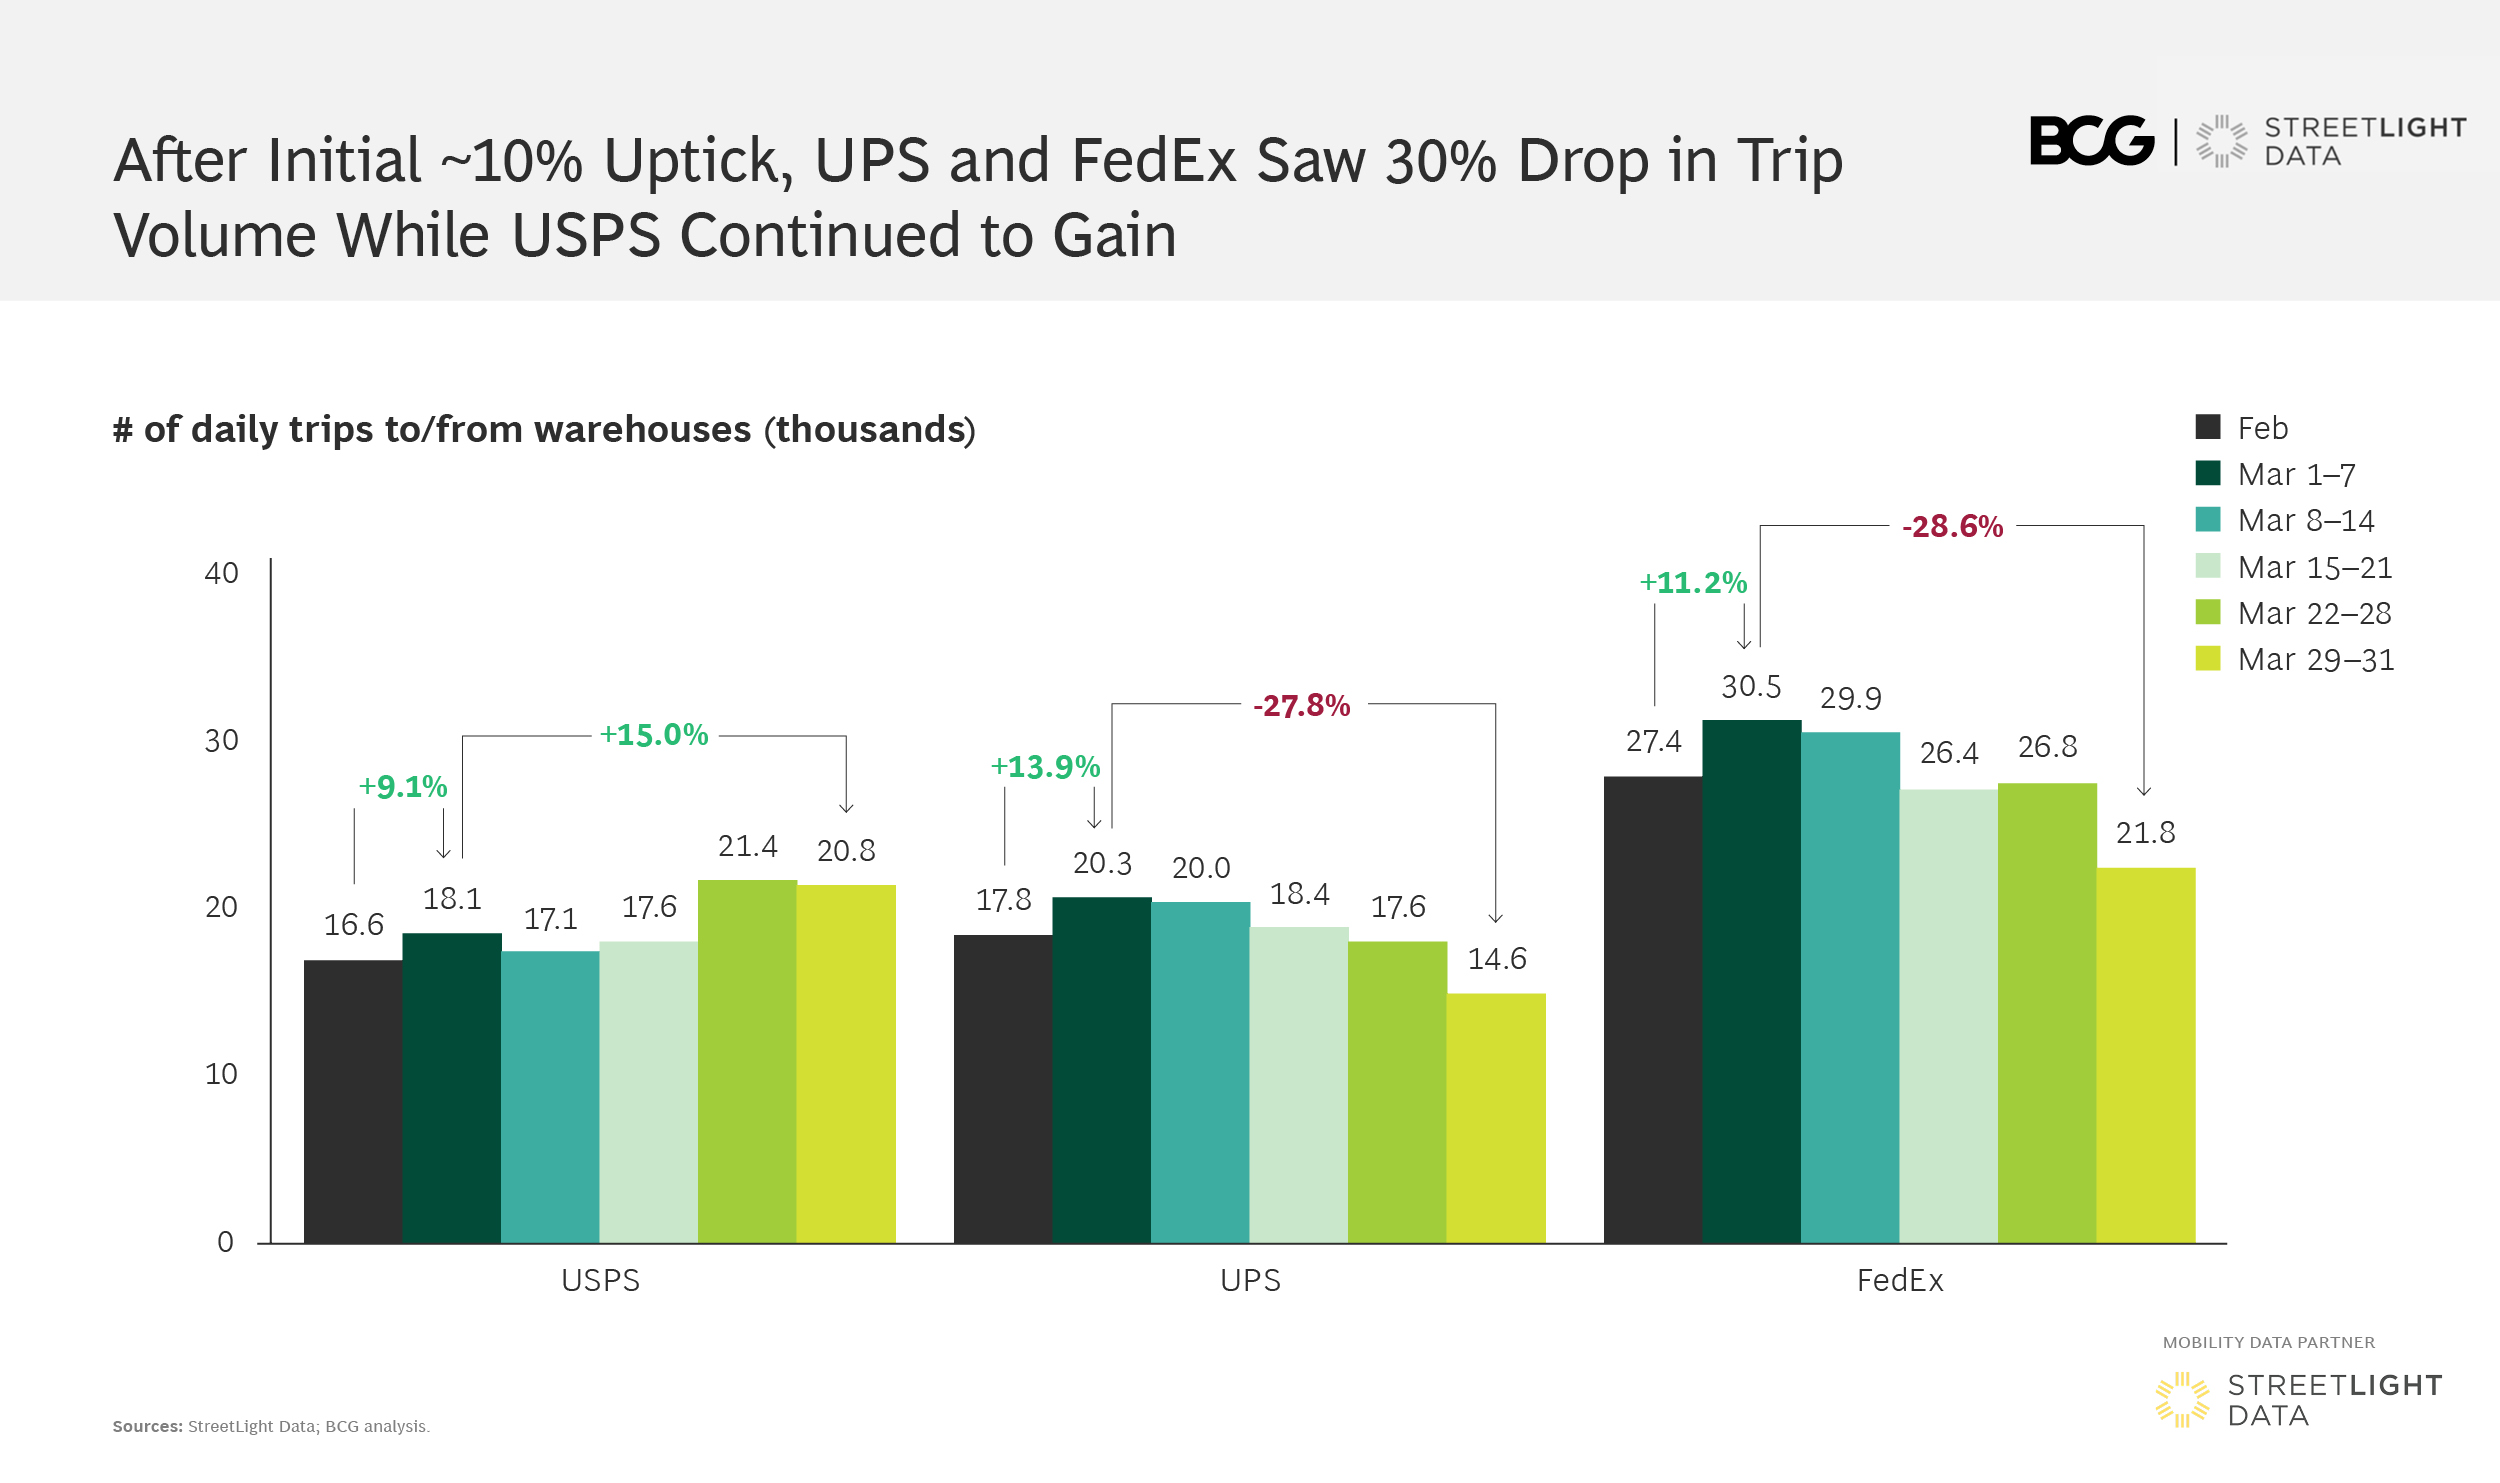
The demand for food and consumables spiked, leading some CPGs, distributors, and retailers to run flat out for a few weeks while consumers scrambled to stock up on necessities. That surge has begun to slow down as consumers gain confidence that essentials would be available in the days ahead. Yet business has slowed among other parts of the retail value chain, as well as in manufacturing and non-essential retail segments, with stay-at-home orders significantly reducing customer visits.
Resulting Revenue Challenges
VMT statistics show a decline in each state by at least 65% since the beginning of March, when the COVID-19 pandemic took hold. States and areas with larger urban populations, such as DC and NY, saw their VMT drop 81 – 88%, the result of a combination of strict stay-at-home orders, reductions in commercial activity, and the availability of public transit as an alternative for essential workers.
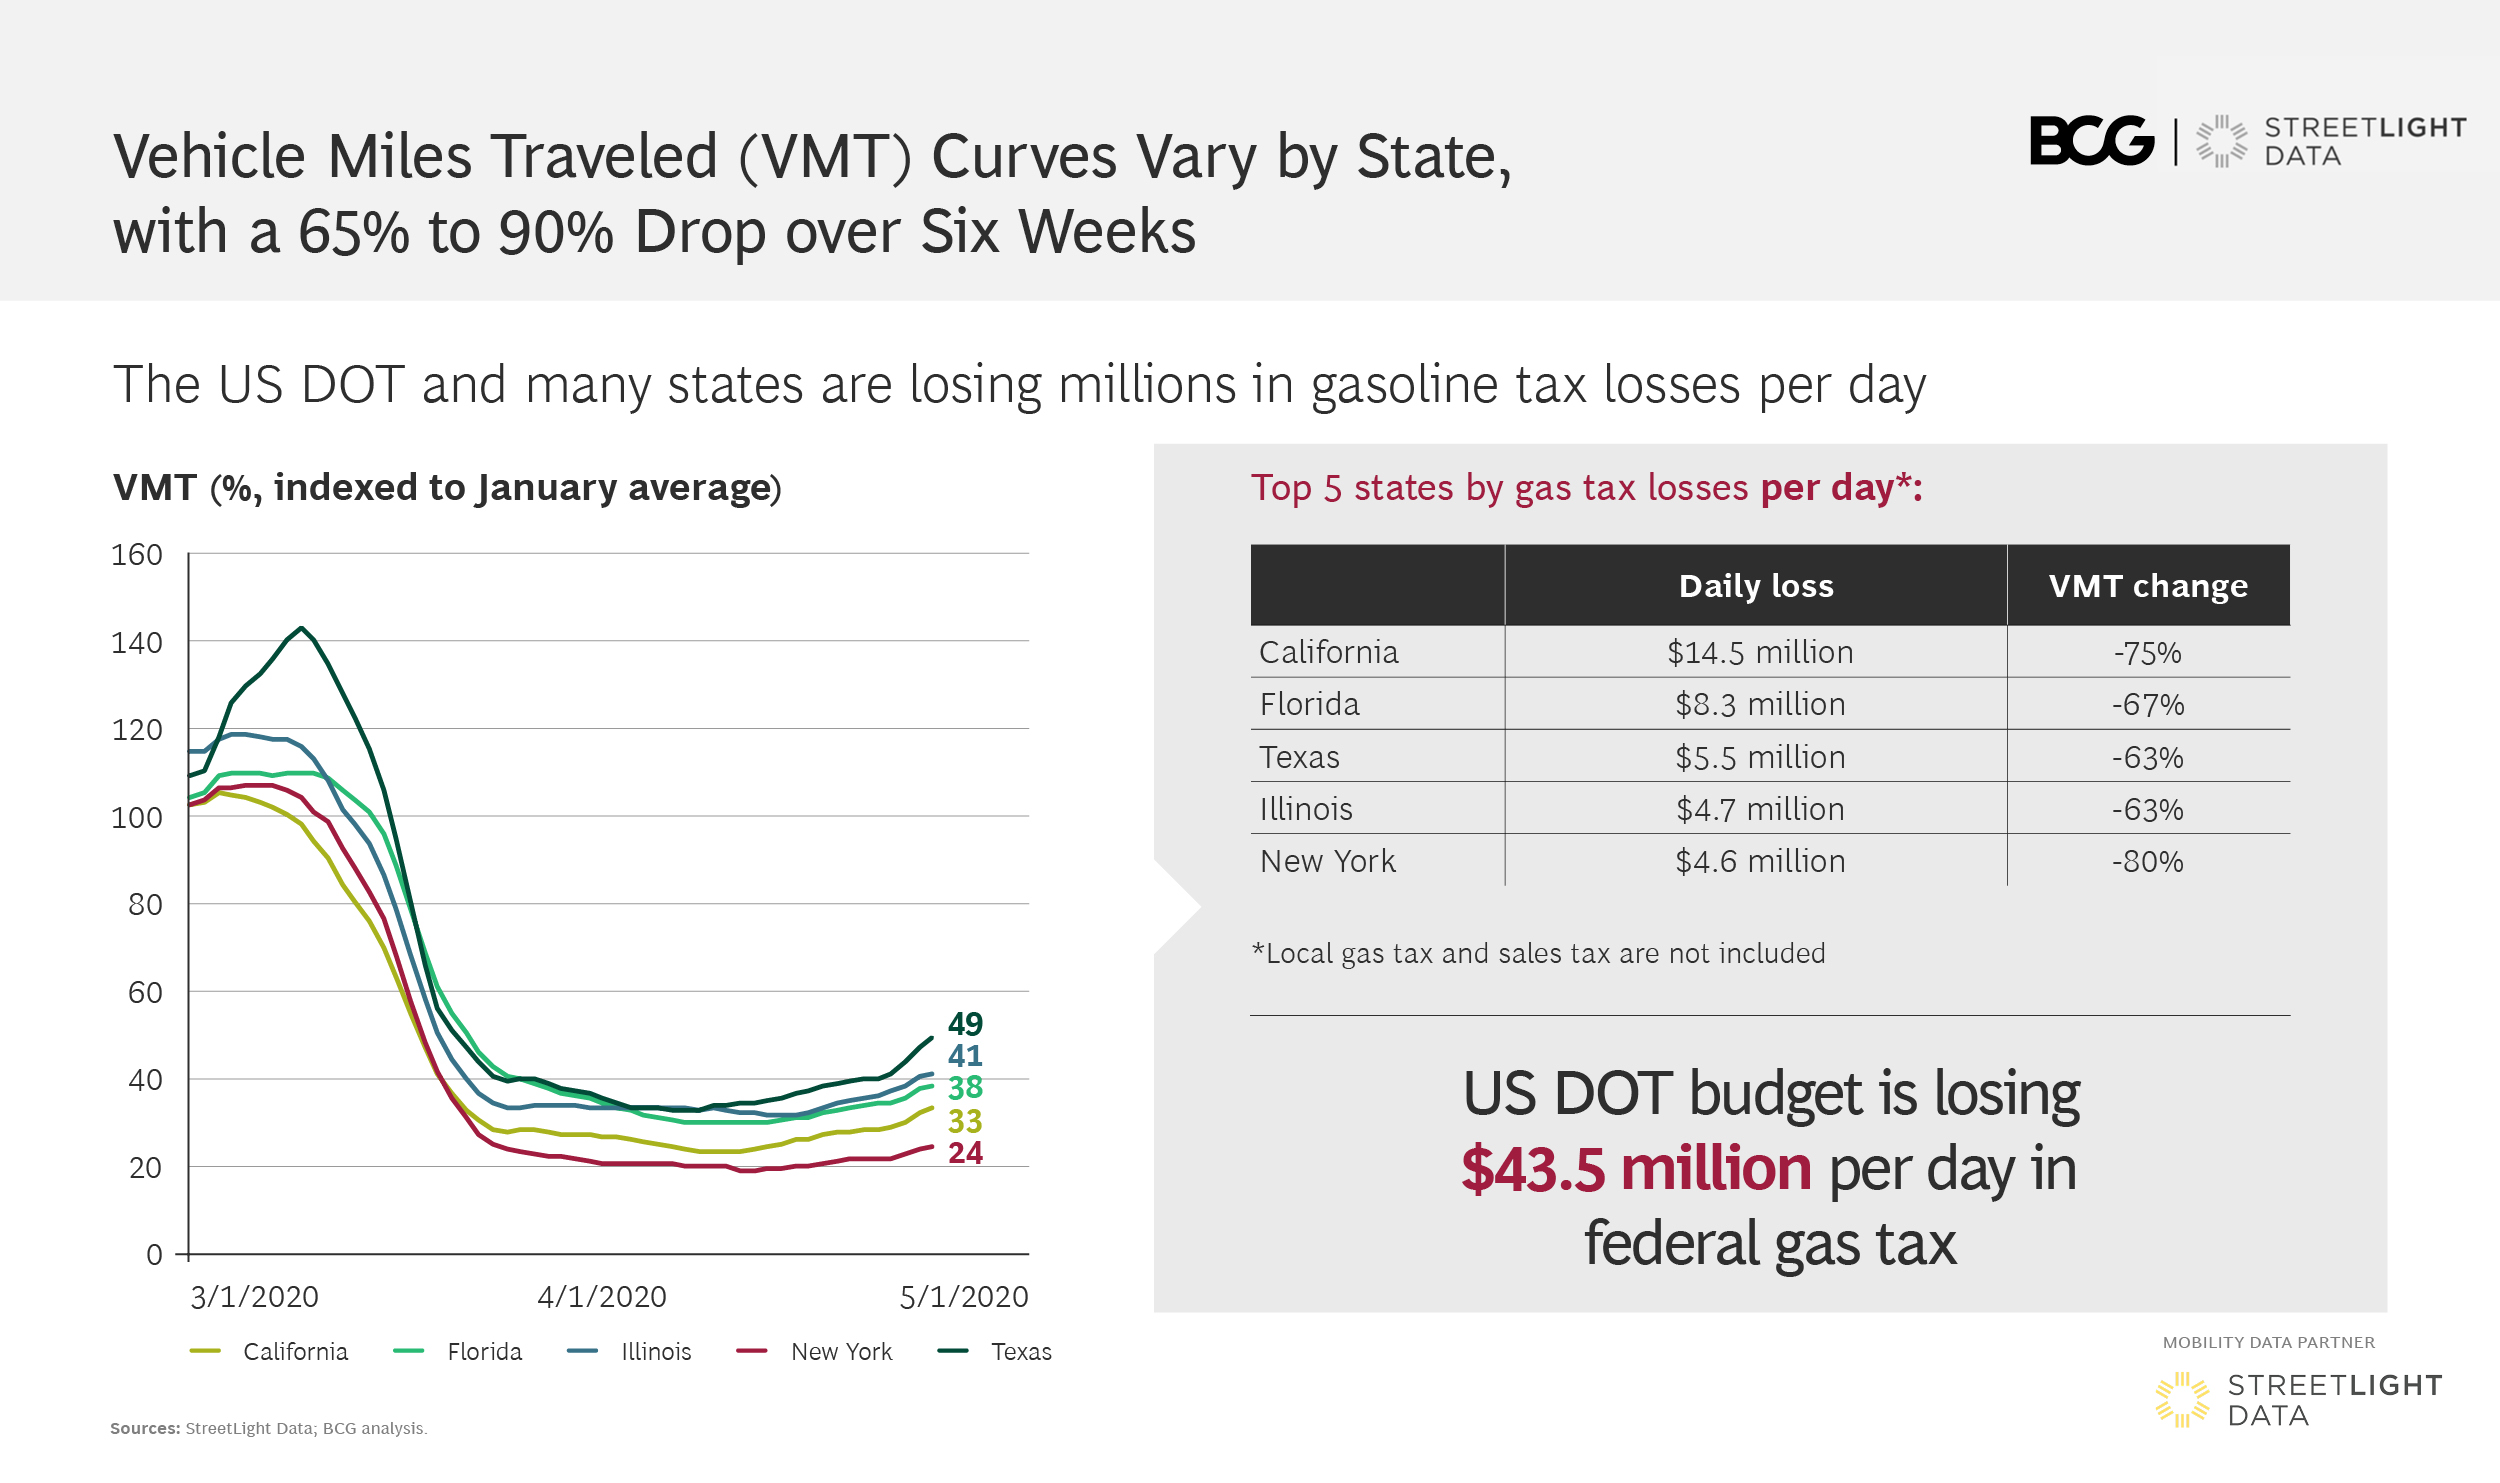
This broad VMT decrease poses a significant revenue challenge for state budgets. It may ultimately accelerate the deployment of congestion pricing schemes and changes in tolling rates to recoup lost revenue, anticipating that VMT picks up as lockdown measures are relaxed and private vehicle usage rebounds faster than transit ridership.
California feels the largest impact, with an estimated daily $14.5 million loss in gas tax vs. what is expected at a VMT baseline. Florida, Texas, Illinois, and New York also face more than $4.5 million in daily losses, and the USDOT an additional $43.5 million.
We performed our analysis in StreetLight InSight® , the proprietary online platform for customers. But StreetLight is offering vehicle miles traveled statistics via their VMT Monitor — available for free during the pandemic. This resource is an invaluable starting point for understanding the impact of reduced travel on your region.
Augustin K. Wegscheider is a partner at Boston Consulting Group’s Automotive & Mobility Practice, where he manages the Center for Mobility Innovation in North America.