
StreetLight Resources
Dive into the world of transportation data
Navigate the ever-evolving world of transportation planning with StreetLight as your trusted guide. Our comprehensive resource hub provides you with the knowledge, connections, and tools you need to make informed decisions and build a more efficient, safe, and sustainable transportation network
Filter
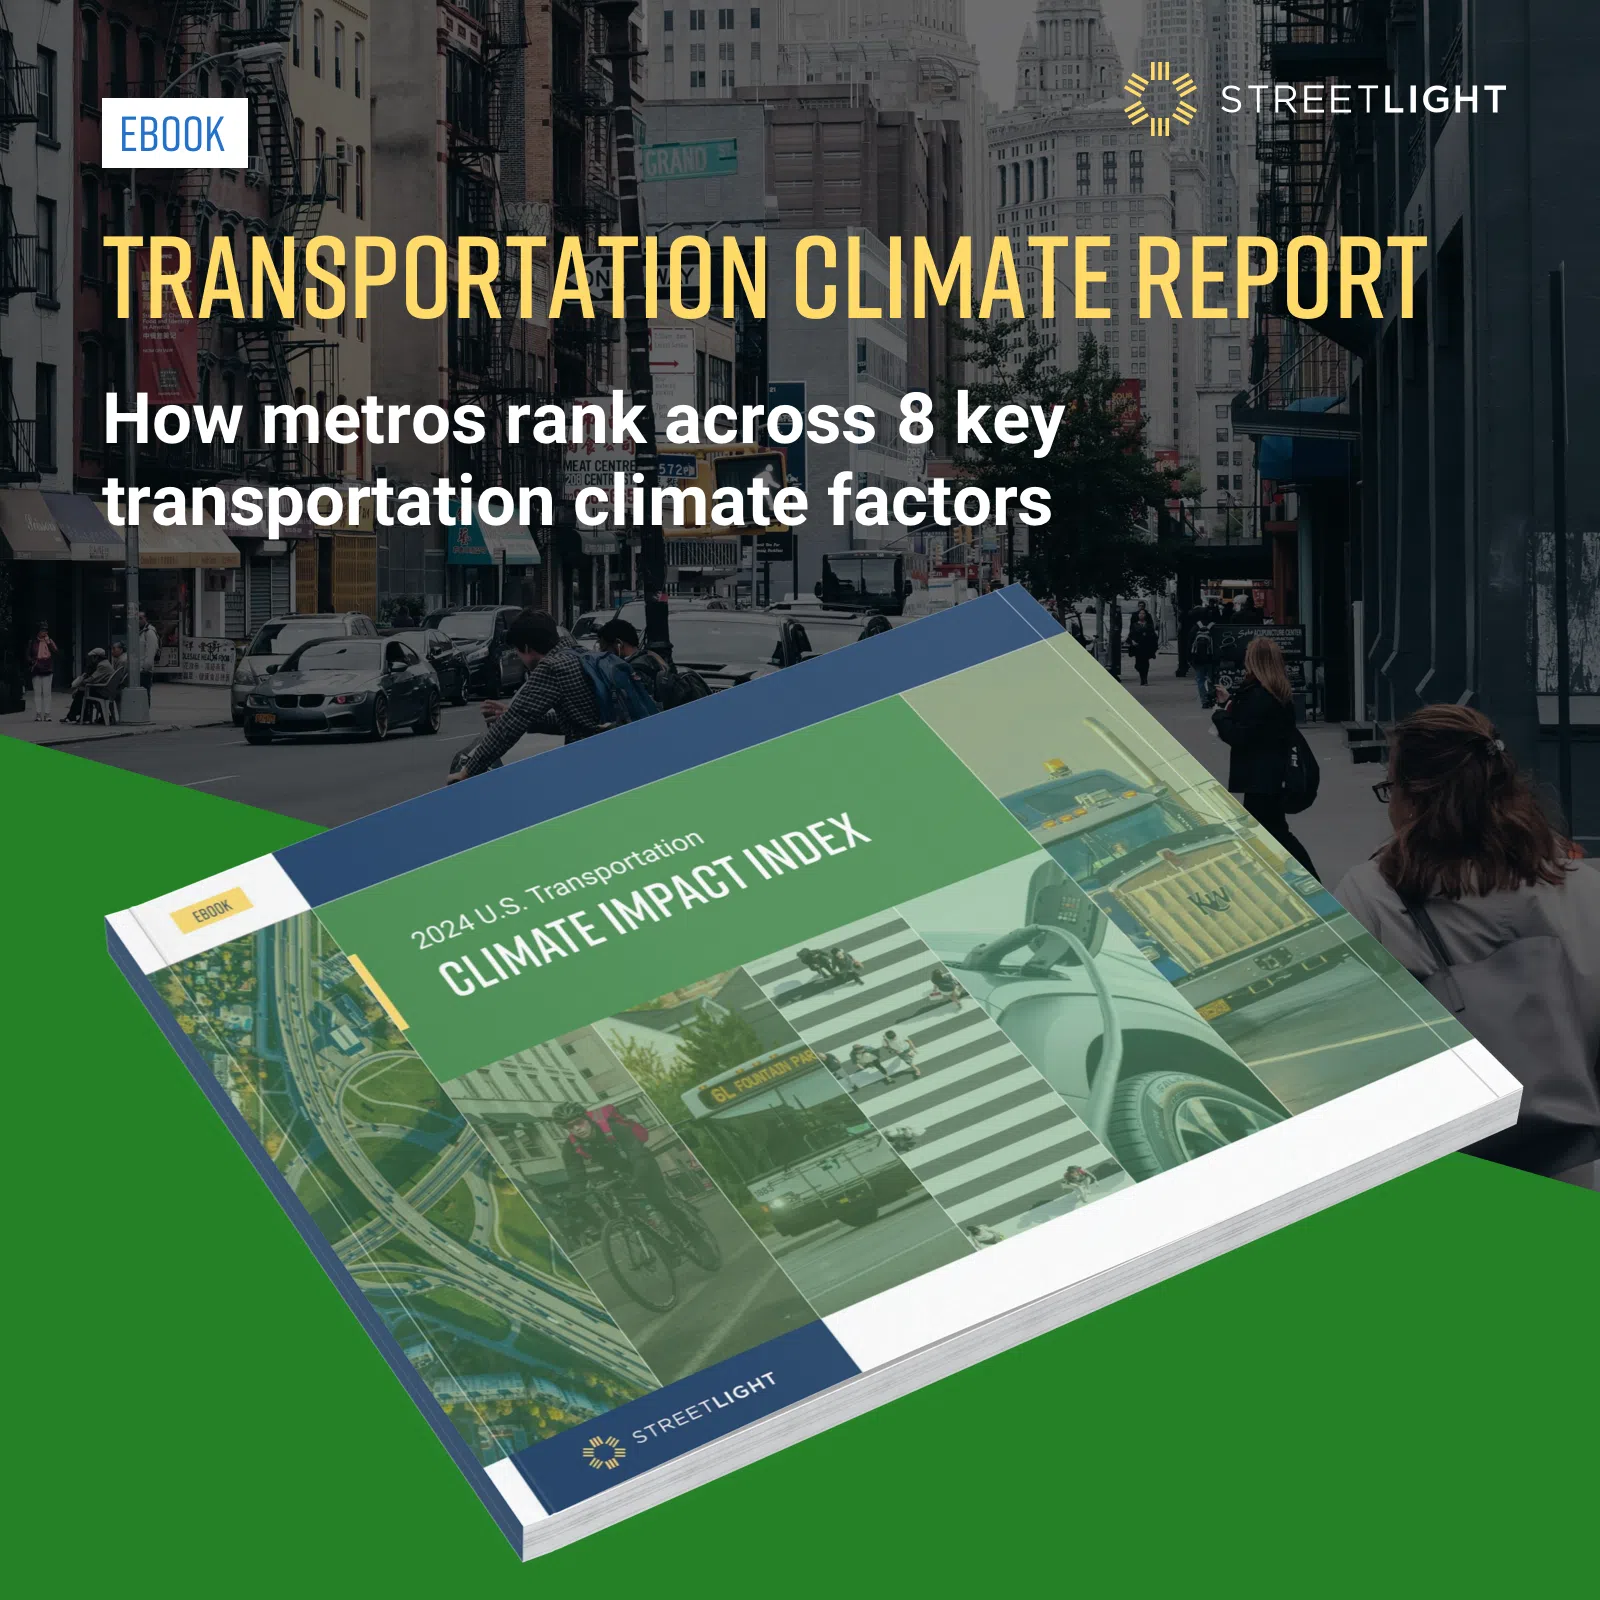
Transportation Climate Impact Index
Download our 2024 U.S. Transportation Climate Impact Index to learn where your city ranks across eight key emissions factors.
Videos
Making School Zones Safer in Clark County, Nevada | Expert Shares What the Data Revealed
Webinars
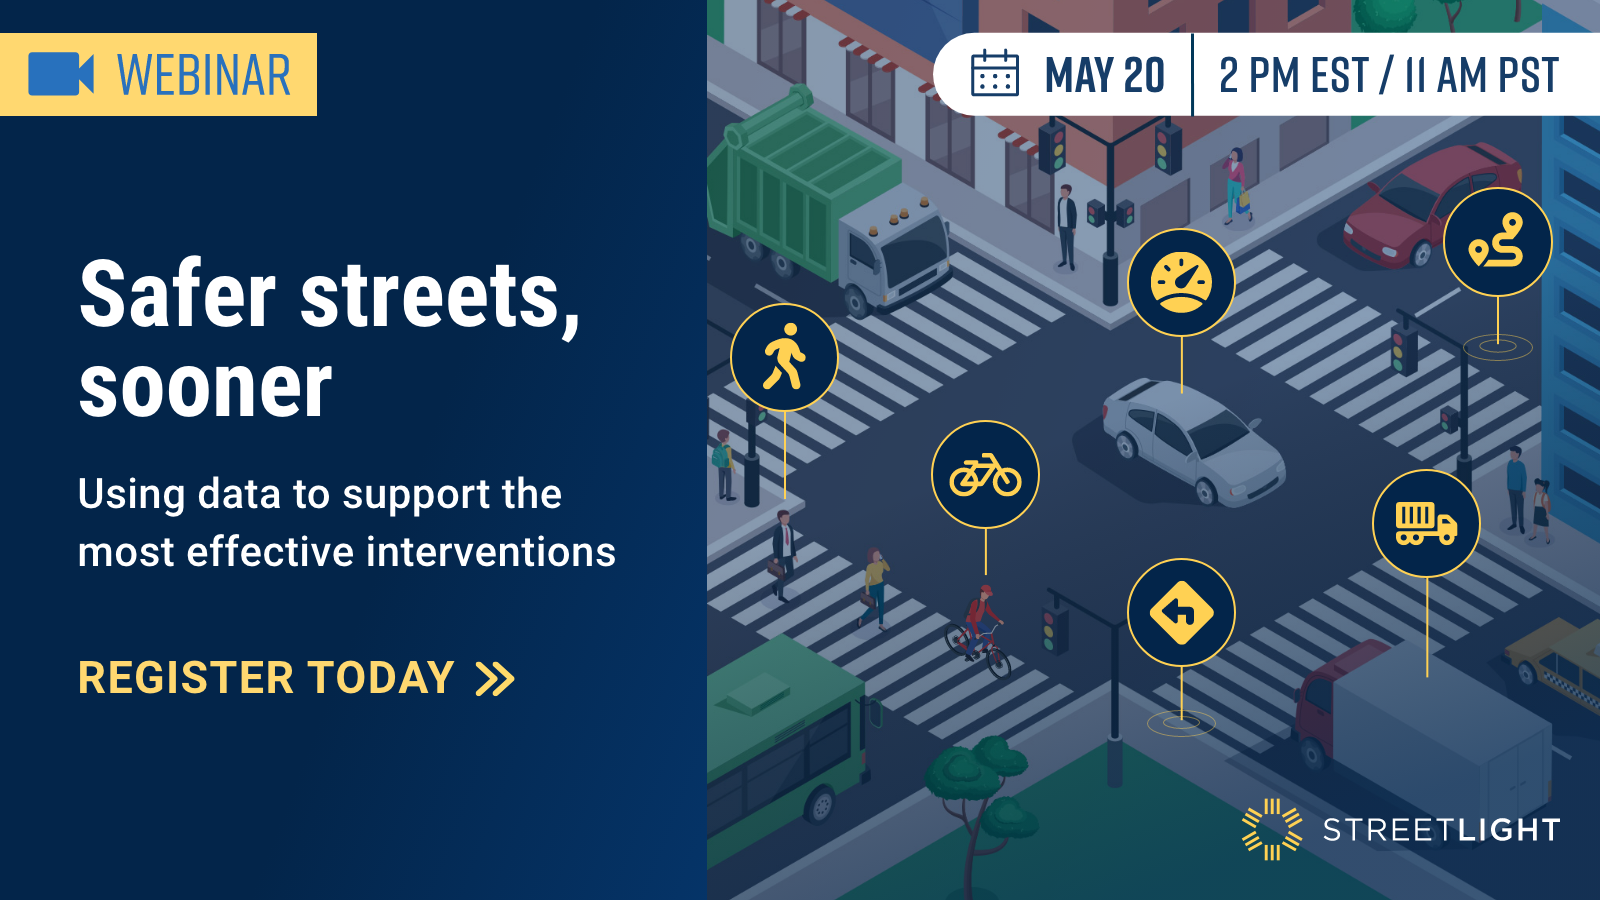
Safe Streets, Sooner: Using data to support the most impactful interventions

Case Study
Tennessee DOT optimizes operations work with detailed traffic data
Videos
Transportation Engineering Expert Explains How Connected Vehicle Data Helps Improve Road Safety
White Paper
Truck Volume Methodology and Validation
Blog
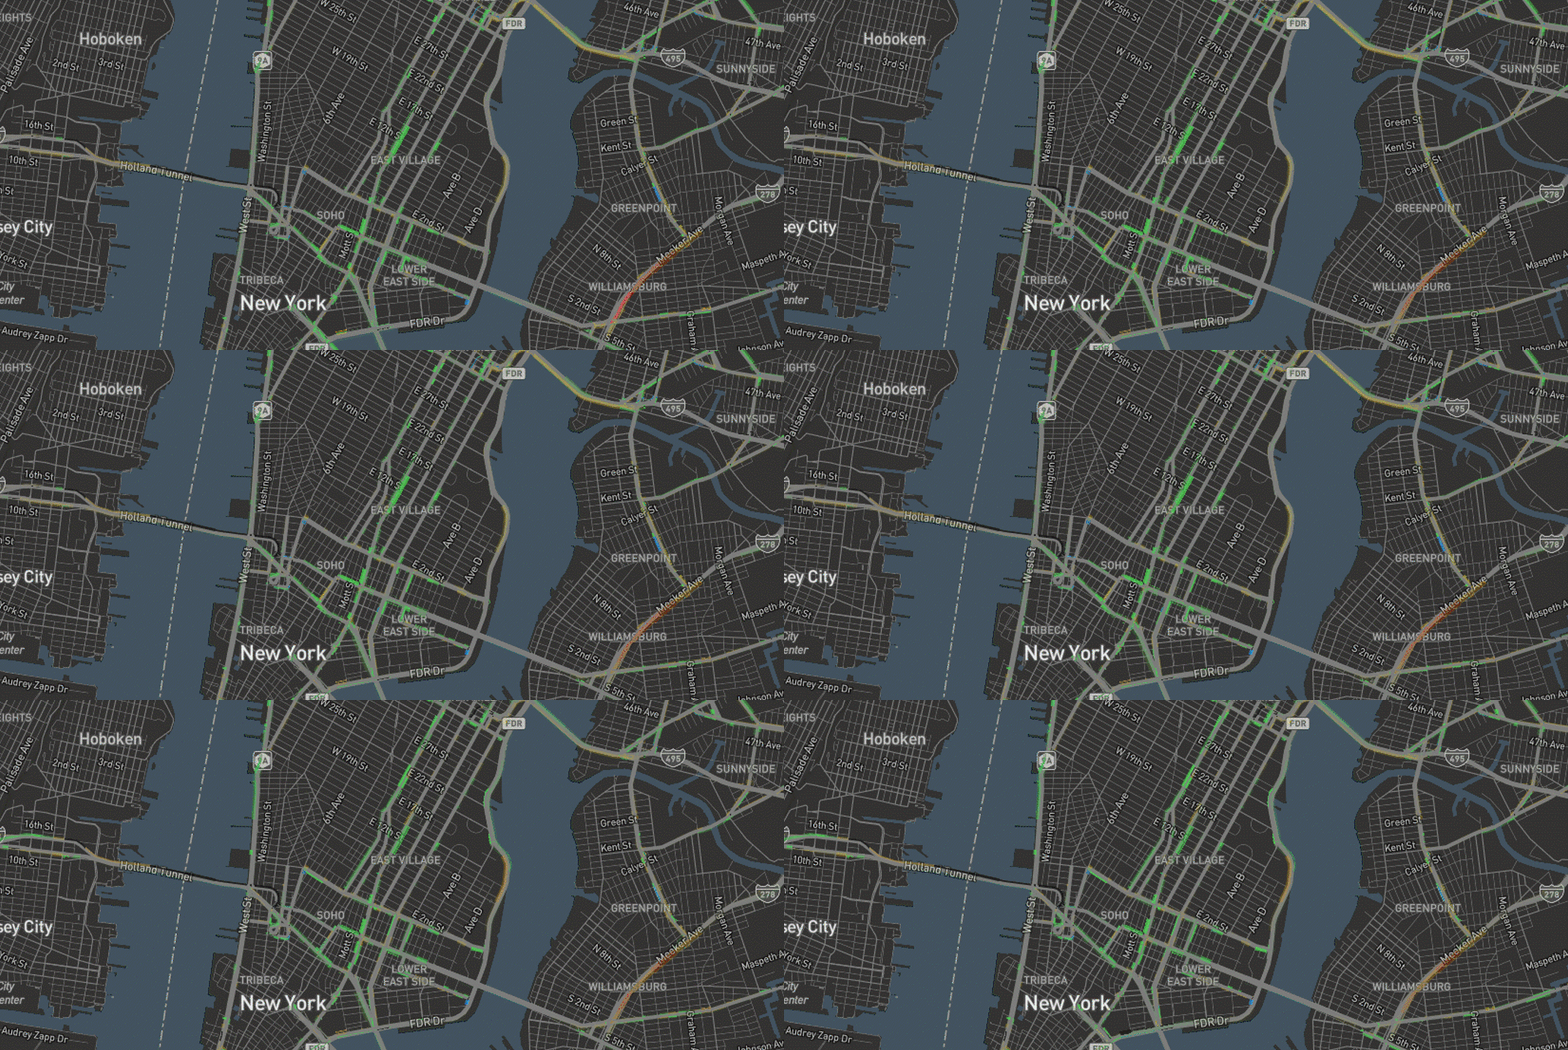
Before and After Congestion Pricing: From Staten Island to NJ to Manhattan, How Travel Times Are Changing
Blog
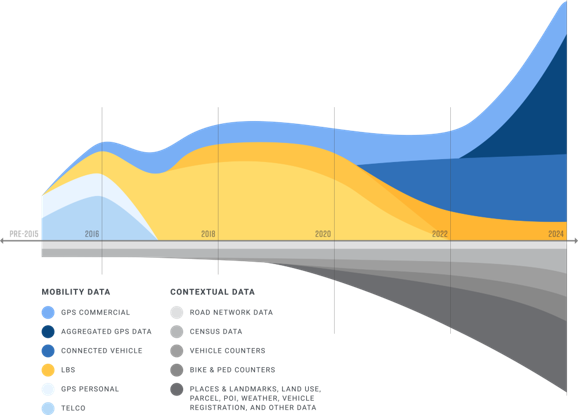
Data and Methodology Updates February 2025

White Paper
AADT 2024: Methodology and Validation

Blog
Swift Streets? Complete Rankings for Traffic Management at Every Stadium in Taylor Swift’s U.S. Eras Tour
Unleash the potential of data: Discover StreetLight
Explore the resources above and don’t hesitate to contact us if you have any questions. We’re here to partner with you in building a smarter transportation future for your community.