Bicycle & pedestrian transportation big data analytics
Active transportation insights at your fingertips
Get validated bicycle and pedestrian activity data to prioritize and fast-track multimodal investments.
See biking and walking activity in seconds with insights for your entire region across time
Speed up data collection, analysis, and collaboration with instant active transportation metrics.
Analyze empirical bicycle volumes and pedestrian volumes for all trips, from commuting to recreation.
See relative biking, walking, and driving activity and track how it changes over time.
Share near-instant active transportation insights to drive projects like bike lanes forward.
Empirical active transportation data helps you win funding and maximize the impact of multimodal projects
Get started
Bicycle and pedestrian safety for an equitable city
Read success storyThe City of Pittsburgh wanted to improve road safety in vulnerable corridors and neighborhoods. They needed to pinpoint where traffic-related crashes were occurring, but they did not have insights into bike and pedestrian travel.
Planners used transportation big data analytics, including origin-destination bicycle and pedestrian metrics and average trip distance for all neighborhoods specified.
The team then overlaid bike and pedestrian crash data to see how it compared to bike-ped activity across neighborhoods. Surprisingly, planners found that the most severe crashes occurred in areas with lower bike and pedestrian traffic rather than on the expected high-travel corridors. Real-world travel data ensured effective policy decisions and appropriate distribution of safety improvement funds.


StreetLight Active Transportation: At a glance
Get started


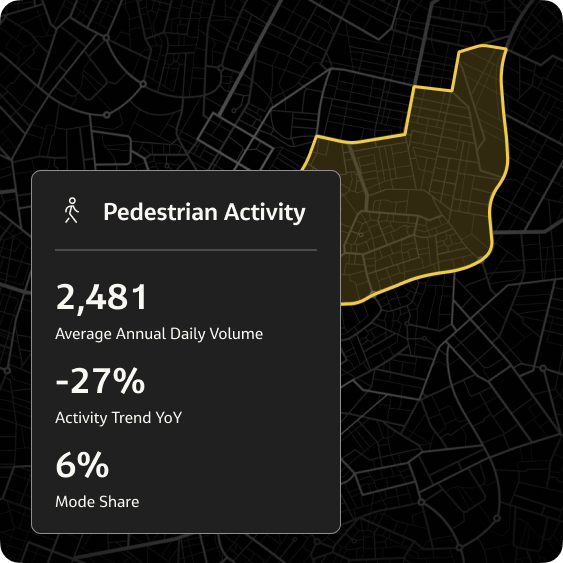
Access average annual daily volumes by census tract for biking, walking, and driving with unprecedented speed and scale.

Evaluate the sustainability of your transportation network with the percentage share of travel by biking, walking, and driving.

See annual changes in each mode with automatically calculated and visualized activity trends for the period selected.

Effectively compare activity across areas with volume per person or volume per square mile.

Add on historical bicycle and pedestrian volume metrics for specific roadways and intersections to zoom in on hot spots.
Check out other StreetLight products
Access our full suite of tools and visualizations to solve all your most pressing transportation planning challenges.
Accelerate your infrastructure projects with trusted quality traffic counts that are available for all roads in just a few clicks.
Pinpoint the most high-risk locations across your entire multimodal network.
Streamline your region’s traffic flow and signal timing with recent every-intersection traffic counts.
Power your transportation models with the most up-to-date and trusted route choice data, including traffic volumes, available in minutes and at scale


Resources
Explore our library
Case studies, data-driven research, and timely articles to learn how StreetLight helps solve active transportation challenges.
Our customers
See why they chose StreetLight

FAQs
Quick answers to questions you may have
Discover everything about StreetLight’s Active Transportation features, benefits, and more.
Big data analytics for bicycle and pedestrian transportation planning uses data collected from connected devices to provide information on how bikes, pedestrians, and vehicles move. Unlike traditional data collection methods like sensors and surveys, big data analytics can provide data for any census tract within minutes, leveraging large sample sizes to generate more reliable insights.
It also allows planners to view historical trends across time and compare travel behavior of bikes, pedestrians, and vehicles year over year.
Using big data analytics for active transportation planning allows agencies, firms, advocacy groups, and businesses to access the latest data on bike, pedestrian, and vehicle activity within minutes to quickly understand safety concerns (such as high-speed vehicle activity), track trends in active transportation use, and more. These insights can be essential for understanding the effectiveness of mode-shift policies and planning future projects that prioritize cycling and walking while also helping communicate clearly with public and political stakeholders.
Yes, agencies can track mode share and see how much relative biking, walking, and driving is occurring and how it changes over time. You can also measure annual changes in each mode with automatically calculated and visualized activity trends, which is critical for evaluating the sustainability of your transportation network.
Customers can see the impact of biking and walking activity in seconds with insights for your entire region across time. The dashboard visualization allows for a quick way to view average annual daily volume, mode share, time trends, and normalized volume metrics for Census Tracts across the U.S. in a few clicks.
Do you need data to inform your next project?
Talk to StreetLight about your needs, and join us in shaping a more efficient, sustainable world.
Here are some resources to help you go a step further:

