With more than 10,000 projects every month, StreetLight’s analytics have informed transportation analyses in all lower 48 States, Canada and Mexico. Below are some of the entities using StreetLight, followed by numerous case studies we invite you to peruse.
STATES
CITIES & MPOs

CONSULTING FIRMS

ENTERPRISE


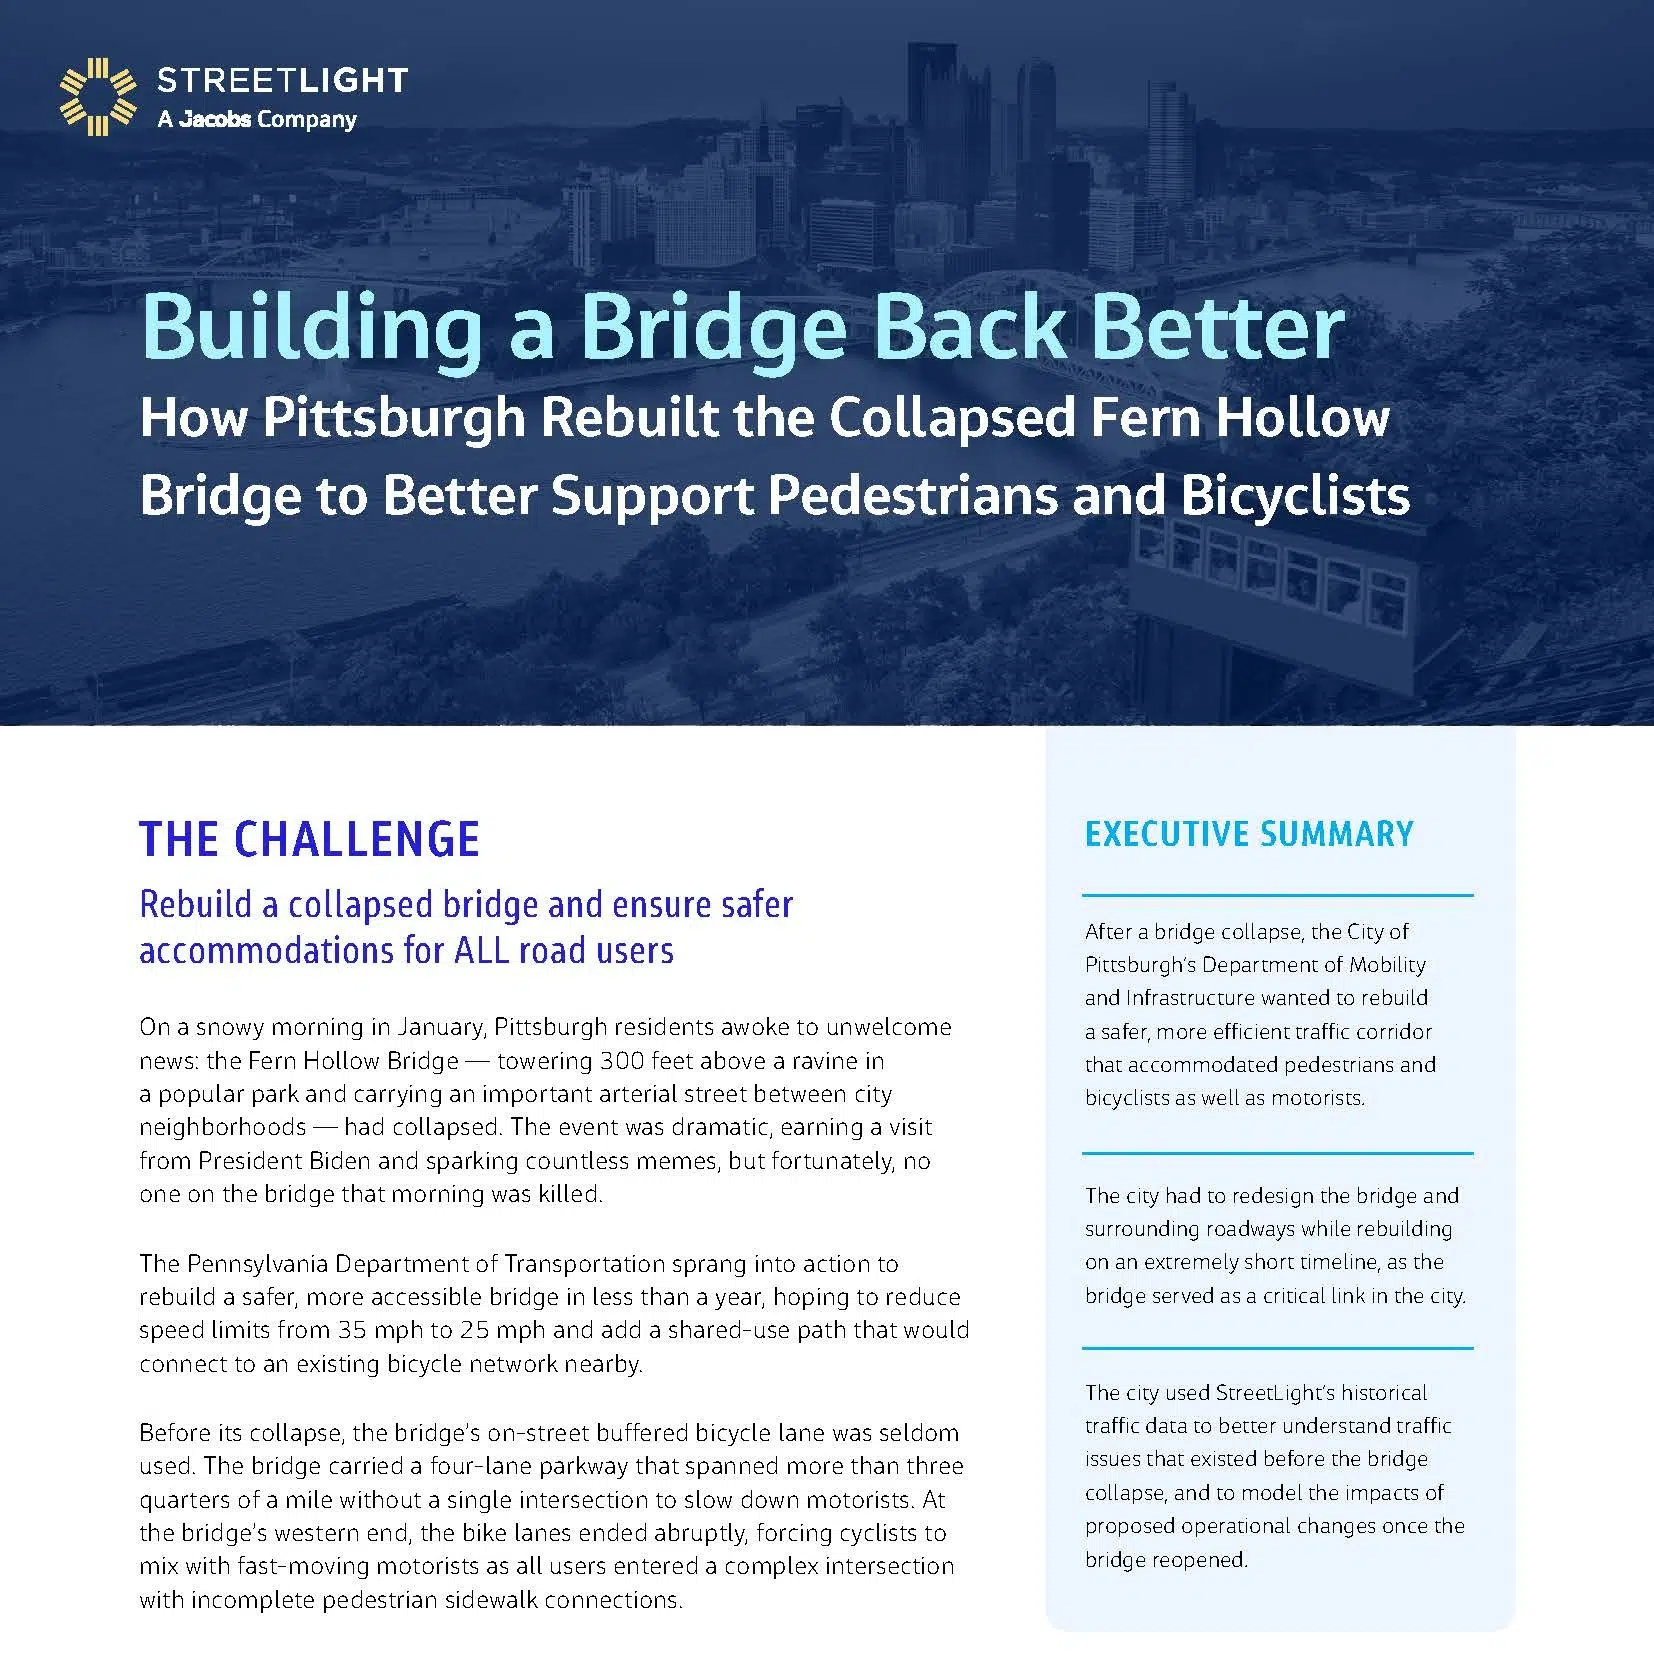
How Pittsburgh Built Bike and Pedestrian Safety Into Fern Hollow Bridge After Its Collapse
After the Fern Hollow Bridge collapse made headlines, the City of Pittsburgh needed to rebuild quickly. See how they used traffic data from StreetLight to meet tight deadlines while also improving bike and pedestrian safety on this important connector.
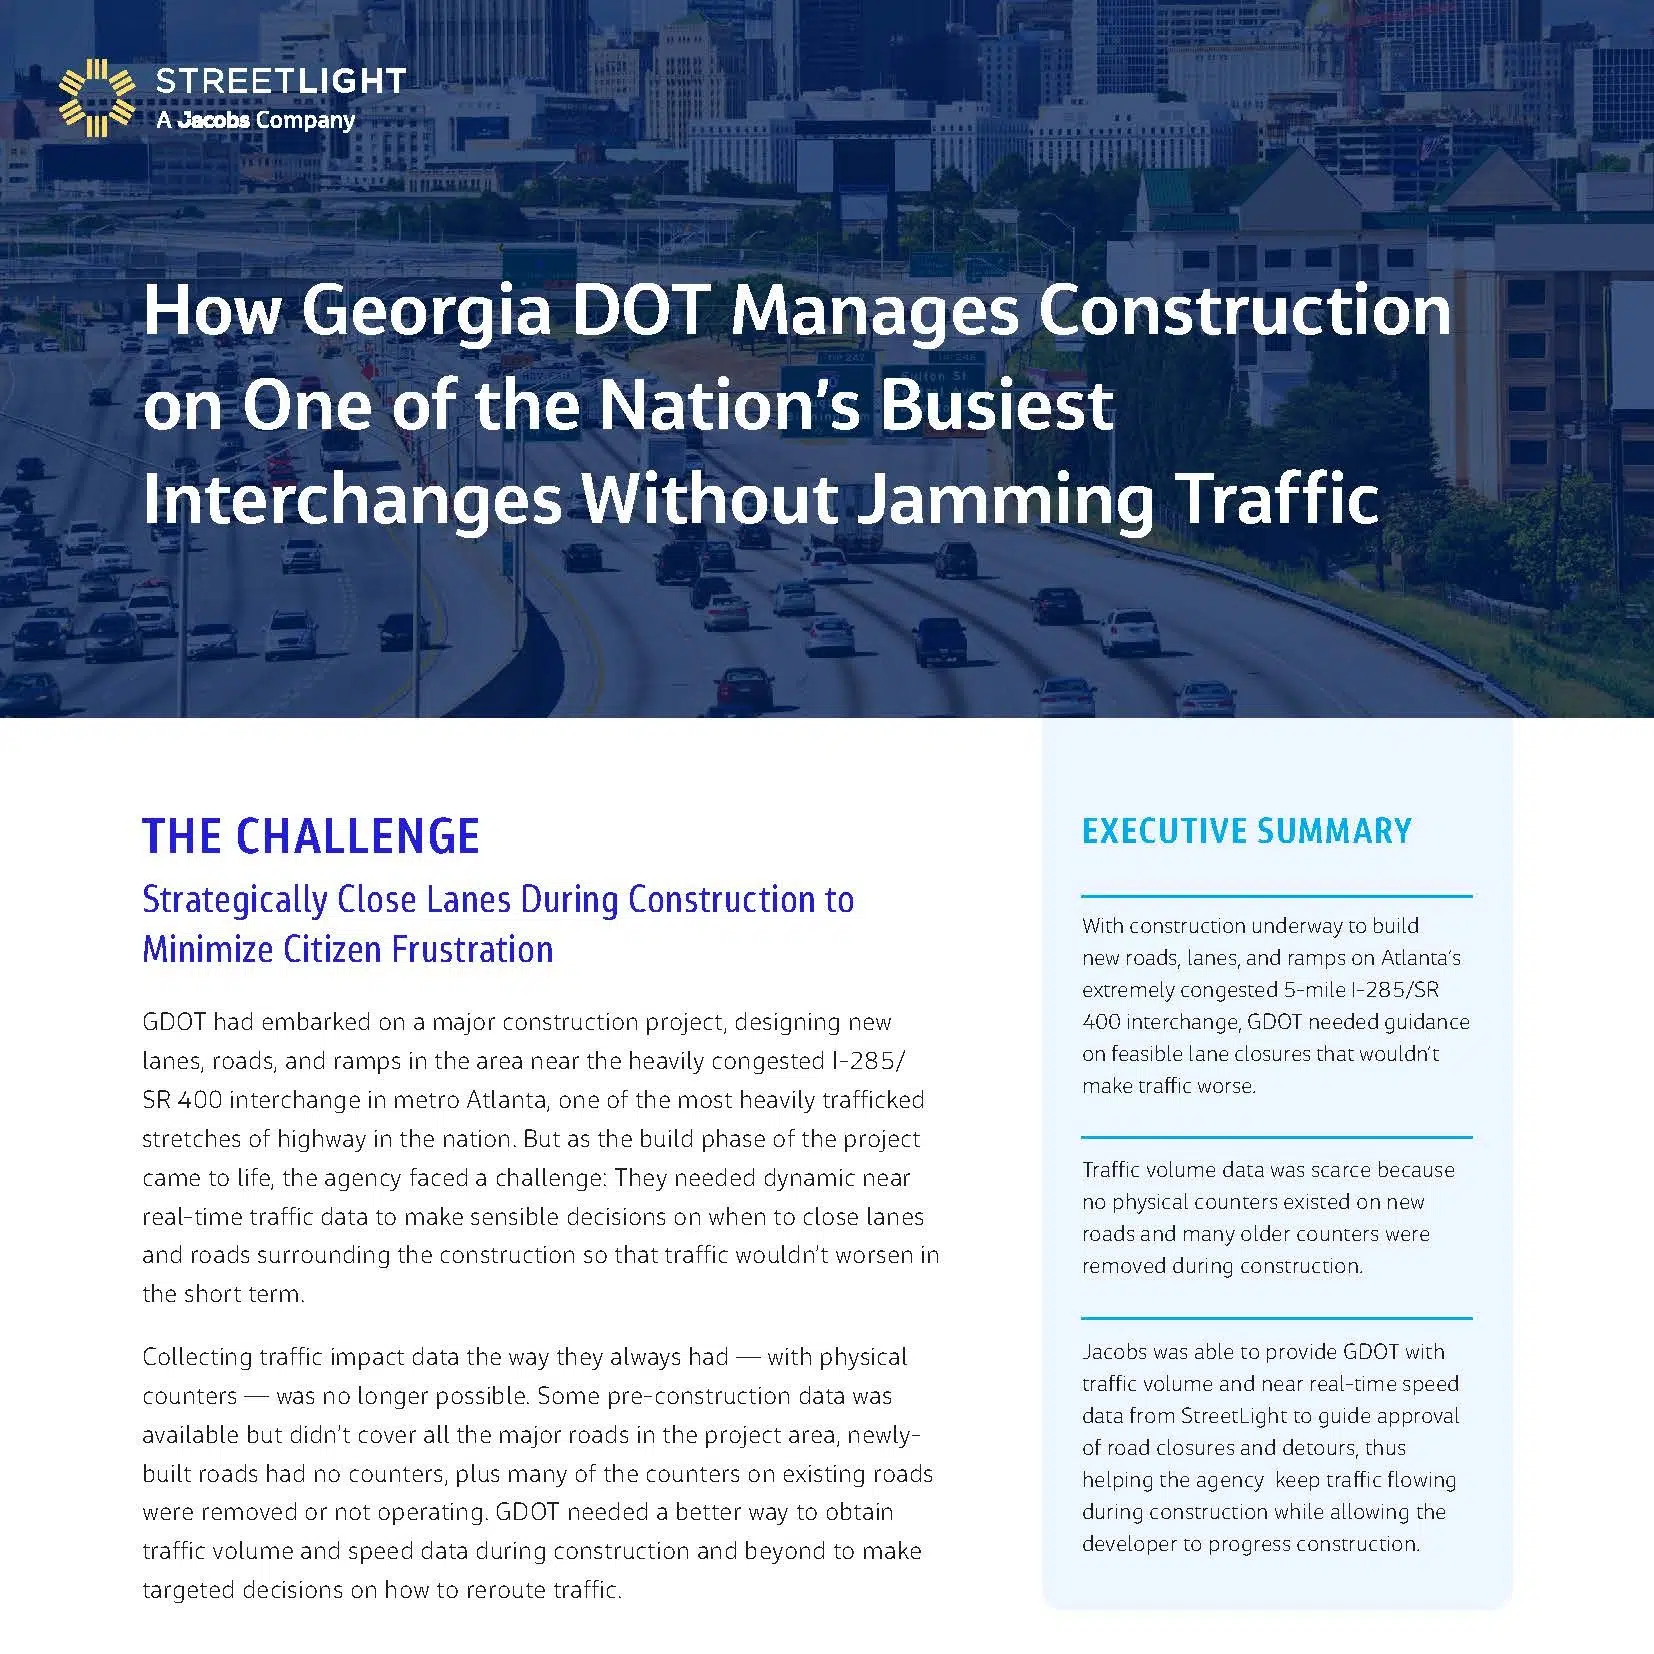
How Georgia DOT Manages Construction on One of the Nation’s Busiest Interchanges
To improve safety and fix congestion along a major highway in Atlanta, Georgia DOT needed to construct new roads, lanes, and ramps around the hectic I-285/SR 400 interchange. See how they used StreetLight to ensure lane closures and detours wouldn’t worsen traffic as developers worked to complete the re-design.
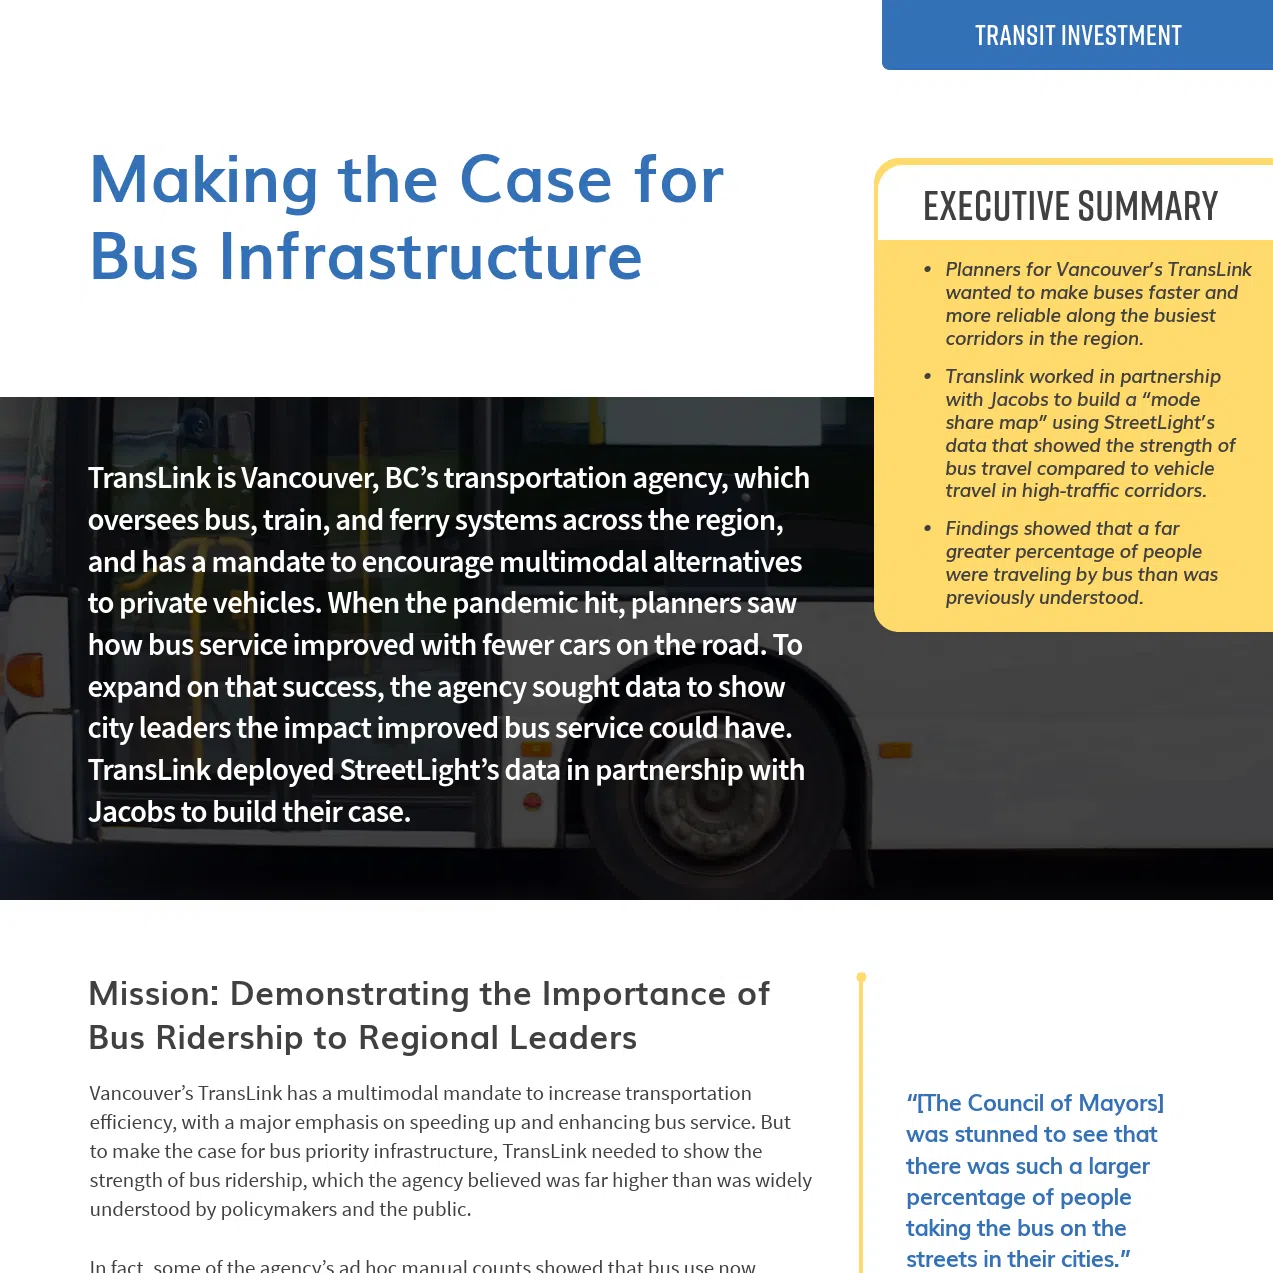
Making the Case for Bus Infrastructure
To encourage multimodal alternatives to personal vehicles and increase transportation efficiency, Vancouver’s TransLink needed to prove the value of bus service and show how strong bus ridership was compared to vehicle activity.
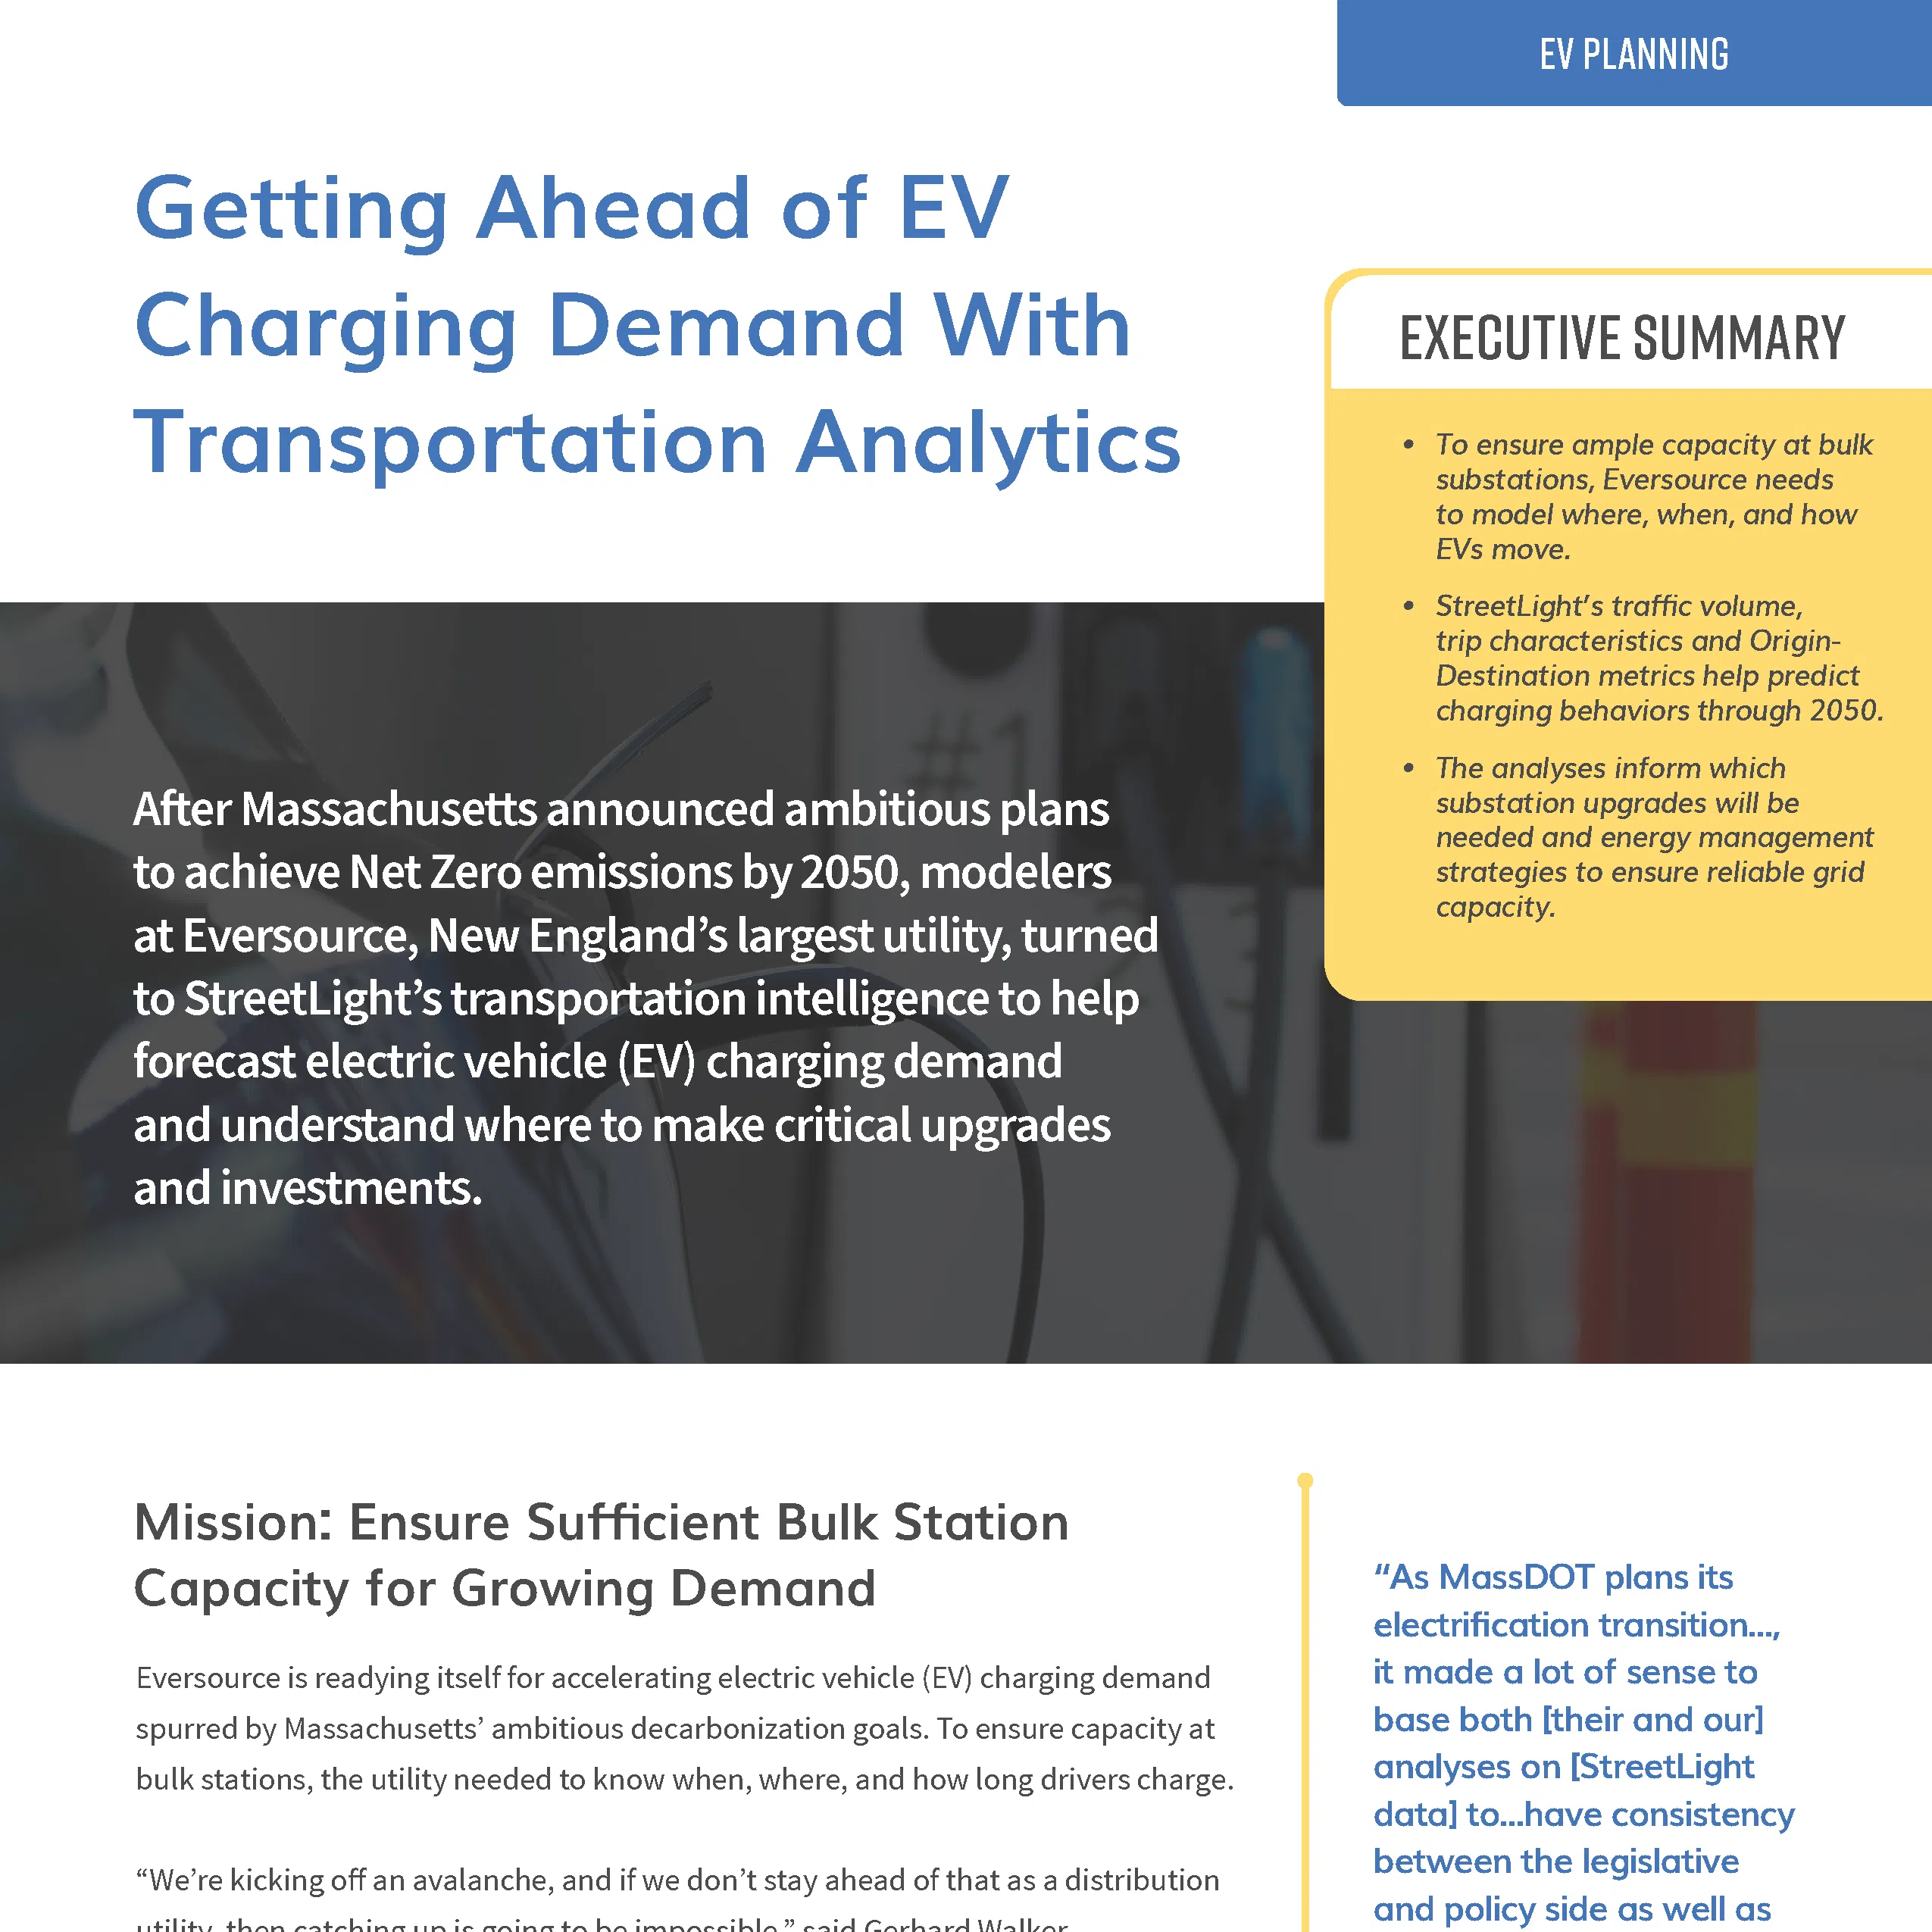
Getting Ahead of EV Charging Demand With Transportation Analytics
To ensure charging capacity keeps up with accelerating demand at electric vehicle charging stations, Massachusetts’s largest electric utility powers their demand models with mobility data.
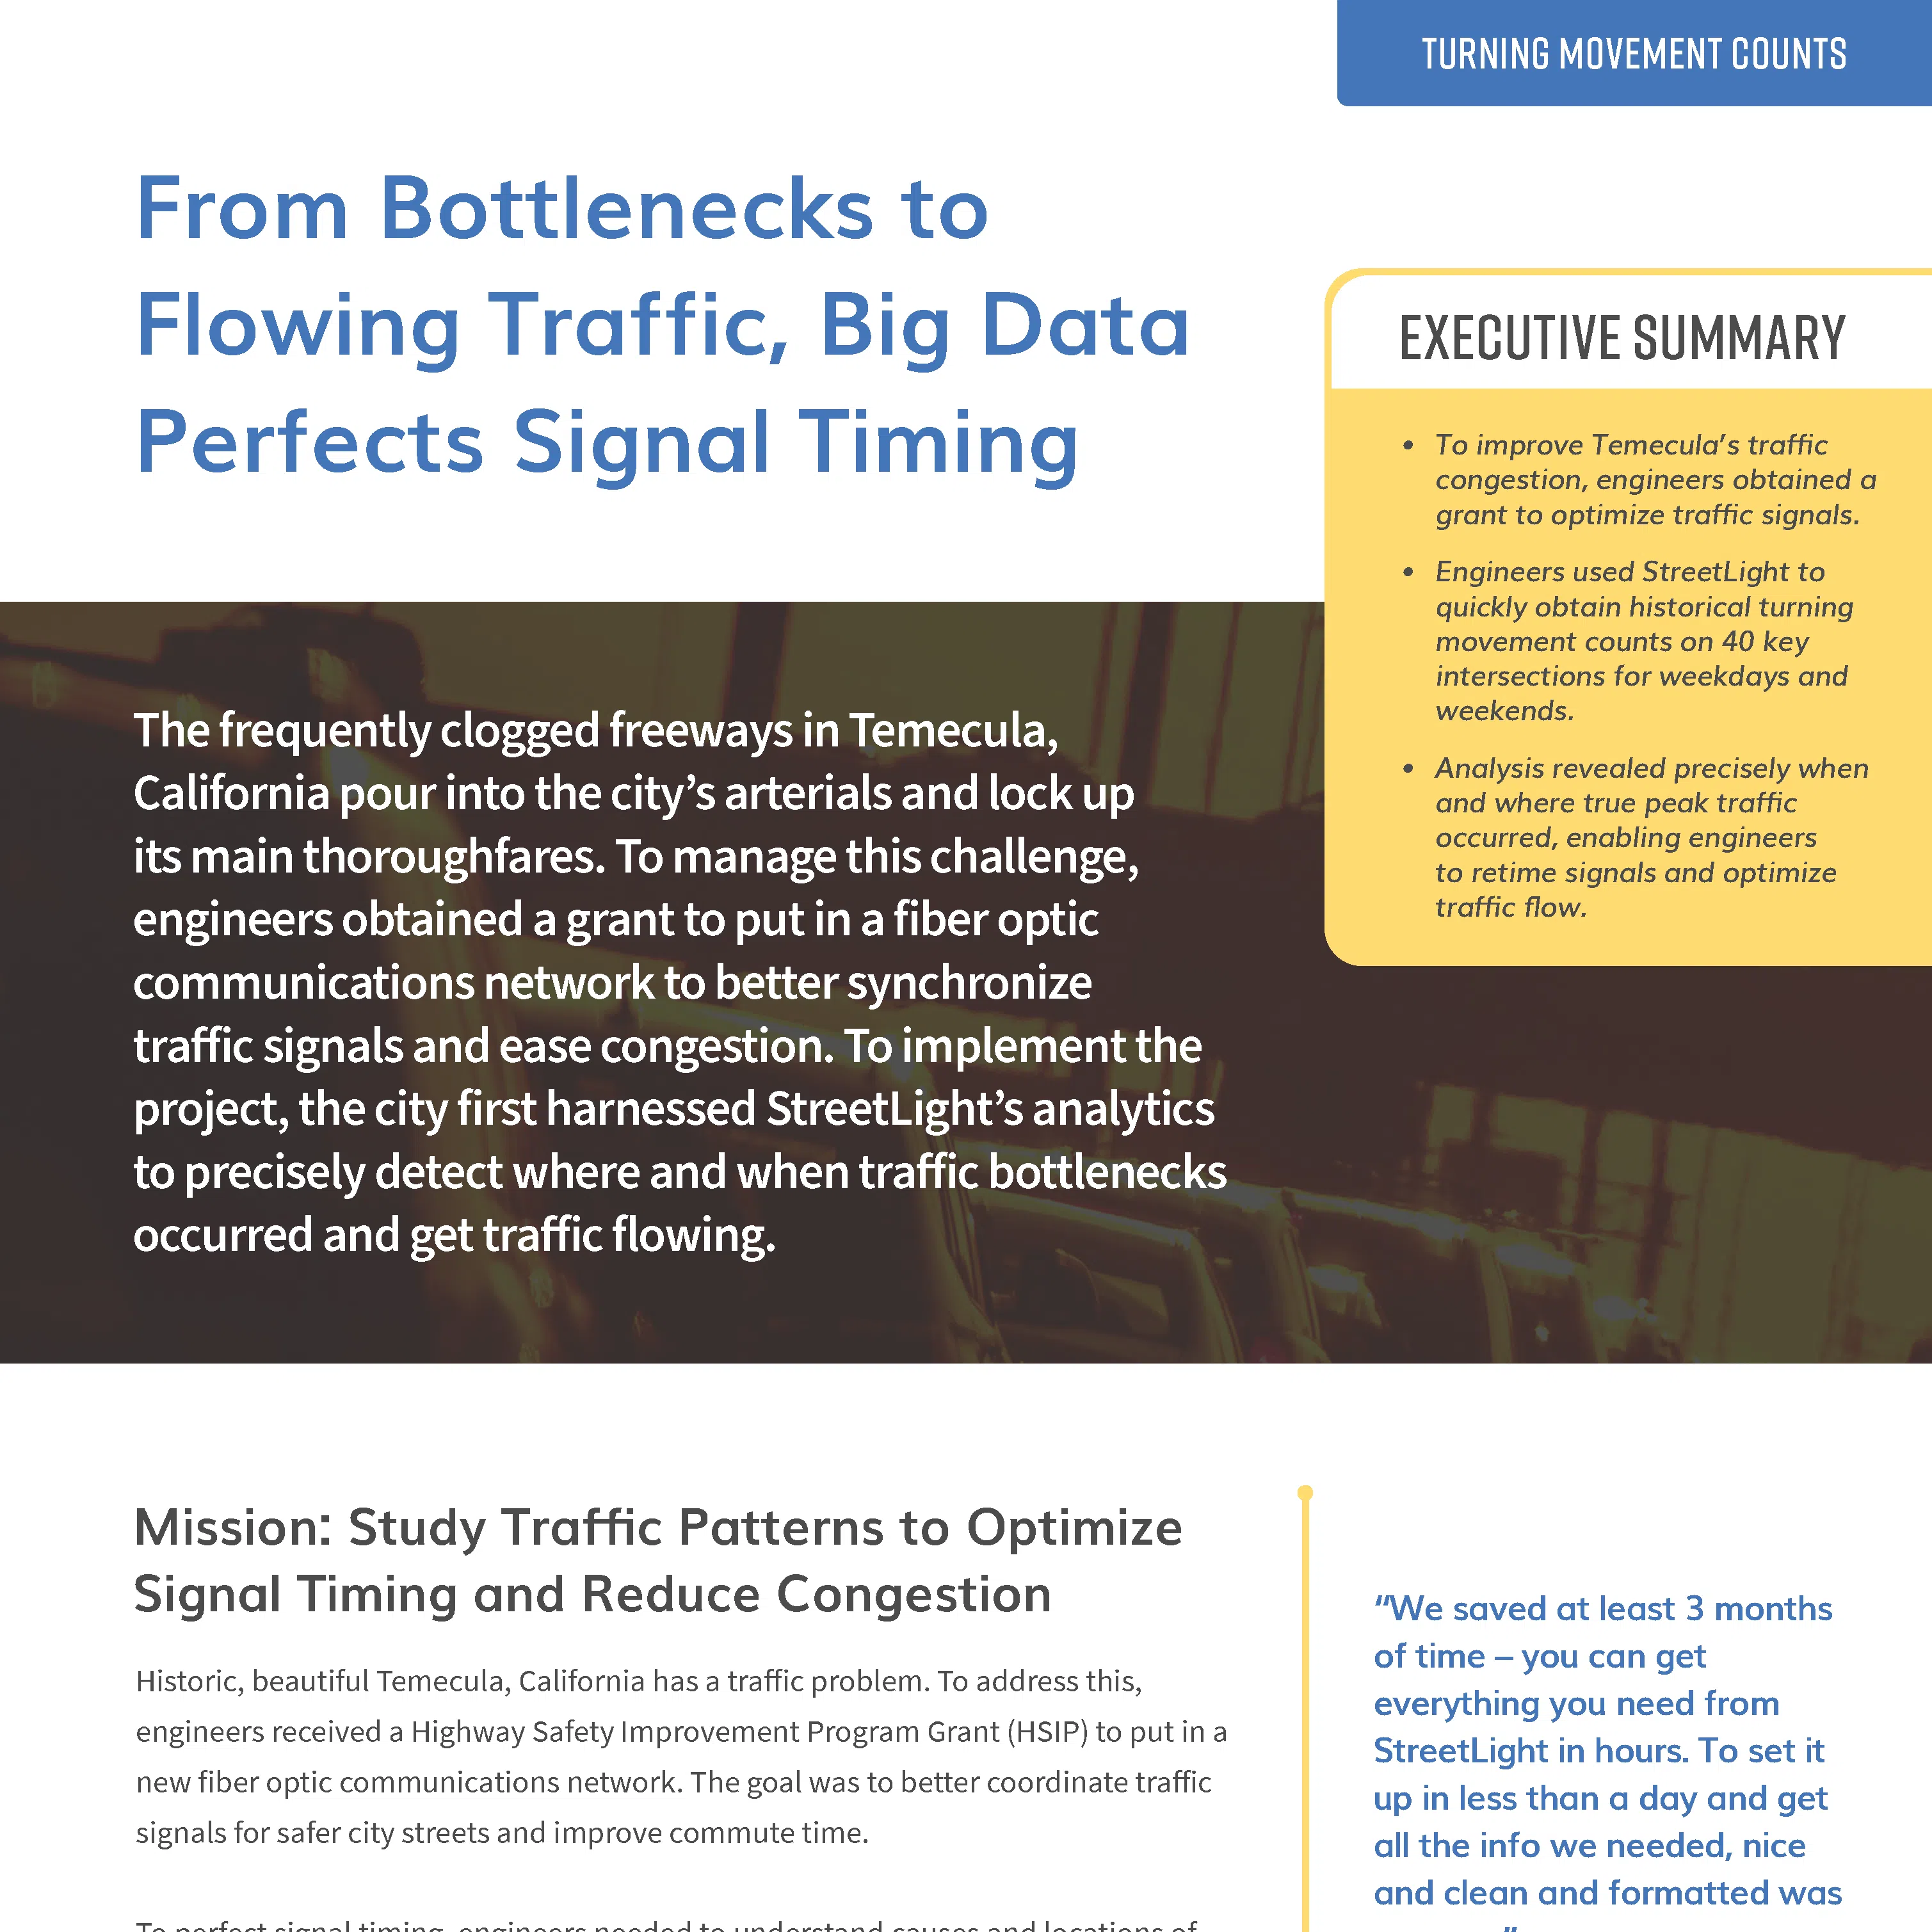
To Improve Safety and Congestion, Expedite Signal Retiming with Big Data
See how Temecula used on-demand Turning Movement Counts to optimize signal timing, reduce congestion, and make intersection safer throughout the city.
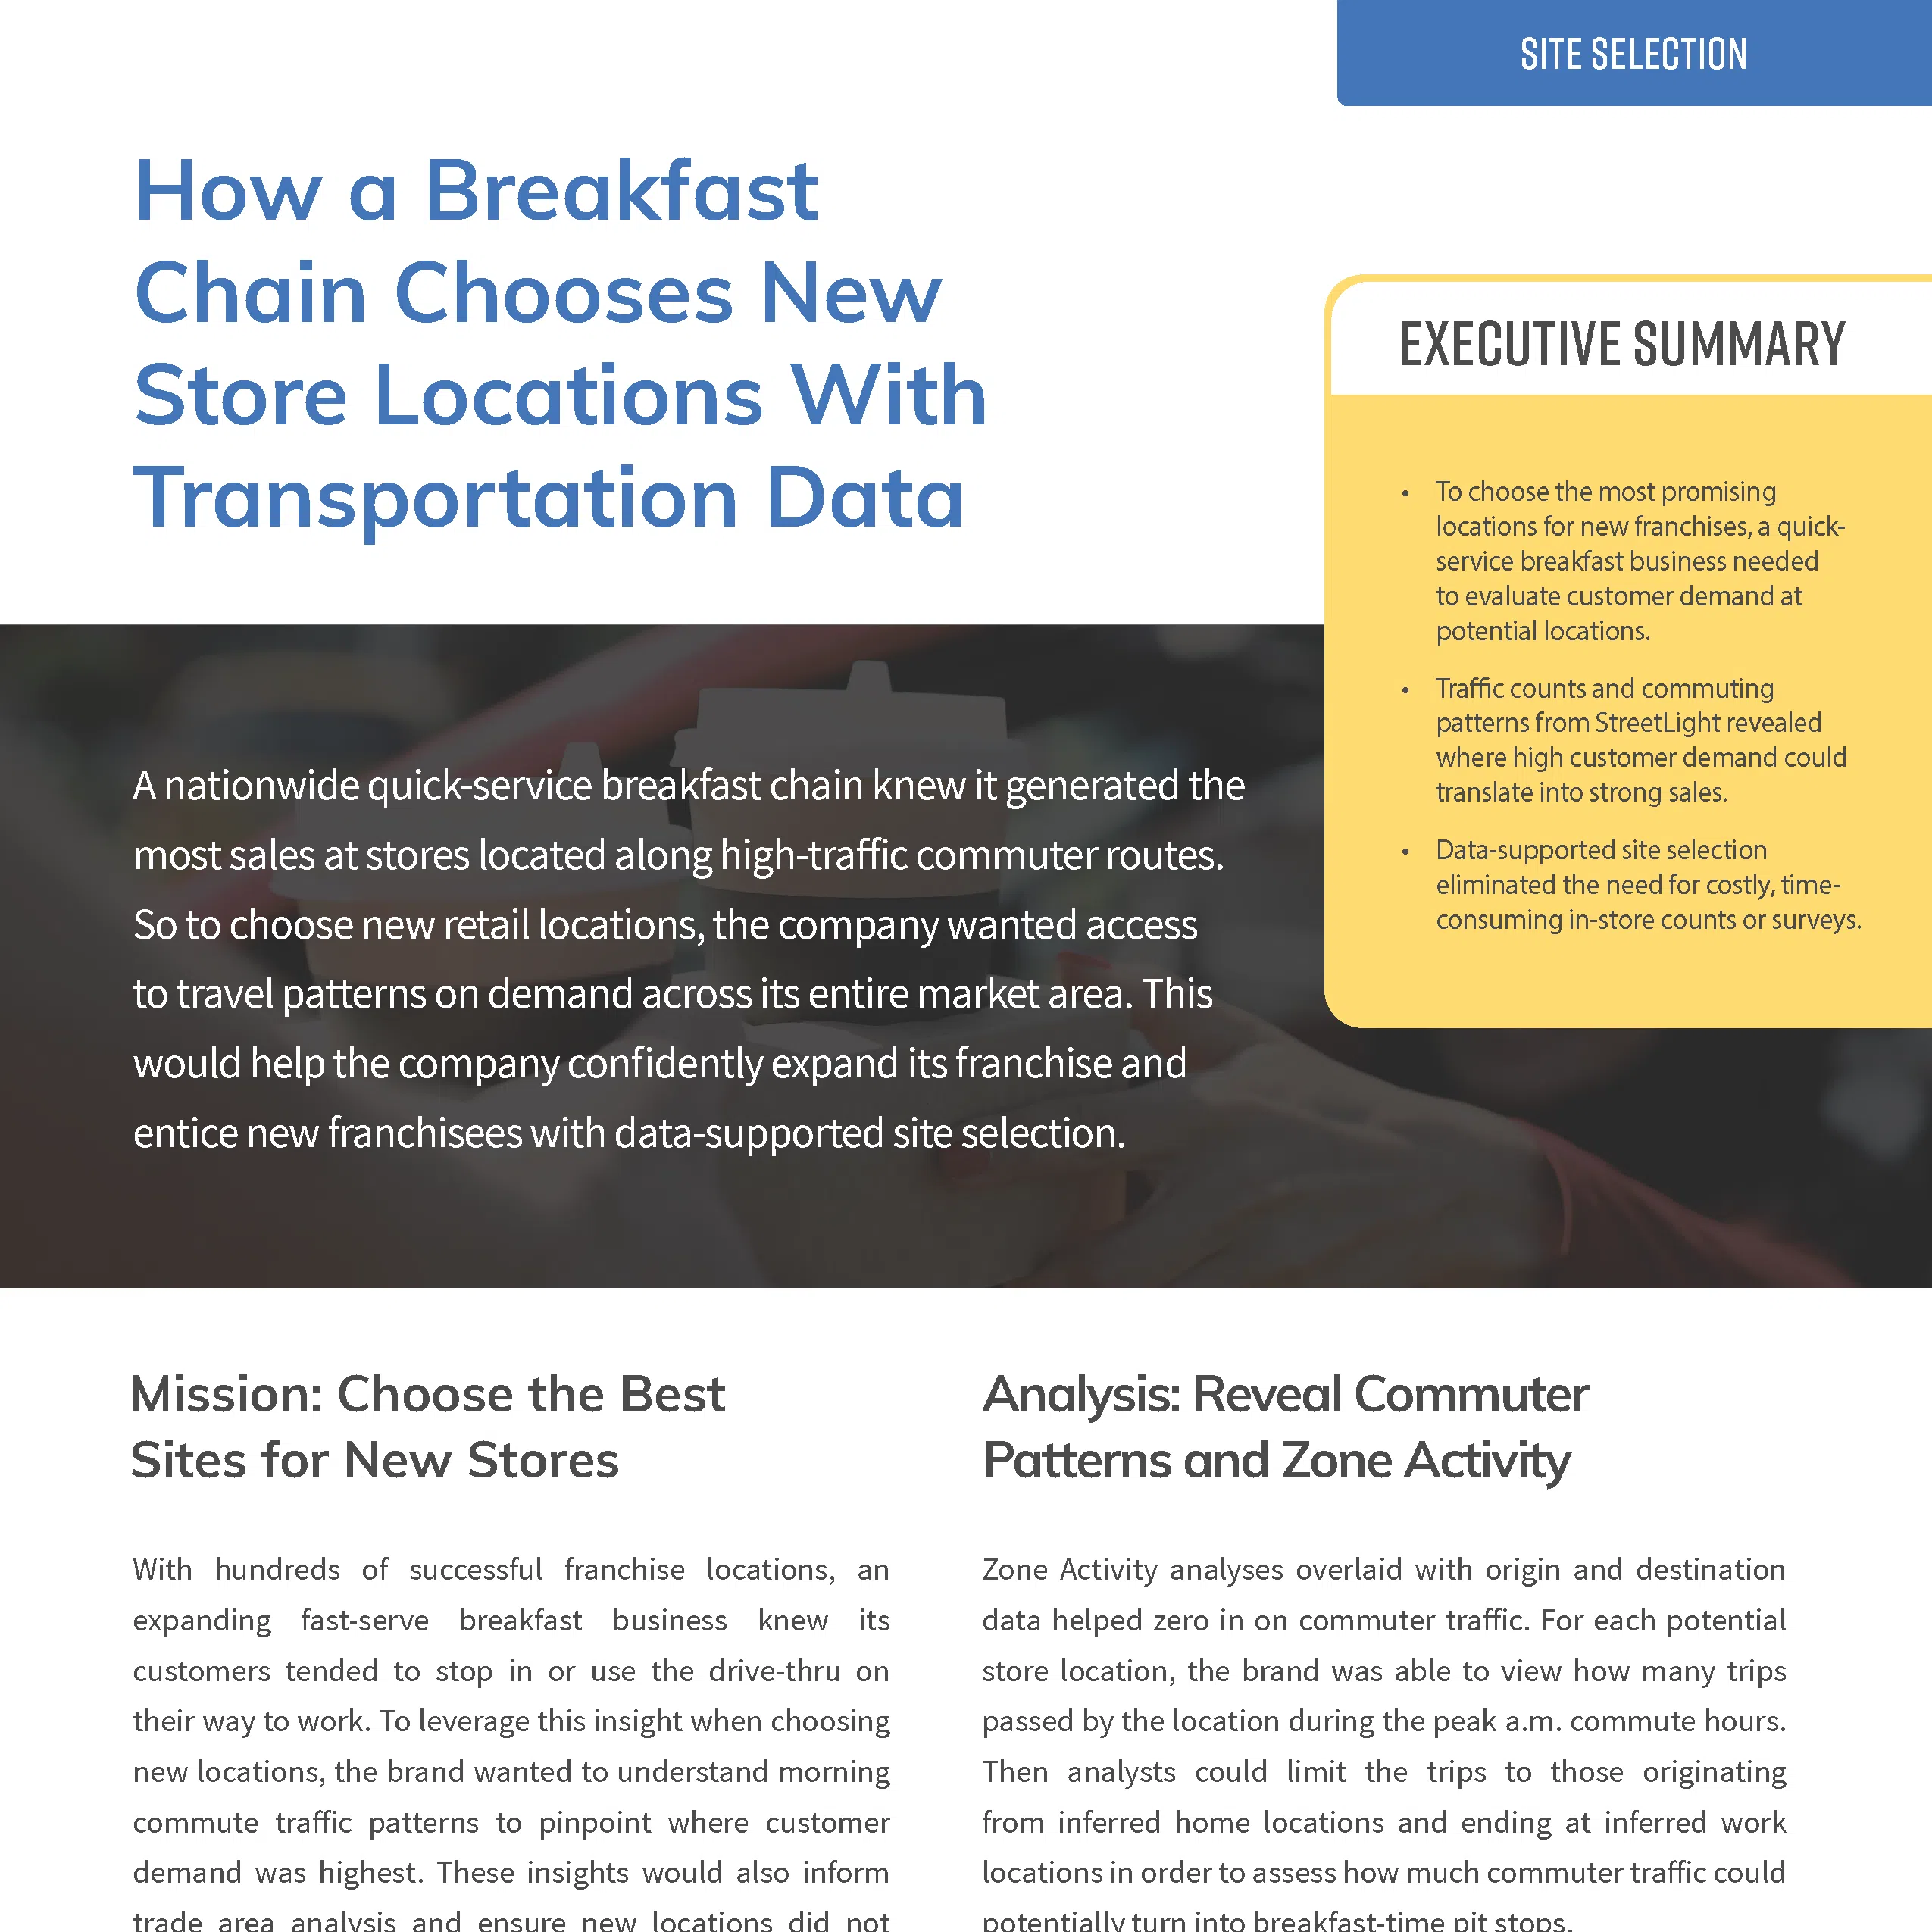
How a Breakfast Chain Chooses New Store Locations That Drive Sales
To enhance its site selection analysis, a quick-serve breakfast chain used StreetLight to map travel behaviors and choose sites along high-traffic commuter routes.
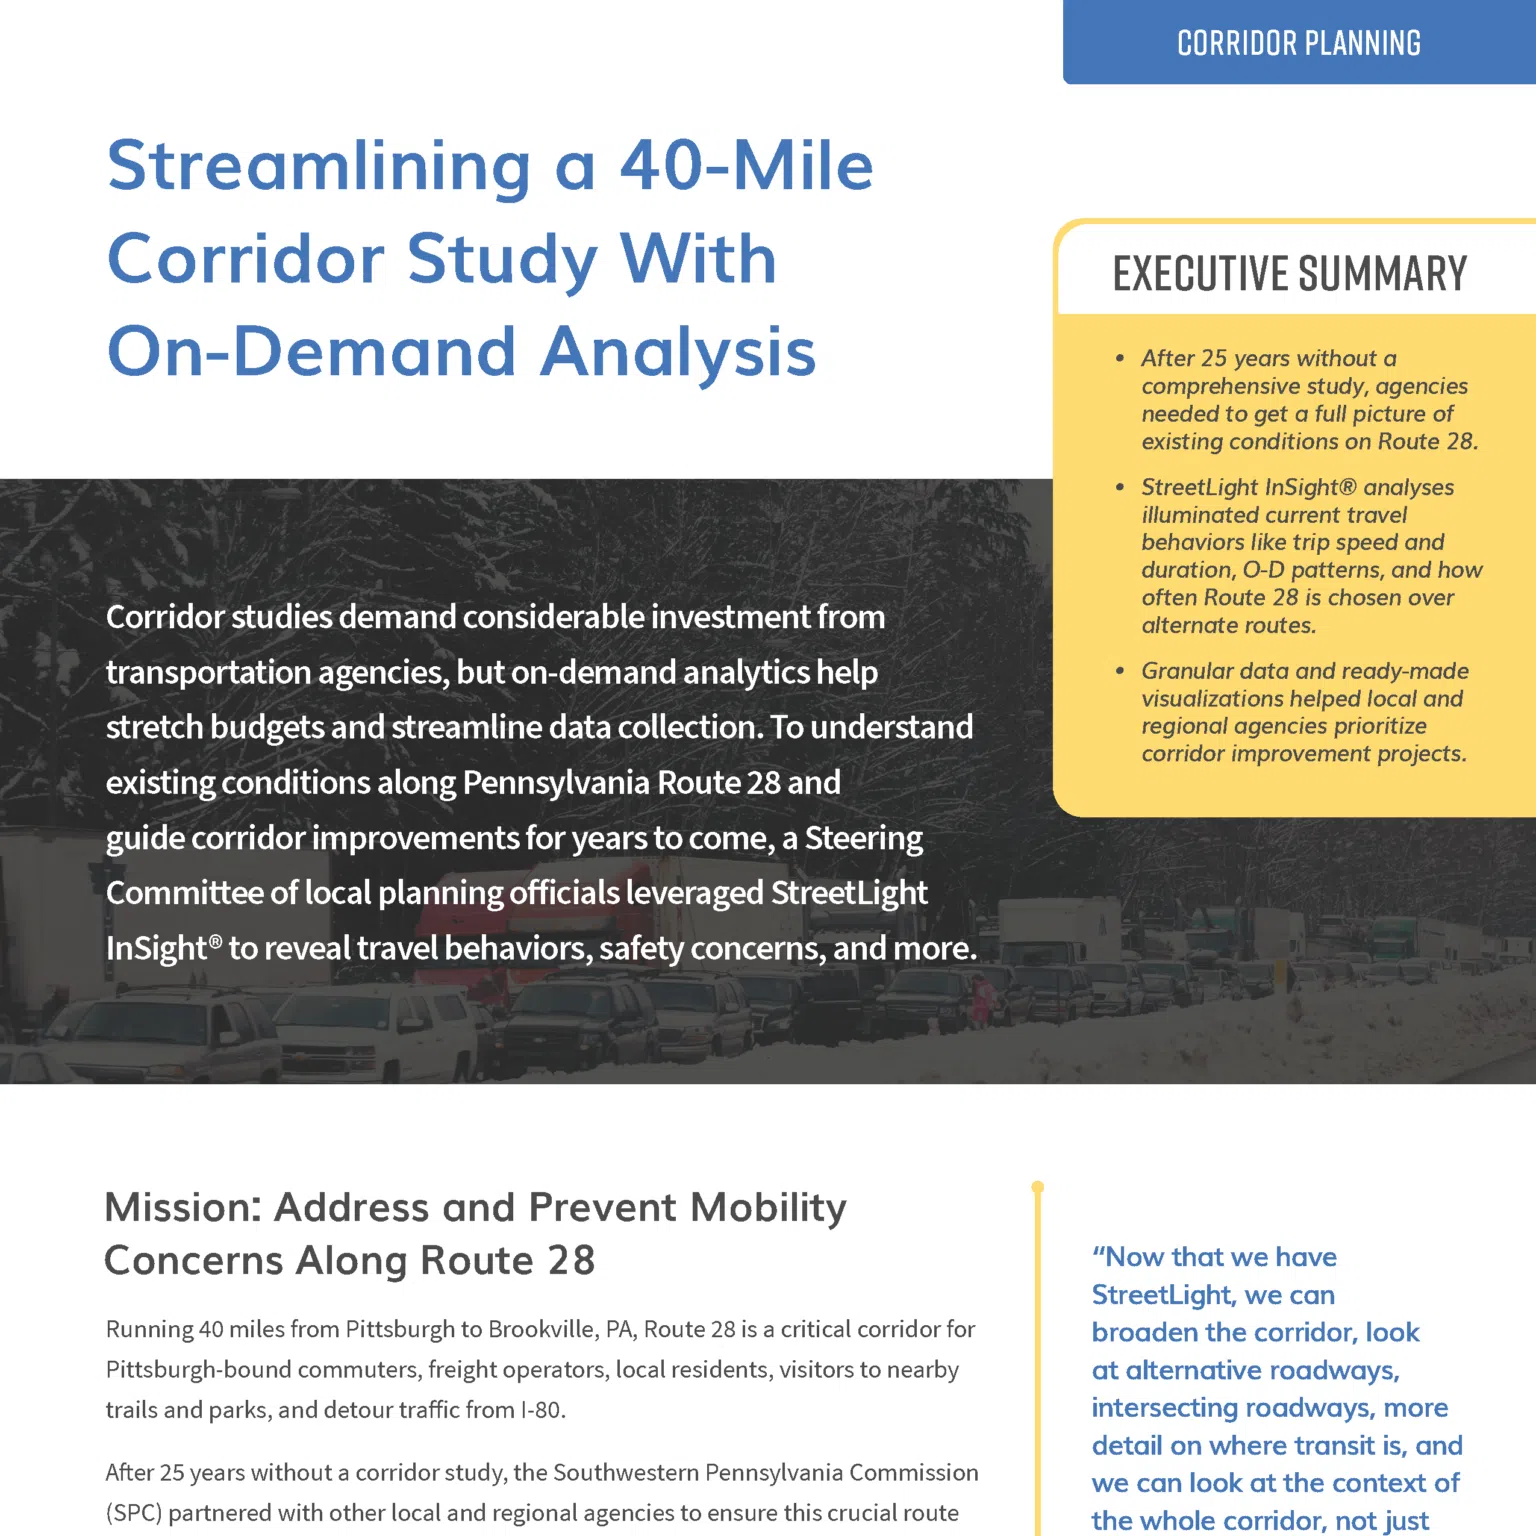
Streamlining a Corridor Study With On-Demand Traffic Data
To understand existing conditions on PA Route 28, local agencies needed to undertake a rigorous corridor study. On-demand analytics from StreetLight helped stretch their budget, streamline data collection, and widen the scope of analysis.
Who Visits & When? Big Data Sheds New Light On State & Regional Park Access
To improve park management across all Minnesota state parks, researchers used StreetLight to gather park visitation data that shed light on time trends and visitor demographics.
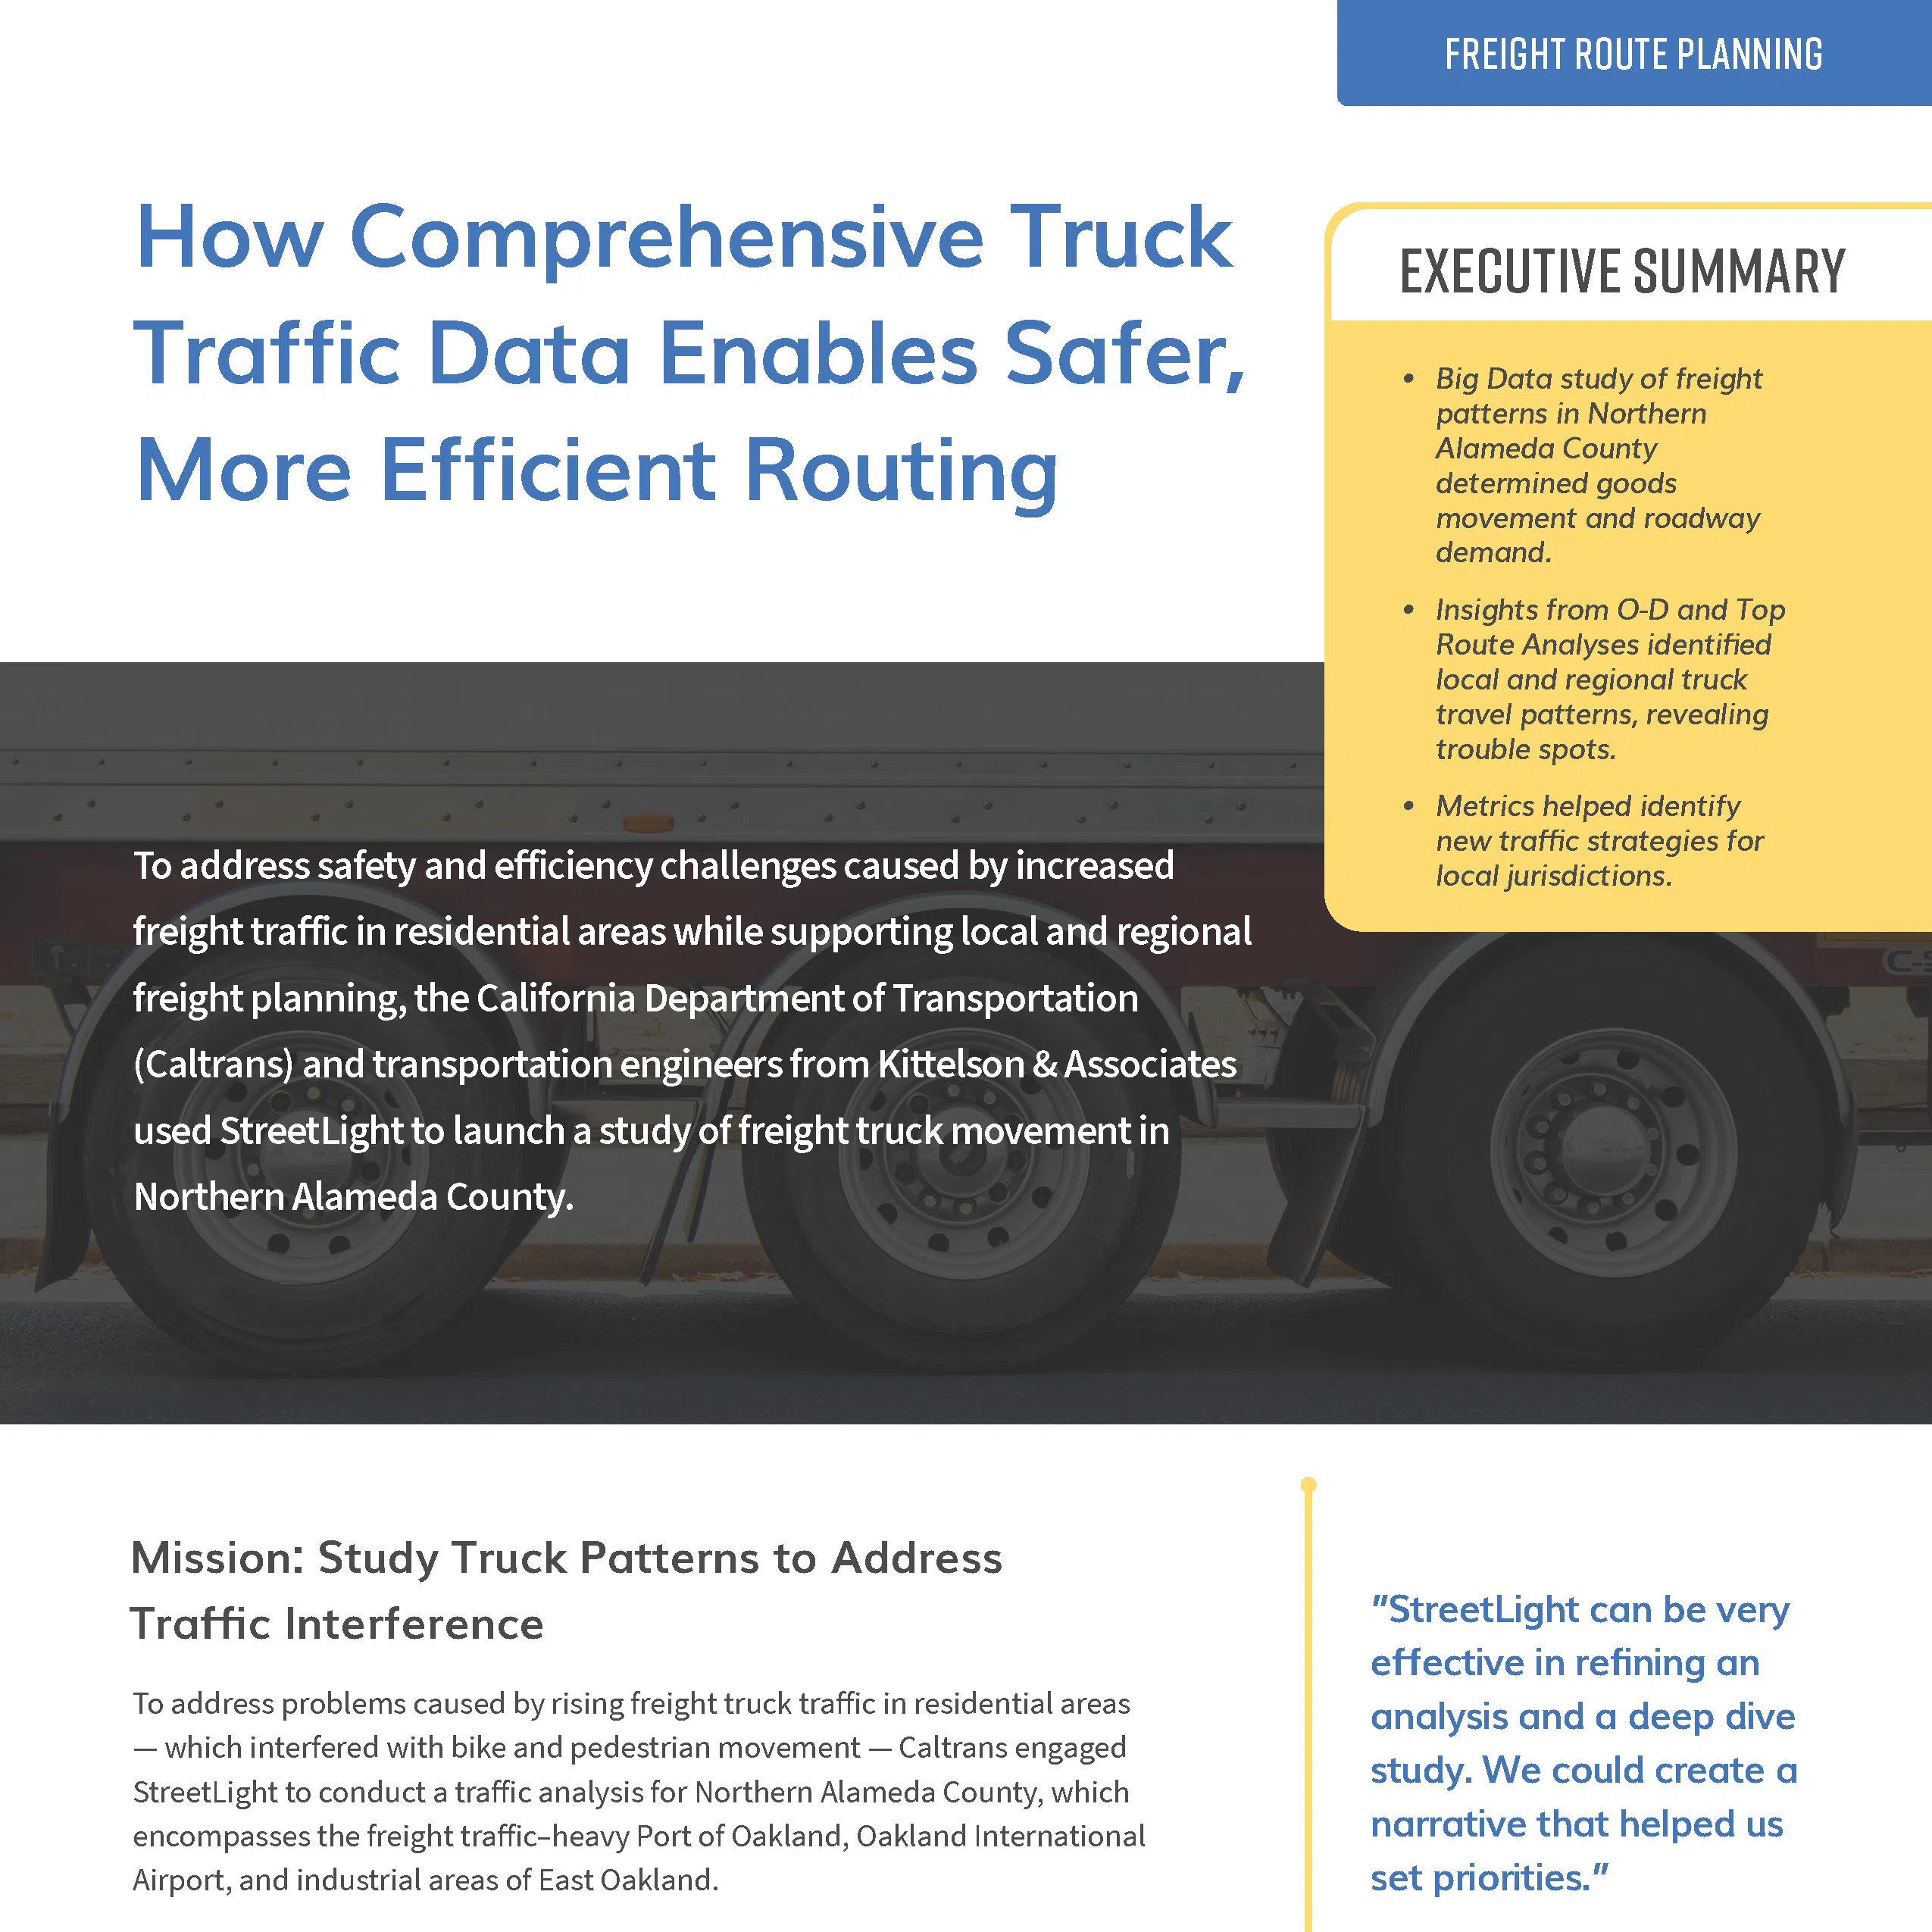
How Freight Traffic Data Enables Safer, More Efficient Truck Routing
To address issues caused by rising truck traffic in residential areas, Caltrans tapped StreetLight to analyze roadway freight traffic data in Northern Alameda County.
Using Big Data to Address Data Gaps and Validate Travel Demand Models
Learn how the City of Edmonton, Canada, used StreetLight InSight® to fill in their traffic volume data gap, validate their regional travel demand model and analyze insights to understand the changing mobility landscape.
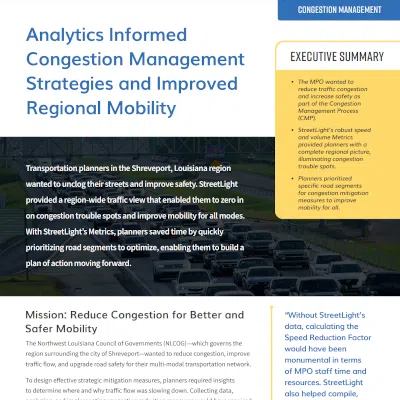
Congestion Management Analytics Help Improve Traffic Flow and Road Safety
See how transportation planners in the Shreveport, Louisiana region partnered with StreetLight, saving time and resources to plan congestion management strategies, increase safety, and improve mobility in the region.
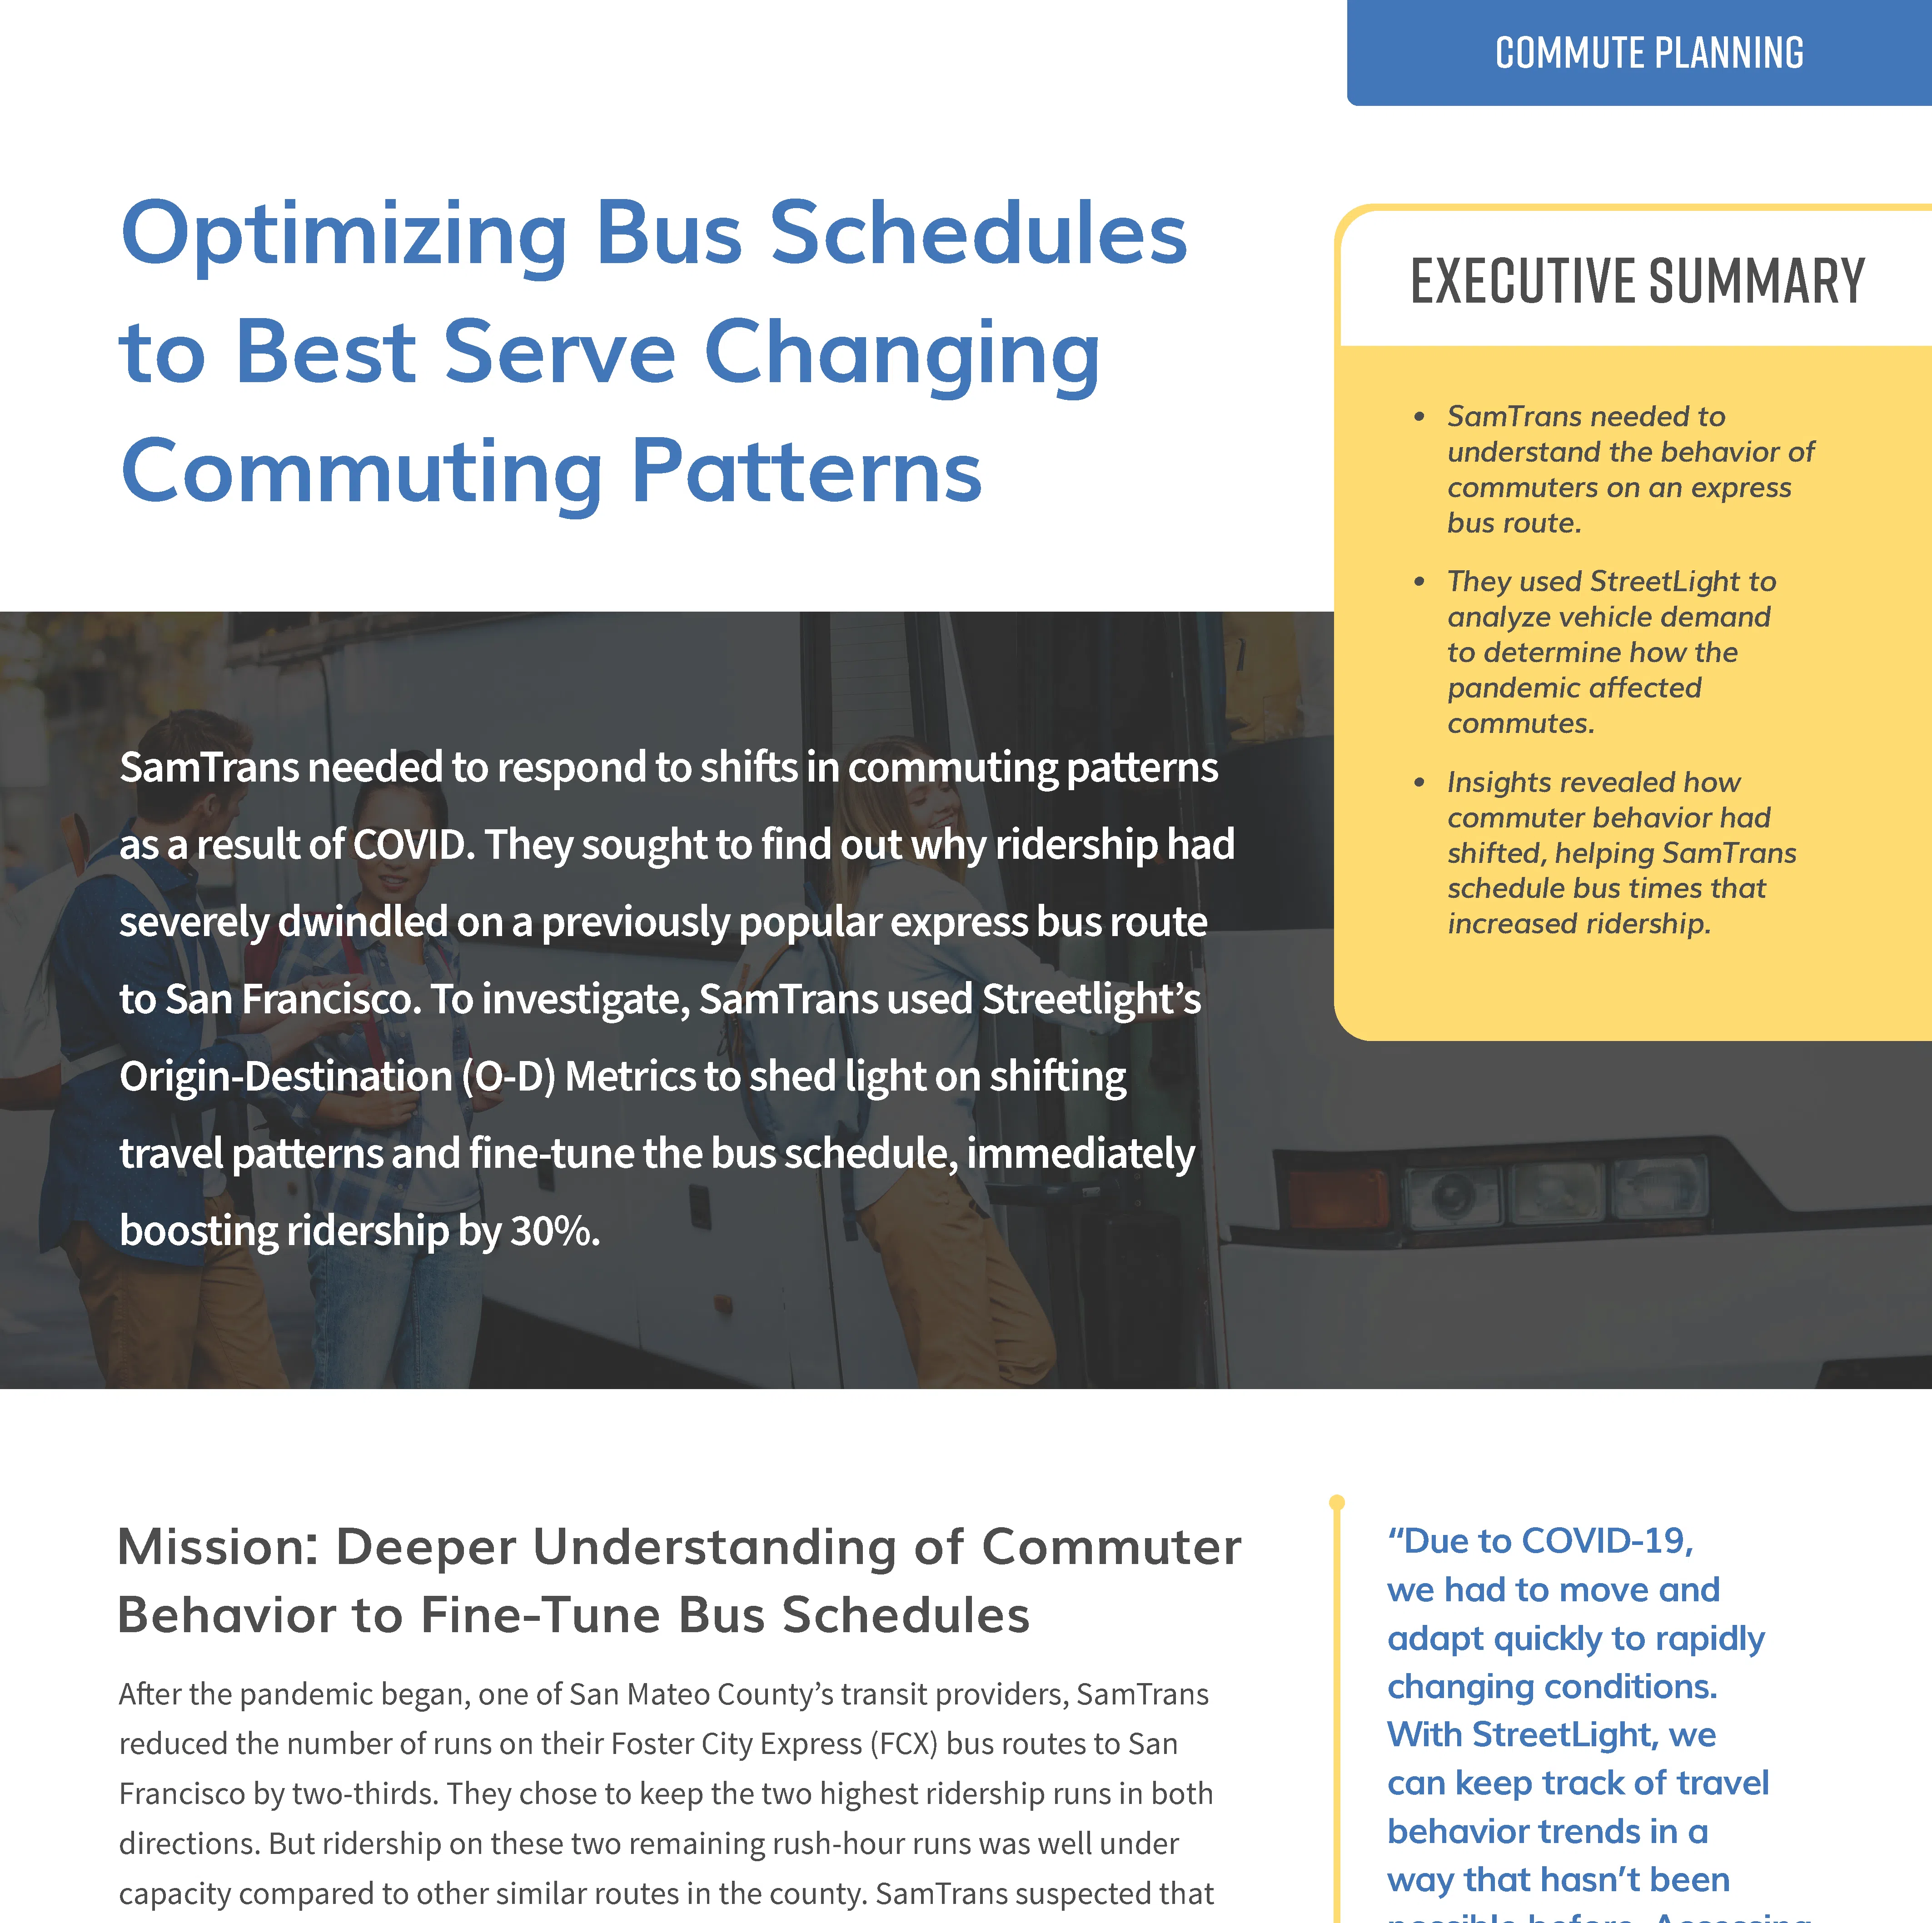
Optimizing Bus Schedules to Best Serve Changing Commuting Patterns
Learn how SamTrans used StreetLight InSight® to measure commute demand in the Bay Area to adjust bus times, leading to increased ridership.
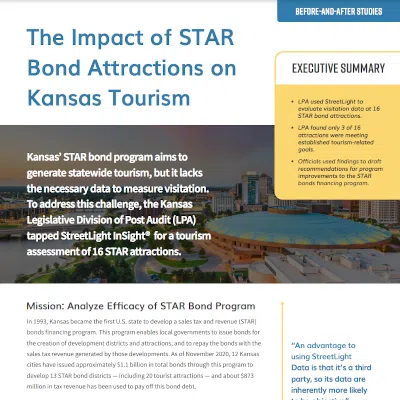
The Impact of STAR Bond Attractions on Kansas Tourism
Learn how the Kansas Legislative Division of Post Audit used StreetLight InSight® to measure before-and-after tourism visitation data at 16 state attraction sites, leading to surprising findings about the program’s success.
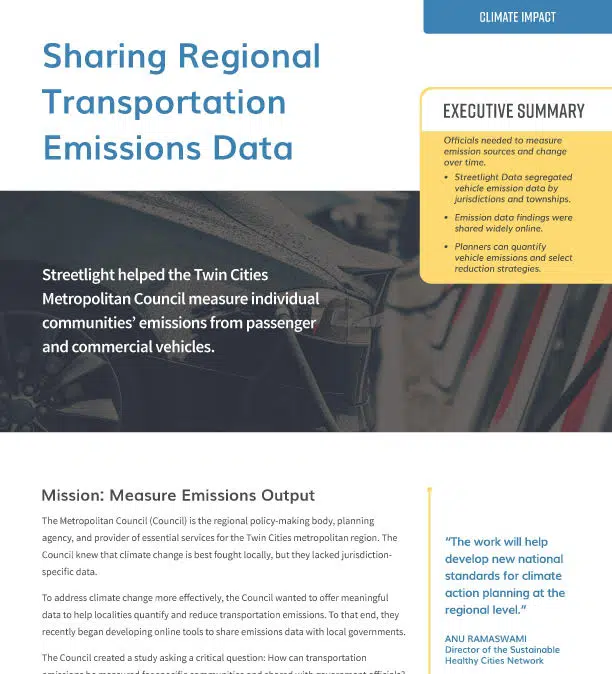
Sharing Regional Transportation Emissions Data
Learn how Streetlight helped the Twin Cities Metropolitan Council measure individual communities’ emissions from passenger and commercial vehicles.
Tulsa MPO Fills Traffic Count Gaps
When jurisdictions in an Oklahoma MPO’s regions stopped collecting counts, StreetLight provided complete and reliable AADT metrics for the entire area.
Opportunities for Equitable Mode Shift
Trading in traditional travel demand models for StreetLight’s bicycle and pedestrian data, Jacobs projected mode shift for a bike-ped bridge in Portland.
Shift Freight Modes for Truck Traffic Control
Stantec developed a truck traffic control plan along the Brooklyn-Queens Expressway to shift modes to marine vessels, reduce freight demand on the BQE, and enable other uses for the corridor
Unlimited VMT Calculations for California SB 743 Compliance
StreetLight’s Metrics offer unlimited measurements for California SB 743 compliance, while reducing cost and process time.
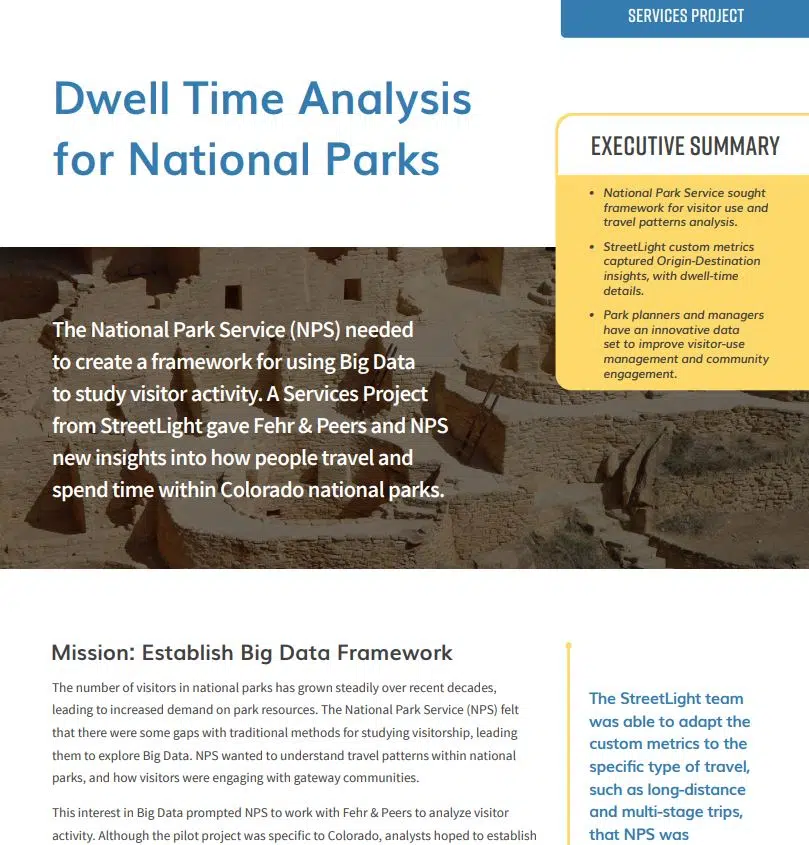
Dwell Time Analysis for National Parks
The amount of visitors in national parks has grown steadily over recent decades, leading to overcrowding. StreetLight’s dwell-time analysis helped the National Park Service better understand visitor-use management.
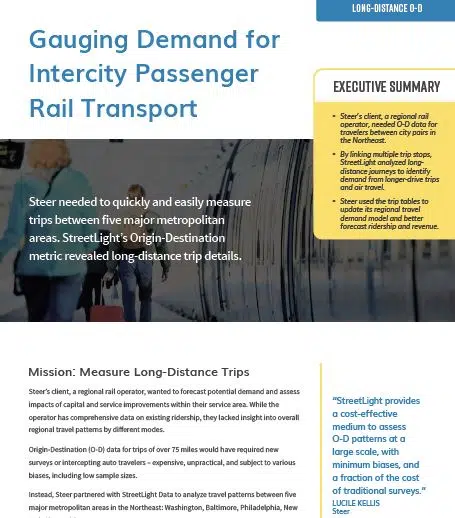
Gauging Potential Demand for Intercity Passenger Rail Transport
When a rail operator needed travel patterns between five major metropolitan areas in the Northeast to identify travel demand, StreetLight’s customized solution linked consecutive trip stops into a longer tour, using adjustable temporal thresholds.
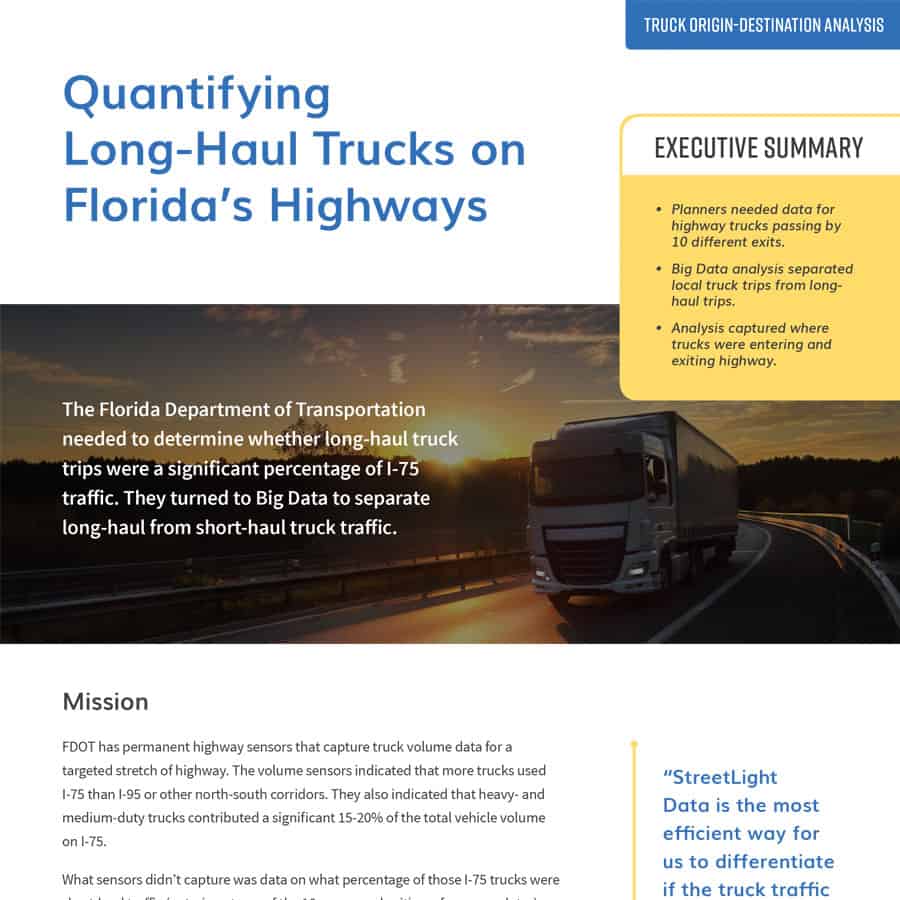
Quantifying Long Haul Trucks on Florida Highways
StreetLight identified what percentage of truck traffic was short-haul (entering or exiting at a ramp) vs long-haul (passing straight through the corridor).
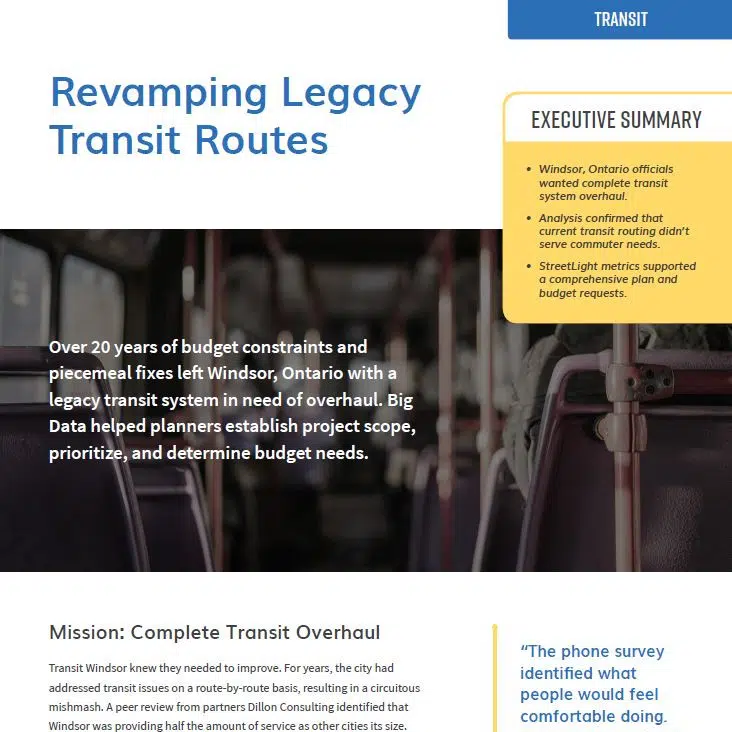
Revamping a Legacy Transit Plan in Ontario
Over 20 years of budget constraints left Windsor, Ontario with a legacy transit system in need of overhaul. Big Data helped planners establish project scope, prioritize, and determine budget needs.
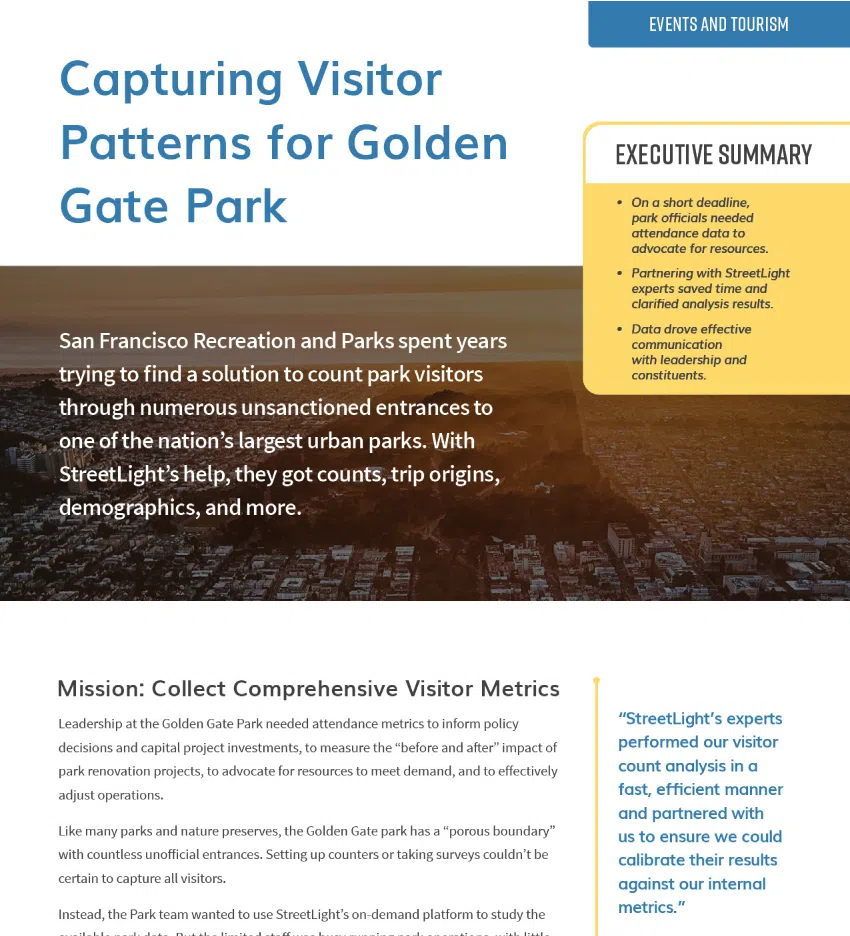
Golden Gate Park Visitor Patterns
Golden Gate Park needed to count visitors through unsanctioned entrances. With StreetLight’s help, they got counts, trip origins, demographics, and more.
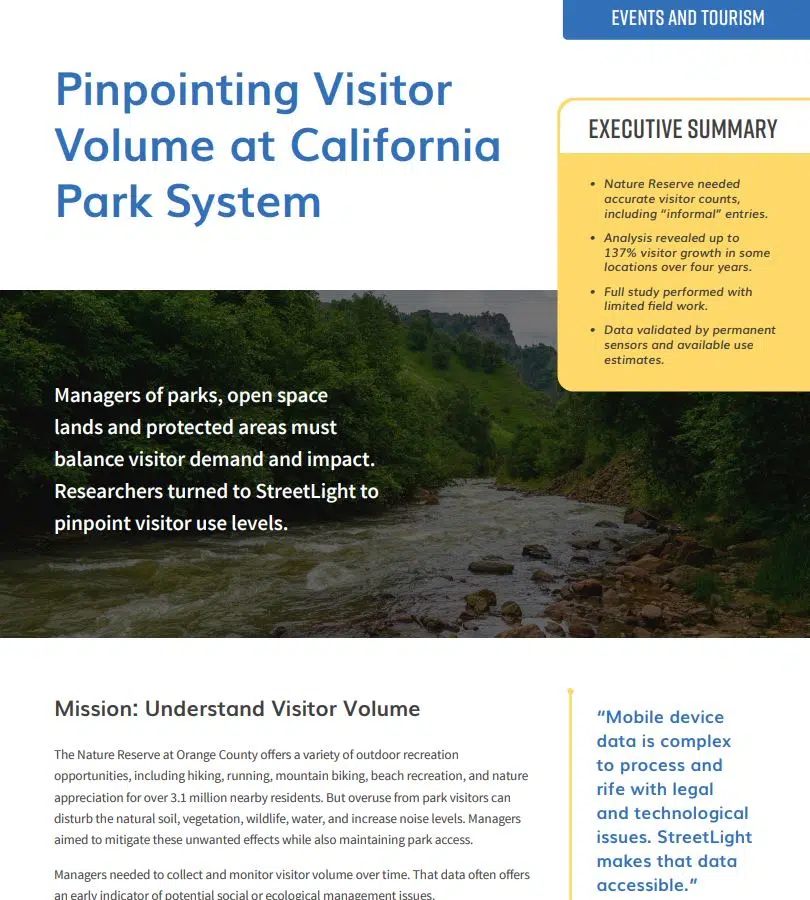
Pinpointing Visitor Volume at California Park System
To balance public access and its environmental impact, the Nature Reserve of Orange County turned to StreetLight for detailed park visitor data.
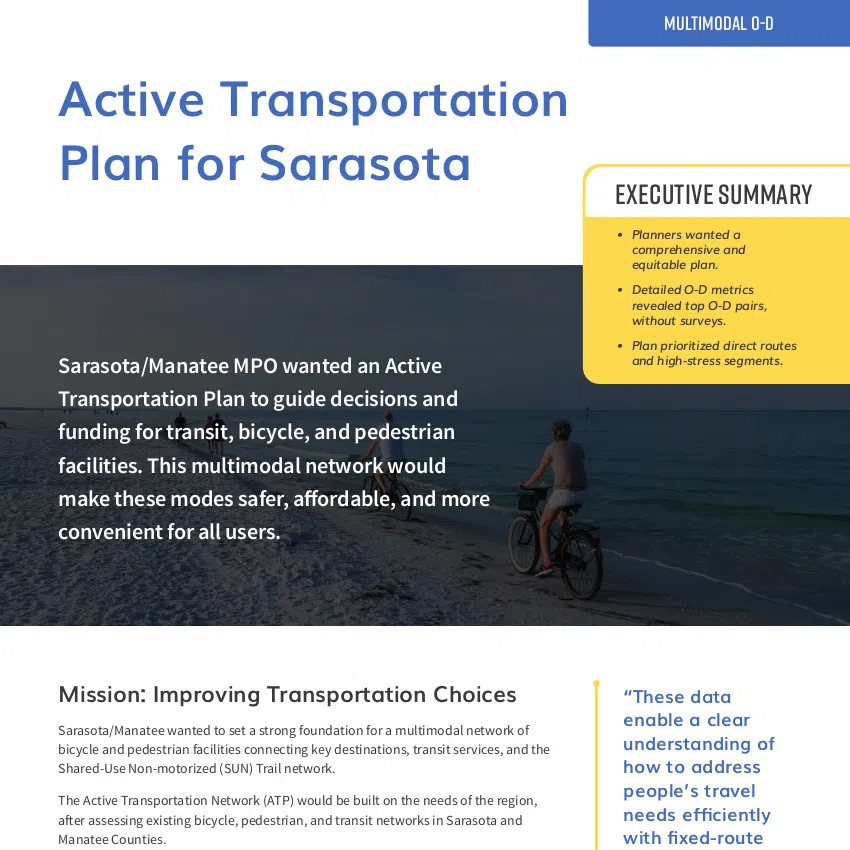
Active Transportation Plan for Sarasota
See Sarasota’s data-backed active transportation plan that guided decisions and funding for transit, bicycle, and pedestrian facilities.

Multimodal Planning in the City of Toronto
Analytics informed planning studies for “Gateway Mobility Hubs” that will provide convenient, affordable, multimodal modes and improve connections to transit options in Toronto’s outskirts.
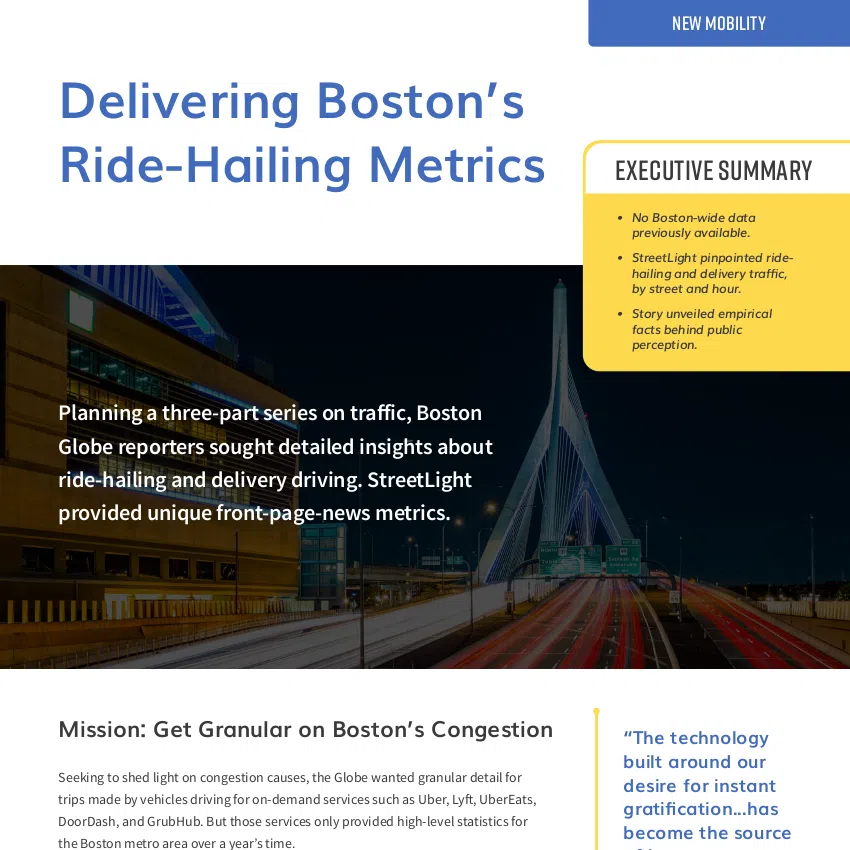
Delivering Boston’s Ride-Hailing Metrics
Learn how StreetLight’s analysis confirmed that ride-hailing vehicles contribute substantially to congestion, Download now to learn more about identifying ride-hailing and delivery travel.

Choosing Locations for Uber Air
Download our case study to learn what metrics Uber Air used to optimize site locations, how many trips per day Uber Air predicts for demand, and how many terminals it needs to meet that demand

Fast Congestion Analysis in Napa
How Napa pinpointed the cause of congestion, saved time and money, and improved bus lines for commuters.

Quantifying Cut Through Traffic Measures in a California City
See how Big Data was used to measure and communicate congestion before and after cut through restrictions.

Football Hall of Fame Projects Tourism Explosion
The Pro Football Hall of Fame projected that annual visitors would jump from 300,000 to three million. To plan transportation for this tourism boost, planners turned to Big Data StreetLight for facts about where visitors came from, traffic hot spots, and parking options.

Virginia Bike Tourism: Measuring Economic Impact
Planners knew that tourists visited the Virginia Capital Trail, but they didn’t have metrics for measuring bicycle tourism’s economic impact. They turned to Big Data for detailed information about bike and pedestrian trips.

Detailed Truck Data for Virginia’s Port
To support transportation project prioritization, ongoing studies, and federal funding applications, Port of Virginia planners needed to know which routes were commonly used by port trucking. Learn how Big Data helped solve this transportation problem.
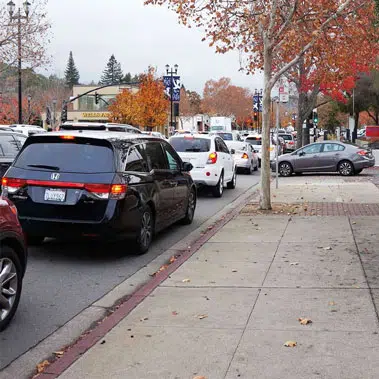
Busting Congestion with Big Data in Lafayette, CA
Helping the city prioritize policy and infrastructure to reduce congestion in downtown Lafayette.
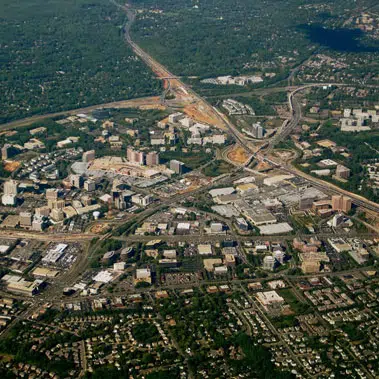
Transportation Demand Management in Virginia
Planners analyzed hundreds of congested road segments to diagnose areas where certain techniques may have the biggest impact and to guide planning.

Transportation Demand Management for Snowbowl Traffic
Flagstaff’s planners needed transportation demand management data for increasing Snowbowl traffic. See how Big Data helped.

