Complete Streets policies promote safe and equitable outcomes for all road users. Here’s how they do it, and how digital traffic data makes them more effective.
Need a transportation API that delivers rich mobility insights? StreetLight's Developer Hub makes it easy to get the data you need to make informed decisions.
Corridor studies offer crucial connectivity insights for major roadways, but they’re also time-consuming and costly. Analytics help streamline data collection and add nuance to inform corridor improvements.
Traffic congestion is making a comeback since the pandemic dip, but a 2022 analysis shows it’s not too late to address it while ensuring cities thrive.
Need comprehensive site selection analytics? StreetLight Advanced Traffic Counts offer vehicle and pedestrian Metrics for over 8 million road segments.
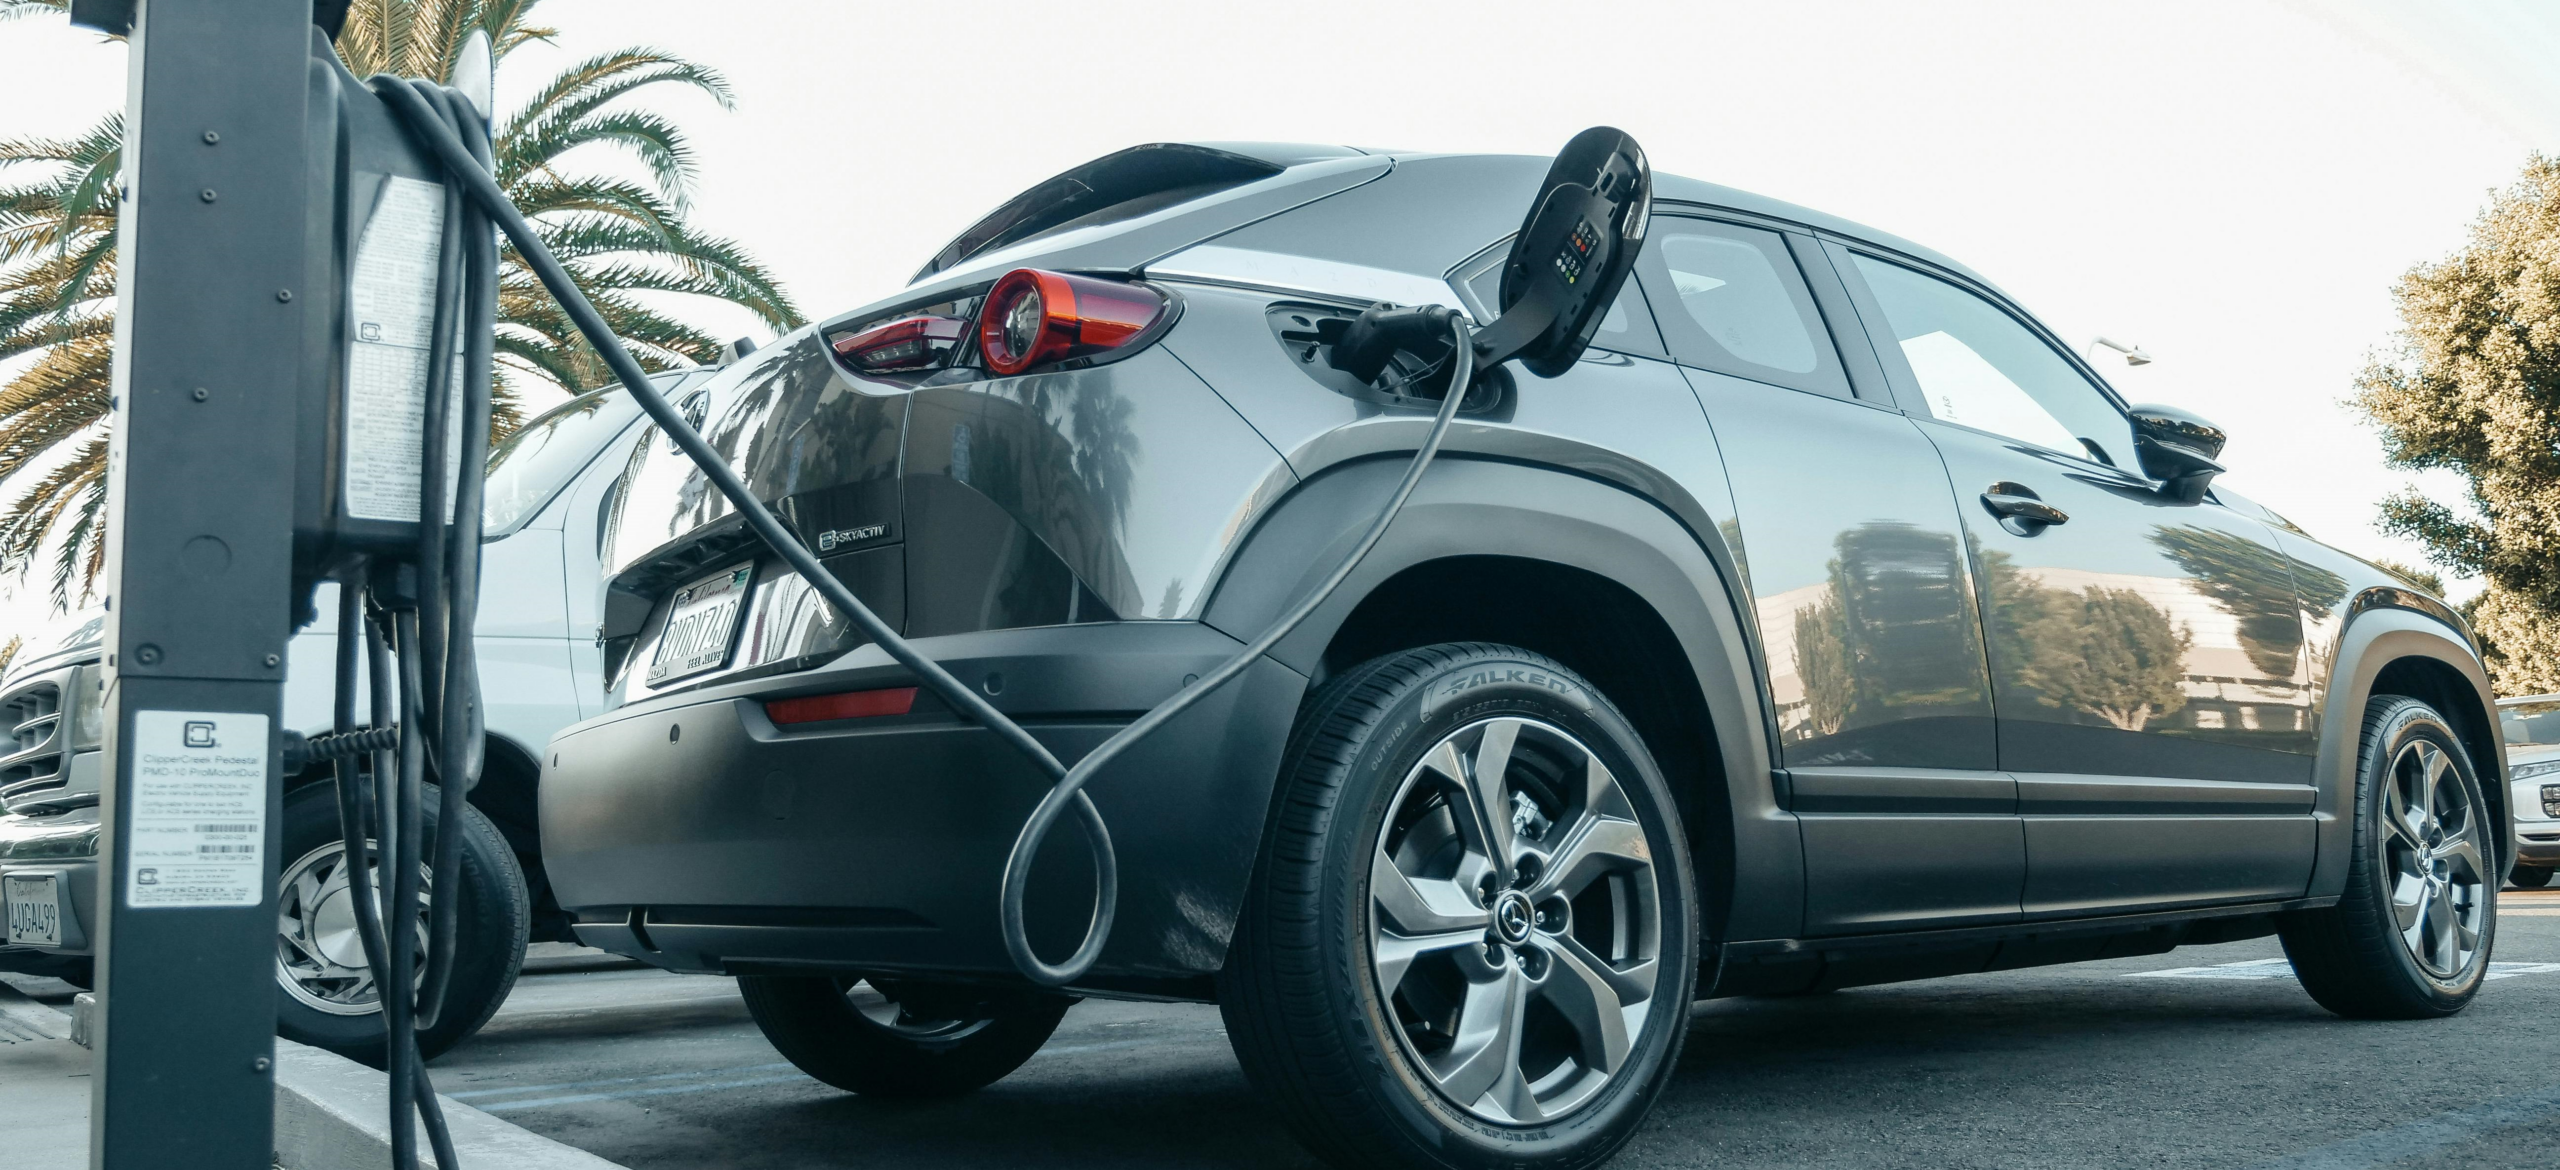
Access data that will help guide alternative fuel corridors (AFCs) and the NEVI funding proposal for your state. Support reliable and equitable statewide and national EV networks.
Agencies and consultants used StreetLight InSight to analyze travel behavior of disadvantaged populations and empower agencies to address public health issues like infant mortality.
TRB 2022 thought leadership on topics of boosting equitable transportation, improving road safety and deploying EV infrastructure to meet growing demand.
UC Davis transportation students used StreetLight Metrics to analyze traveler sociodemographics, trip volume, speed, and duration changes by travel mode in and around campus.
StreetLight’s Turning Movement Count (TMC) Metrics save transportation engineers and planners time without putting sensor-deploying staff in harm’s way, or relying on outdated equipment.
Redesigning the Brooklyn-Queens Expressway (BQE) in New York, Stantec’s team imagined a stepwise approach to shift freight and passenger travel modes while reclaiming space for the community.
How to strengthen your organization’s data culture to ensure your team gets more insights, improves cross-functional relationships, and maximizes cost-to-benefit ratios.
How we can make the Bipartisan Infrastructure Framework more successful: Require lawmakers to prioritize accountability when it comes to spending taxpayer dollars.
Connected vehicle data includes “near miss” indicators including harsh braking, harsh acceleration, and hard cornering. Combining that with transportation metrics offers fresh insights on vehicle safety.
See how to target the highest-exposure areas for bike safety improvements. This type of analysis can help cities and states invest wisely in bicycle safety through infrastructure planning that has the most impact.
Before we fund the $2 billion transportation infrastructure bill we must guarantee that our tax dollars achieve the intended goal. Here is how agencies can predict impact and measure before-and-after results.
Transportation planners have speculated that work-from-home policies could positively affect climate change by reducing emissions. We analyze this tempting alternative to infrastructure or policy changes
Analyzing transportation risk in Orlando, FL for pedestrians reveals that at least one suburban zone has 19x higher risk than downtown, even though crash rates are similar.
Shared automated electric vehicles (SAEV) could combine the safety and convenience of self-driving cars, the efficiency of shared mobility, and the sustainability of EVs. This analysis evaluates requirements and impact.
Where did people relocate in 2020? StreetLight’s custom analysis shows the top city pairs that people moved from and to, revealing that those who moved during the pandemic sized down.
Visitorship seemed like it was increasing at Pocahontas State Park, Virginia’s top mountain biking destination. But what were the numbers, and where were visitors coming from? It only took a few hours in the StreetLight InSight ® software platform to find out, and the results surprised me.
StreetLight now offers stronger support to those researching transit’s past and planning for its future. Learn about our on-demand Bus and Rail Metrics for the U.S. and Canada, now included in our Multimode subscription.
Learn how to analyze where traffic actually detours compared to suggested routes, and how that impacts aging bridges across this section of the Mississippi River.
From “business as usual” planning to measuring COVID-19’s effects on transportation, here are some examples of the great work transportation planners were able to achieve in 2020.
Nick Lepp, Director of Transportation Planning at MetroPlan Orlando, explains how his team leverages their investment in Big Data analytics by sharing it with other agencies.
Department of Transportation budget uncertainty was on everyone’s mind at our annual StreetLight Summit. StreetLight “power users” discuss high-value ways to use big data analytics.
Traffic congestion in major urban areas is shifting, post-COVID. Our analysis of rush-hour traffic shows that while total miles driven are back to pre-COVID levels, when and where trips occur is quite different.
The Greater Madison MPO maximizes efficiency by quickly and easily running analyses to rule out dead-end transportation projects, and better optimize resources.
Sample size is key for data collection projects in transportation. In this post, we explore how we evaluated our sample size for commercial vehicles in CA.
To understand (and predict) how work-from-home policies impact vehicle miles traveled statistics, we analyzed how commutes changed in 2020 for Seattle’s four largest employers.
Taylor Emerson, Manager of Strategic Planning for the San Francisco Recreation and Park Department, explains how she uses LBS data to advocate for her park system.
How to adapt short- and long-term transportation planning amid current uncertainty. You can still chart a path with so many factors outside your control.
In the time of Corona, the bicycle became a more important travel option than driving. Read our analysis to see where cycling and driving shifted during May.
Panini Chowdhury of the Brooke Hancock Jefferson Metropolitan Planning Commission analyses changing travel in West Virginia and Jefferson County, Ohio.
BCG used StreetLight’s vehicle miles traveled statistics to create a Trip Reduction Index, measuring stay-at-home policies in each state, county, and MSA.
We at StreetLight have been paying close attention to the COVID-19 pandemic, and our hearts go out to all affected. We are working hard to navigate this unchartered road, and we will do it together - as a team, and with our customers.
With cycling fatalities on the rise, bike riding doesn’t feel very safe right now. These are the ways I hope Big Data can help planners make a safer future.
At StreetLight, we know how important shopping malls are for our communities, and we can help collect the statistics modern malls need to thrive. Read our analysis to learn more.
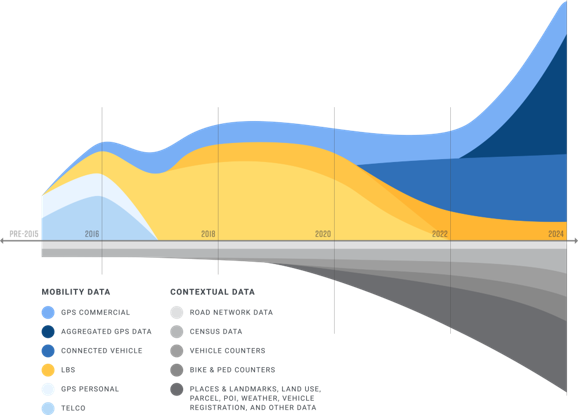
By fusing permanent IoT transportation sensors with our mobile data resources (and some excellent data science) we can provide data for activity on every road, sidewalk, bikelane, and neighborhood.
One of the world’s most sparsely populated countries, Canada can’t always rely on traffic counters for collecting vehicle trip data, especially on rural roads. Learn why our AADT Canada metrics are fast, easy, and more affordable than traditional traffic counters.
Visitorship seemed like it was increasing at Pocahontas State Park, Virginia’s top mountain biking destination. But what were the numbers, and where were visitors coming from? It only took a few hours in the StreetLight InSight ® software platform to find out, and the results surprised me.
Jason’s Law affects truck parking in every state, but how can you determine the optimal parking options? Fehr & Peers and StreetLight Data teamed up to study truck parking options on the I-5 corridor in California’s Central Valley. Our results can help DOTs increase highway safety for all drivers.
Truck traffic creates the most road wear, but what’s the best way to accurately measure truck traffic? That’s where Big Data comes in. GPS data can pinpoint trip origin, destination, route, duration, and more. Traditional truck traffic measurement just can't keep up.
For growing metro areas like Atlanta, congestion pricing is a hot topic. Since I live and work in Atlanta, and also happen to work for a company that uses Big Data for transportation analytics, I ran my own sample study on Atlanta’s congestion. Here’s what I learned.
With the right support and infrastructure, bikes can extend access to and from other modes like transit, and even boost overall transit ridership. See what the city of Dallas recently learned in this bike commuting analysis.
Looking for better ways to evaluate and manage vehicle emissions this Earth Day? Use Big Data to quickly and efficiently measure your area’s VMT, and plan for expanded EV infrastructure.
Looking for ride hailing services data? That’s a challenge in a business where no data exists outside of a few dominant companies like Lyft and Uber who don’t share. Fortunately, Big Data has answers.
Big Data is a critical tool for transportation, but we must make sure that privacy is protected. Here is how we deliver the analytics required to solve the overwhelming transportation challenges confronting our communities, in a way that protects consumer privacy.
If your transportation department has not started planning for the backyard poultry trend, now is the time to start, with StreetLight’s new Poultry In Motion metrics.
A higher sample size yields better results. That’s why we’ve doubled our typical sample size since last month, and more than quadrupled it since last year. This reflects general growth in new devices and new apps in our supply chain.
Experienced planner and former competitive cyclist Sean Co guides our clients using Big Data metrics for bike-ped applications. We talked with Sean about his bike racing background, the power of bike-ped metrics, and what fuels his passion for active transportation.
The "Waze Effect" of drivers cutting through local streets to avoid congestion on major roads is hitting communities across the world. Find out how Big Data can help cities fight back by following four simple steps.educe the space.
Interested in innovative data visualization techniques? Find out why we're inspired by chord diagrams and discover 5 of our favorite examples in this blog article.
Where do people take rest stops when they travel on I-95? Learn how Big Data analytics for transportation anonymously describes the travel patterns of visitors to rest stops along the East Coast, including traffic volumes, trip destinations, and trip lengths.
In many areas, multimodal travel is easier and more efficient than ever. Explore what multimodal travel behavior means for transportation planners by learning why Catherine Manzo of StreetLight Data used seven different modes of travel on a recent cross-country trip.
Find out how transportation engineers from Acradis used real-world transportation analytics from geospatial Big Data for infrastructure planning and public engagement. Our blog article details three unique bridge-focused case studies from Louisiana.
StreetLight Data launched its Multimodal Measurement Initiative to measure all modes of travel and how they interact. We're looking for partners to join our Working Group as we finalize analytics for modes including bike, pedestrian, and even "the gig economy."
Regional Measure 3, a ballot initiative, would increase tolls on all Bay Area bridges. I used the transportation analytics platform StreetLight InSight® to get a better understanding of the equity implications of the toll increase.
Discover the how the new Traffic Diagnostics tool from StreetLight Data can help transportation planers, modelers, and engineers use Big Data to identify causes of congestion, the best travel demand solutions for specific traffic jams, and high potential active transportation opportunities across an entire city.
Find out why Uber is using StreetLight Data's analytics to help plan UberAIR, a brand-new aerial urban transportation mode that promises to revolutionize the way people travel.
Do you have a long commute? Explore this article on factors that impact commutes, and the solutions available for urban planners to address this challenge.
Transportation isn't just about traveling from place to place. It has broad socioeconomic impacts. The right traffic data can reveal these complex linkages.
Not sure how a construction project will affect travel patterns? Improve detour planning and identify the most efficient alternative routes with Big Data.
Self-driving cars, or automate vehicles, are close to technical feasibility. But are we ready to manage all aspects of their deployment? How can data help?
We used Location-Based Services data to measure Labor Day travel patterns - and found out how many American workers are commuting during this public holiday.
Transportation isn't just about traveling from place to place. It has broad socioeconomic impacts. The right traffic data can reveal these complex linkages.
A few data-driven tactics for reducing congestion misery on I-85 in Atlanta. We hope that this analysis will be useful for detour management in Atlanta in the coming months.
Is the lack of quality mobility data hurting your urban transportation planning? Use the right data analytics tools to get the real-world data you need.
We need more than stationary sensors to plan cities that are truly smart. Using Big Data for transportation planning can help cities solve mobility challenges.
How representative are Location-Based Services data that are created by smart phone apps? Find out how we evaluate our Big Data sample to ensure our analytics are truly representative.
How much of an impact did President Trump have on Fifth Avenue traffic in November 2016? We quantified jams in November using Big Data for transportation.
Limited budgets and inaccurate forecasting are common problems transportation planners face. Solve them with the right tools for transportation data collection.
Big Data can simplify detour planning by providing comprehensive origin-destination and select link analyses, including transportation data on external trips.
We use cookies to improve site functionality and provide you with a better browsing experience. To find out more about what information we collect and how we use it, you can read more here. By continuing to use this site you are agreeing to our use of cookies.