
Public Data from NYCDOT Validates the Reliability of StreetLight’s Speed Metrics

Access to accurate vehicle speed data is critical for effective road safety interventions, congestion mitigation, and more. We compared StreetLight’s speed metrics to data from New York City’s OpenData portal to ensure we’re delivering the most reliable insights.
To collect data on vehicle speeds, many agencies rely on permanent roadway sensors, speed cameras, or manual speed studies. But tight budgets and project timelines prevent the installation of sensors on every road, and manual studies only capture a small snapshot of roadway conditions, while also putting workers at risk.
Meanwhile, businesses and firms may not have access to the already limited speed data that is available via these methods, limiting their ability to make informed decisions about real estate, traffic operations, or events management.
For these and other reasons, many agencies, firms, and businesses turn to analytics platforms like StreetLight that leverage a big data approach to deliver vehicle speed metrics for any road, at any time. But when sourcing your data, it’s important to understand how reliable it is compared to more traditional ground truth methods.
Thanks to the City of New York’s OpenData portal, with publicly available vehicle speed data provided by NYCDOT, we were able to perform a validation of StreetLight’s speed data against New York City’s documented speeds. We’ll explain how our speed data is collected, how it compares to NYCDOT’s data, and what that means for your own vehicle speed analyses.
How NYCDOT Collects Speed Data
The speed data available in NYC’s OpenData portal is collected through E-ZPass readers located on approximately 110 road segments throughout the city. Vehicle speeds are calculated based on the travel time and distance between two E-ZPass readers.
This approach captures average vehicle speed in real time, and the portal is updated with the most recent data several times per day.1
How StreetLight Collects Speed Data
StreetLight’s Vehicle Speed metrics are derived from Aggregated GPS Data, which includes data from a blend of device navigation apps, traditional mobile data apps, and in-vehicle navigation apps.
This method has the advantage of strong penetration rates across various road sizes and regions for a highly representative sample, even on rural and lower-volume roads. StreetLight’s sample penetration rate averaged 27% nationally in 2023 and was observed as high as 40%+ in some locations.
To develop segment-level speed metrics, StreetLight maps this data onto the StreetLight InSight® Zone Library, derived from OpenStreetMap (OSM). Based on the length of the segment and how long it takes a vehicle to travel from one end to the other, we estimate the average vehicle speed along that segment.
For more information on how StreetLight collects, aggregates, and validates our vehicle speed metrics, you can download this white paper. To integrate speed and volume data into your own platforms, check out our Traffic Data API.
Comparing the Data: How Accurate Are StreetLight’s Speed Metrics?
To ensure an apples-to-apples comparison, StreetLight analysts first cleaned the NYCDOT data, removing certain obviously incorrect datapoints that may have been caused by malfunctioning E-ZPass readers. Next, the cleaned NYCDOT data was aggregated such that the mean speed could be calculated per segment by day of week and hour of day.
Using StreetLight’s Network Performance analysis, analysts obtained the average speeds of groups of OSM segments that aligned with NYCDOT’s segments, looking at data for October 2023. This allowed for a close comparison between StreetLight and NYCDOT average speeds on 11 NYCDOT segments.
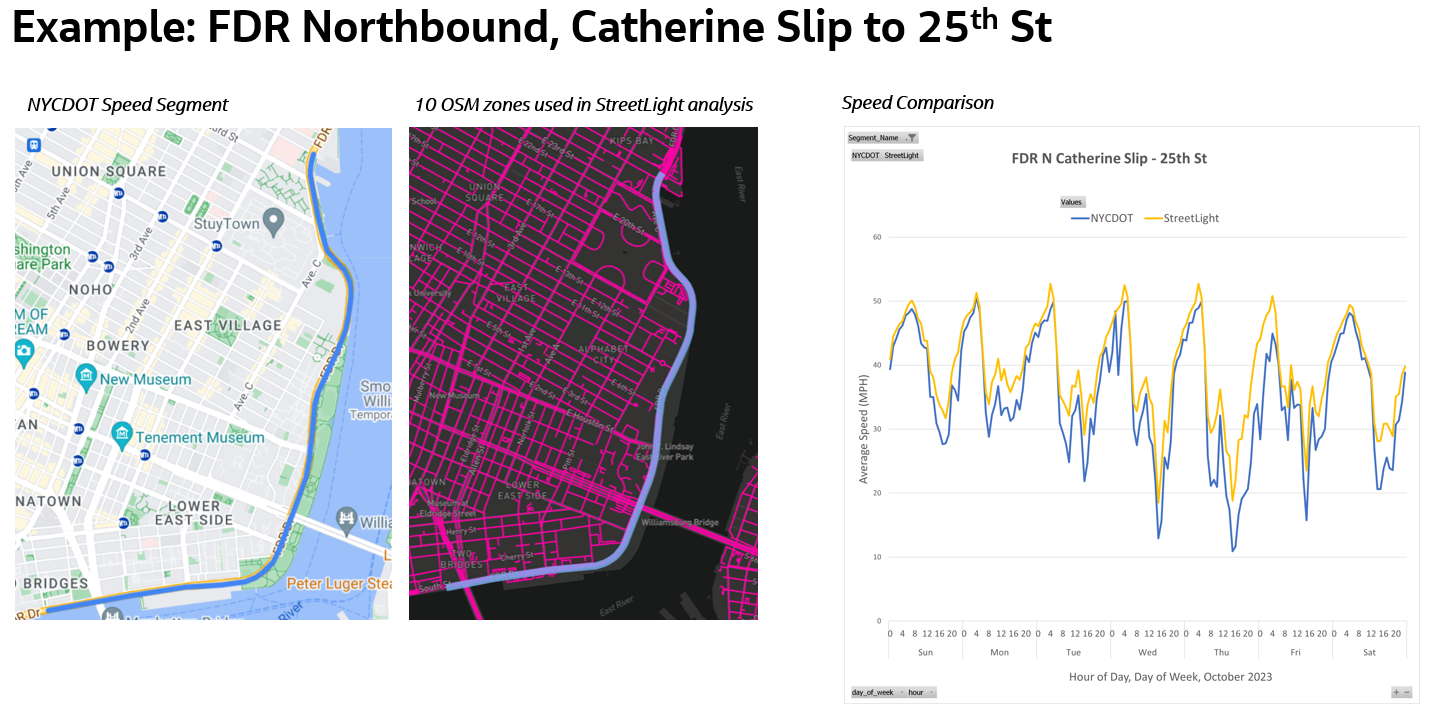
In this example comparison for a portion of FDR Drive Northbound, analysts averaged vehicle speeds from 10 StreetLight OSM zones (middle) aligned to the corresponding NYCDOT segment (left). On the right, NYCDOT speeds by day and time are marked with a blue line, while StreetLight speeds are marked in yellow.
Because StreetLight’s OSM-based segments do not have a one-to-one correspondence with NYCDOT’s segments (which are derived based on the distance between E-ZPass readers), special care was taken to align StreetLight segments with those used by NYCDOT, but some discrepancies persist, which we will discuss further in the analysis below.
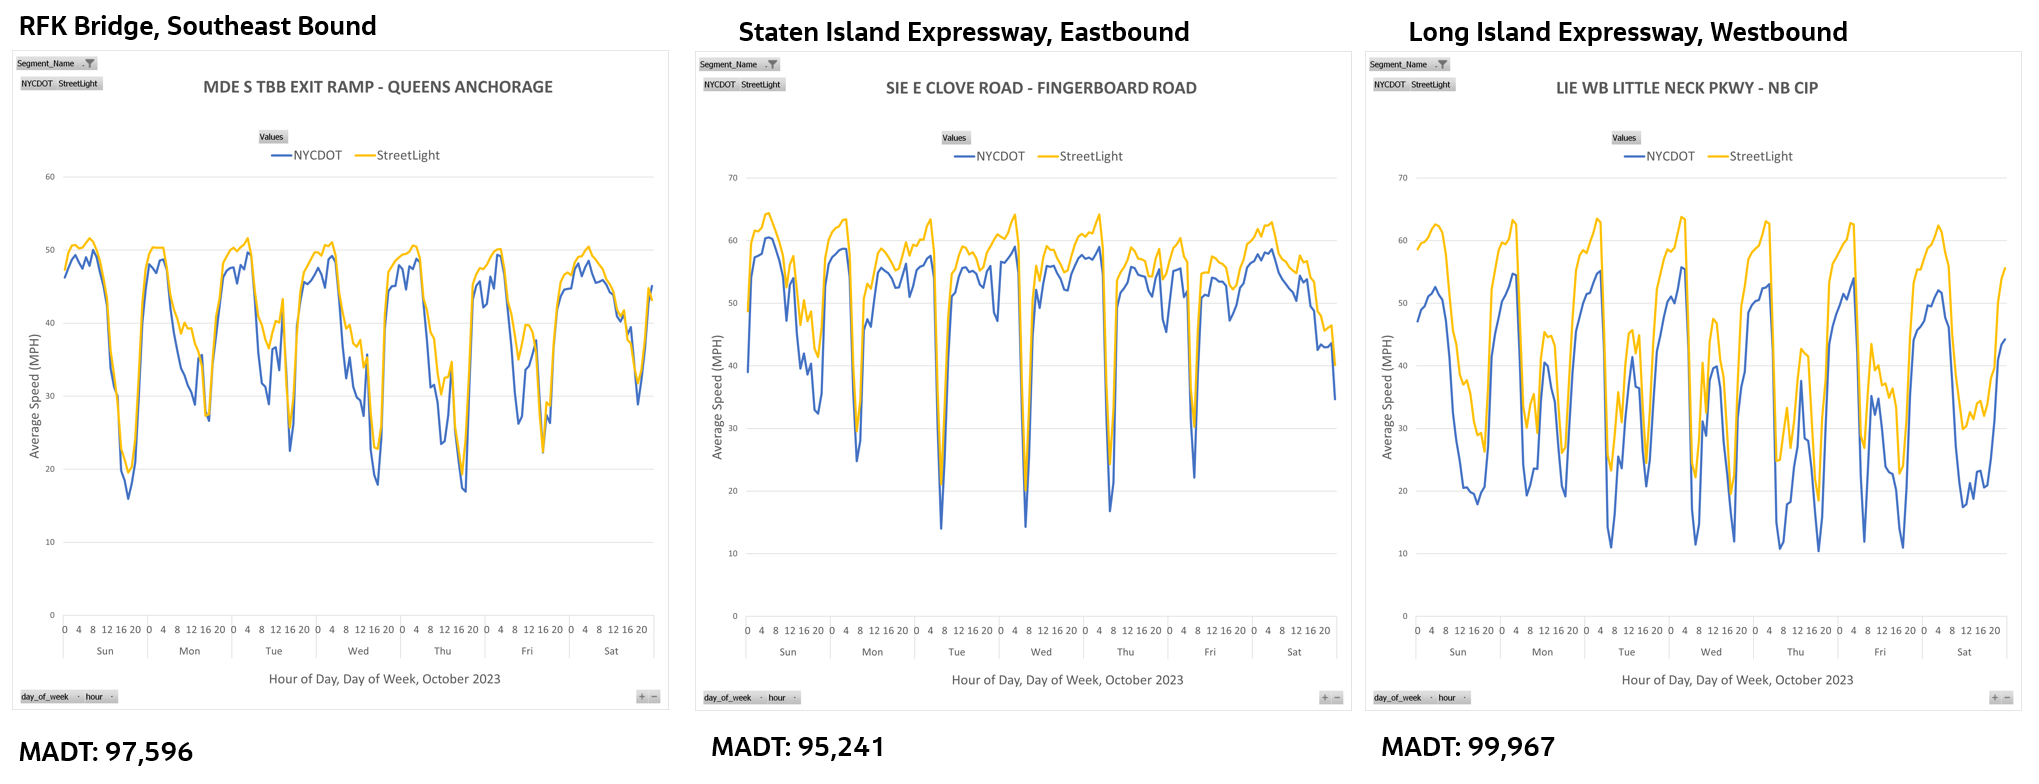
Speed comparisons by day of week and hour of day for RFK Bridge Southeast Bound (left), Staten Island Expressway Eastbound (middle) and Long Island Expressway Westbound (right) segments. Monthly Average Daily Traffic (MADT) for each segment is marked below its graph.
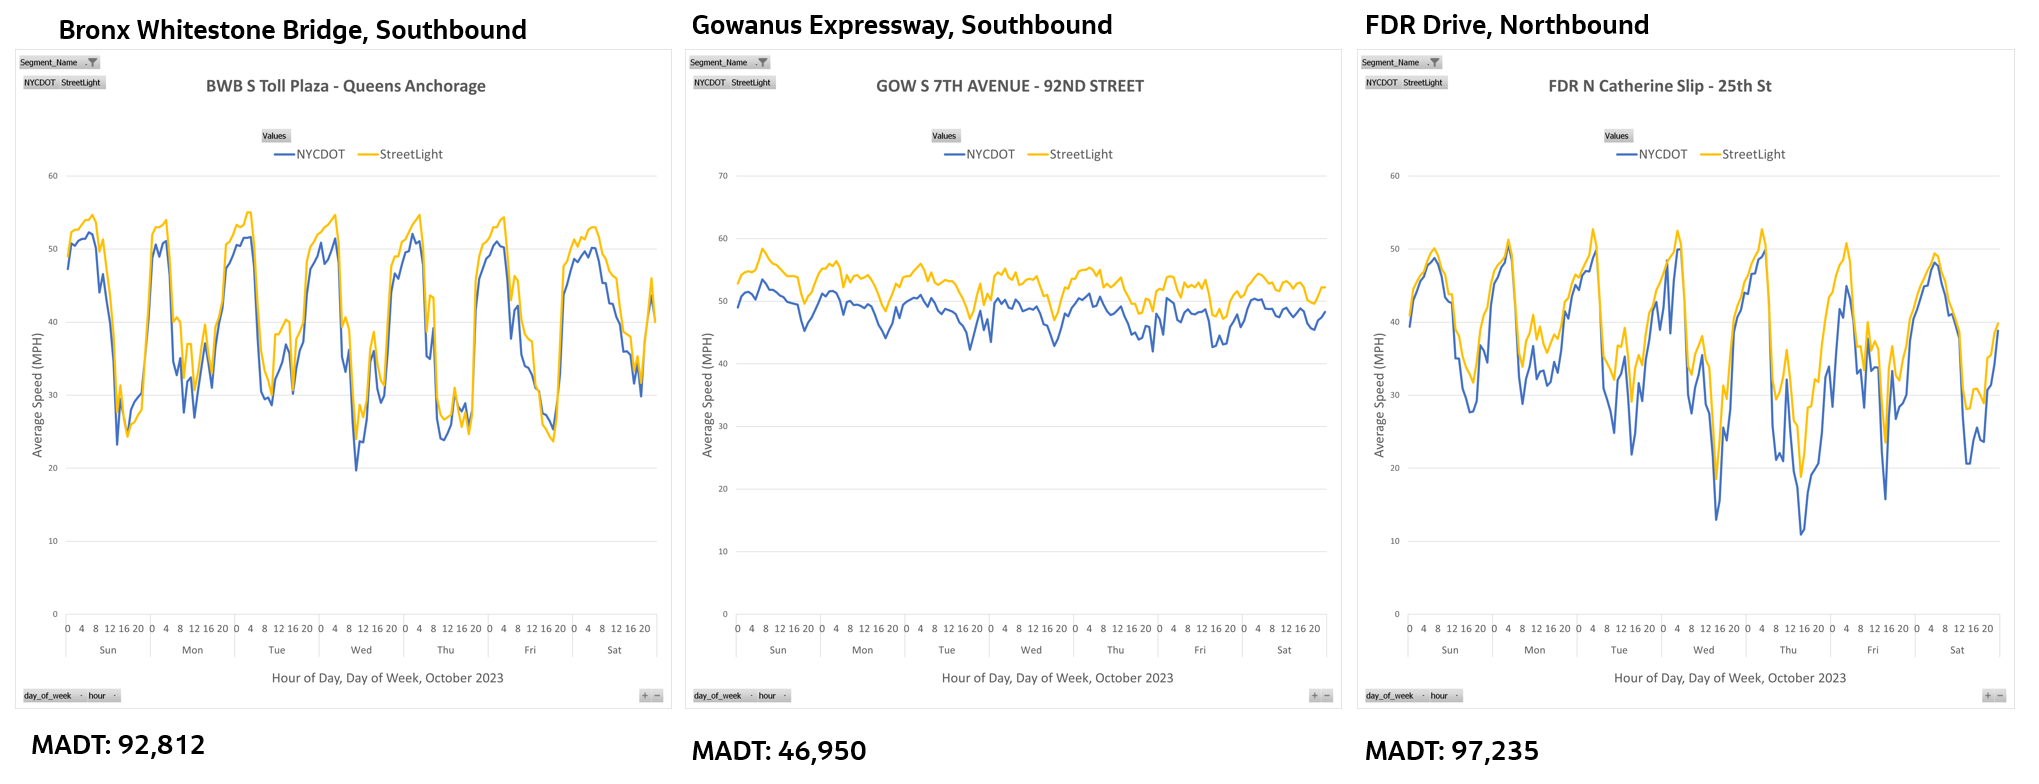
Speed comparisons for Bronx Whitestone Bridge Southbound (left), Gowanus Expressway Southbound (middle), and FDR Drive Northbound (right).

Speed comparisons for Bruckner Expressway Westbound (left), Brooklyn-Queens Expressway (BQE) Southbound between Atlantic and 9th St (middle), and the Brooklyn Battery Tunnel Eastbound (right).
The above nine segment analyses showed StreetLight speed metrics closely aligned with speed data reported by NYCDOT. Where the data differs, StreetLight speeds tend to be slightly higher than those reported by NYCDOT.
Overall, StreetLight’s daily and hourly speed variations for each segment also track closely with the NYCDOT data, indicating that StreetLight’s speed metrics deliver reliable insights for real-world applications like safety and congestion studies, which can save agencies the considerable cost of installing physical sensors.
The two remaining segments (pictured below) display the greatest divergence between the StreetLight and NYCDOT datasets.
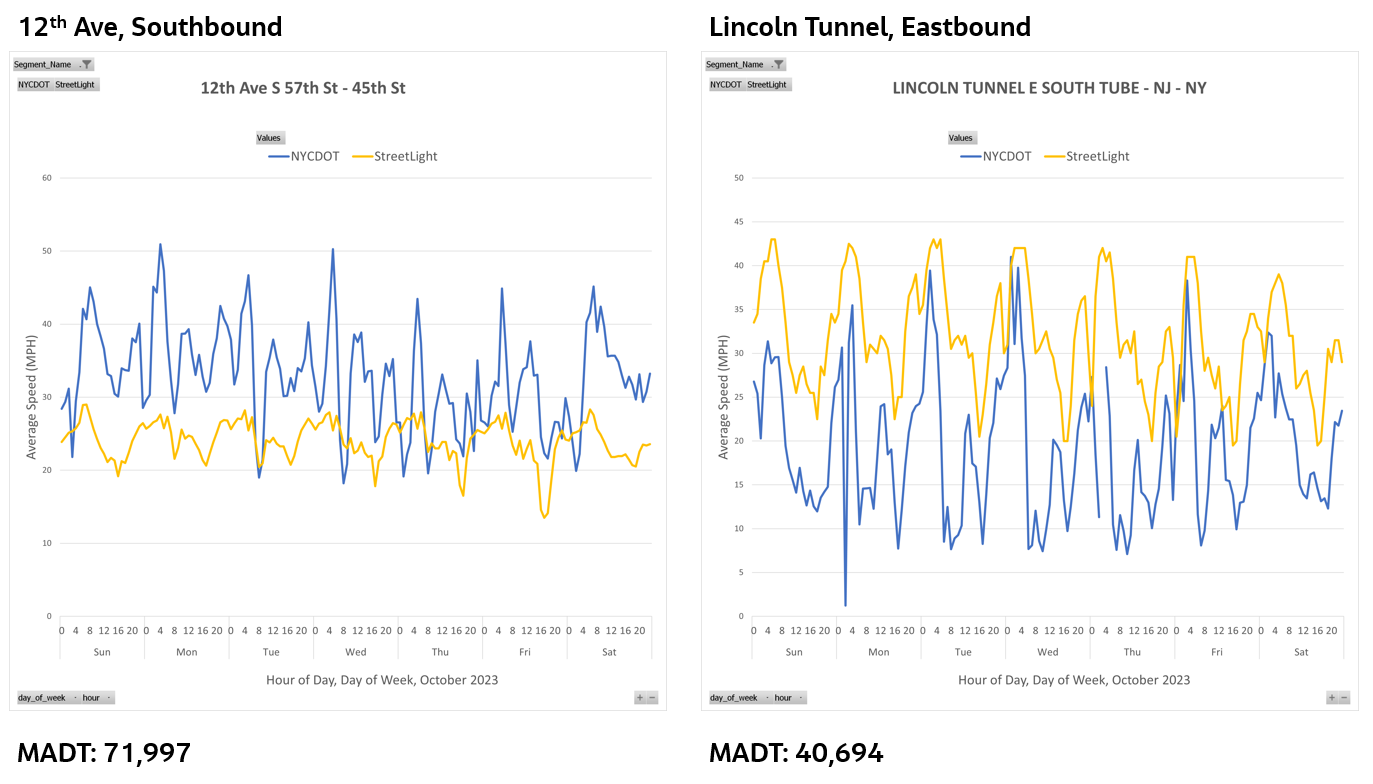
Speed comparisons for 12th Avenue Southbound (left) and Lincoln Tunnel Eastbound (right). These graphs show segments where StreetLight’s OSM zones could not be perfectly aligned to NYCDOT segments.
These discrepancies are likely caused, at least in part, by misaligned segment boundaries. As discussed above, sometimes StreetLight OSM zones could not be perfectly aligned to the NYCDOT segments.
In the case of 12th Avenue (AKA West Side Highway), this segment is part of a signalized corridor with closely spaced intersections, which could exacerbate the impact of the misaligned segments. Because the comparison segments do not have the same signalized-intersection approaches, this could lead to larger differences in average speed.
Despite these localized limitations in segment comparability, the overall results of our comparison show a high degree of alignment between StreetLight’s big data-based speed metrics and NYCDOT’s speed data derived from E-ZPass sensors.
More about StreetLight’s Vehicle Speed Data – Segment Speed and Spot Speeds
Because the vehicle speed metrics provided by StreetLight include average segment speeds, they can provide a helpful perspective, even for agencies that already collect speed data through physical sensors.
Unlike NYCDOT’s average segment speeds used in the above analysis, the speed data available to most agencies are spot speeds. Spot speeds capture vehicle speed at a specific location rather than the average vehicle speed along a whole segment.
Spot speeds and segment speeds each capture a different nuance of vehicle traffic, and comparing the two can help agencies better understand the causes of unsafe speeds or congestion, as well as their most effective solutions.
To ensure clients can take advantage of these nuanced speed insights, spot speeds are now available from StreetLight! To stay updated on all our product releases, consider subscribing to our newsletter.
1. City of New York. NYC OpenData. “DOT Traffic Speeds NBE.” https://data.cityofnewyork.us/Transportation/DOT-Traffic-Speeds-NBE/i4gi-tjb9/about_data