
2020: The Transportation Year in Review
Dec 21, 2020

As 2020 ends, we are astonished at what our customers—agencies, consulting firms, and private companies—were able to accomplish this year. From “business as usual” planning to measuring COVID-19’s effects on transportation, here are some examples of the great work we were able to support in 2020:
- In the spring, planners scrambled to capture key transportation metrics during an unprecedented time of travel shutdown.
- Individual states, regions, and cities began to analyze (and predict) transportation shifts.
- As the pandemic stretched into summer, analysts tracked travel slowdowns and surges, region by region.
- Cities like Seattle saw substantial transportation impact from work-from-home policies.
- When Golden Gate Park visitorship skyrocketed during the pandemic, park management was able to quantify the numbers for their leadership.
- The New York Times, Brookings, and Bloomberg reported on increased bicycle travel and the pandemic’s urban flight.
- In October, hundreds of transportation managers and planners gathered virtually at our annual StreetLight Summit to discuss transportation budget concerns and other ongoing projects and issues.
- Nearly 50,000 people accessed our free VMT Monitor to track their county’s daily fluctuations in vehicle miles traveled.
No one knows what obstacles await in 2021, but we will continue to provide the metrics to measure your biggest transportation problems—and more importantly, solve them.
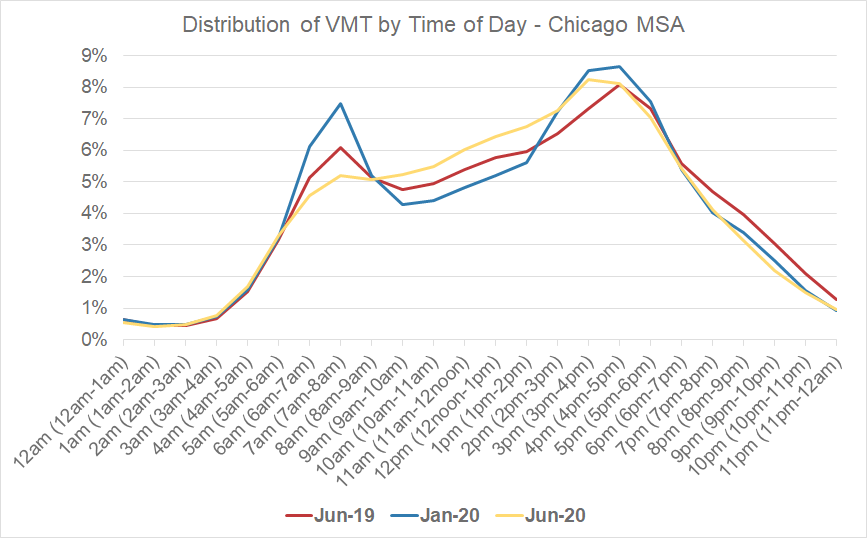
Figure 2: Hourly VMT analysis for the Los Angeles MSA.