
Transportation Leaders, Beware. For Urban and Rural Hotspots, AADT Shows Traffic Is Back and Rising Fast.

In Austin, StreetLight’s Annual Average Daily Traffic (AADT) U.S. Metrics show that traffic on a notoriously congested interstate is already nearing pre-pandemic levels. In Jackson Hole, the story on an unpaved access road is even more dramatic.
Austin’s I-35 corridor sees Annual Average Daily Traffic (AADT) leap back in 2021
The pandemic put Austin at the center of headlines profiling cities seeing a population boom as remote workers relocated.
But the impact of this population growth on traffic was subdued for some time, as the pandemic also kept many people off the roads for typical daily activities. Moreover, jurisdictions’ means of collecting data on traffic to inform planning, congestion mitigation, and federal reporting was also limited during the pandemic, making it difficult to see what was really going on with traffic.
“With 2021 behind us, StreetLight’s enhanced AADT algorithms, which help to fill in the data gaps for those that only have counters on a few roads, allow us to see the dramatic changes in average daily vehicle volumes over the past two years – and compare those volumes to prior years.”
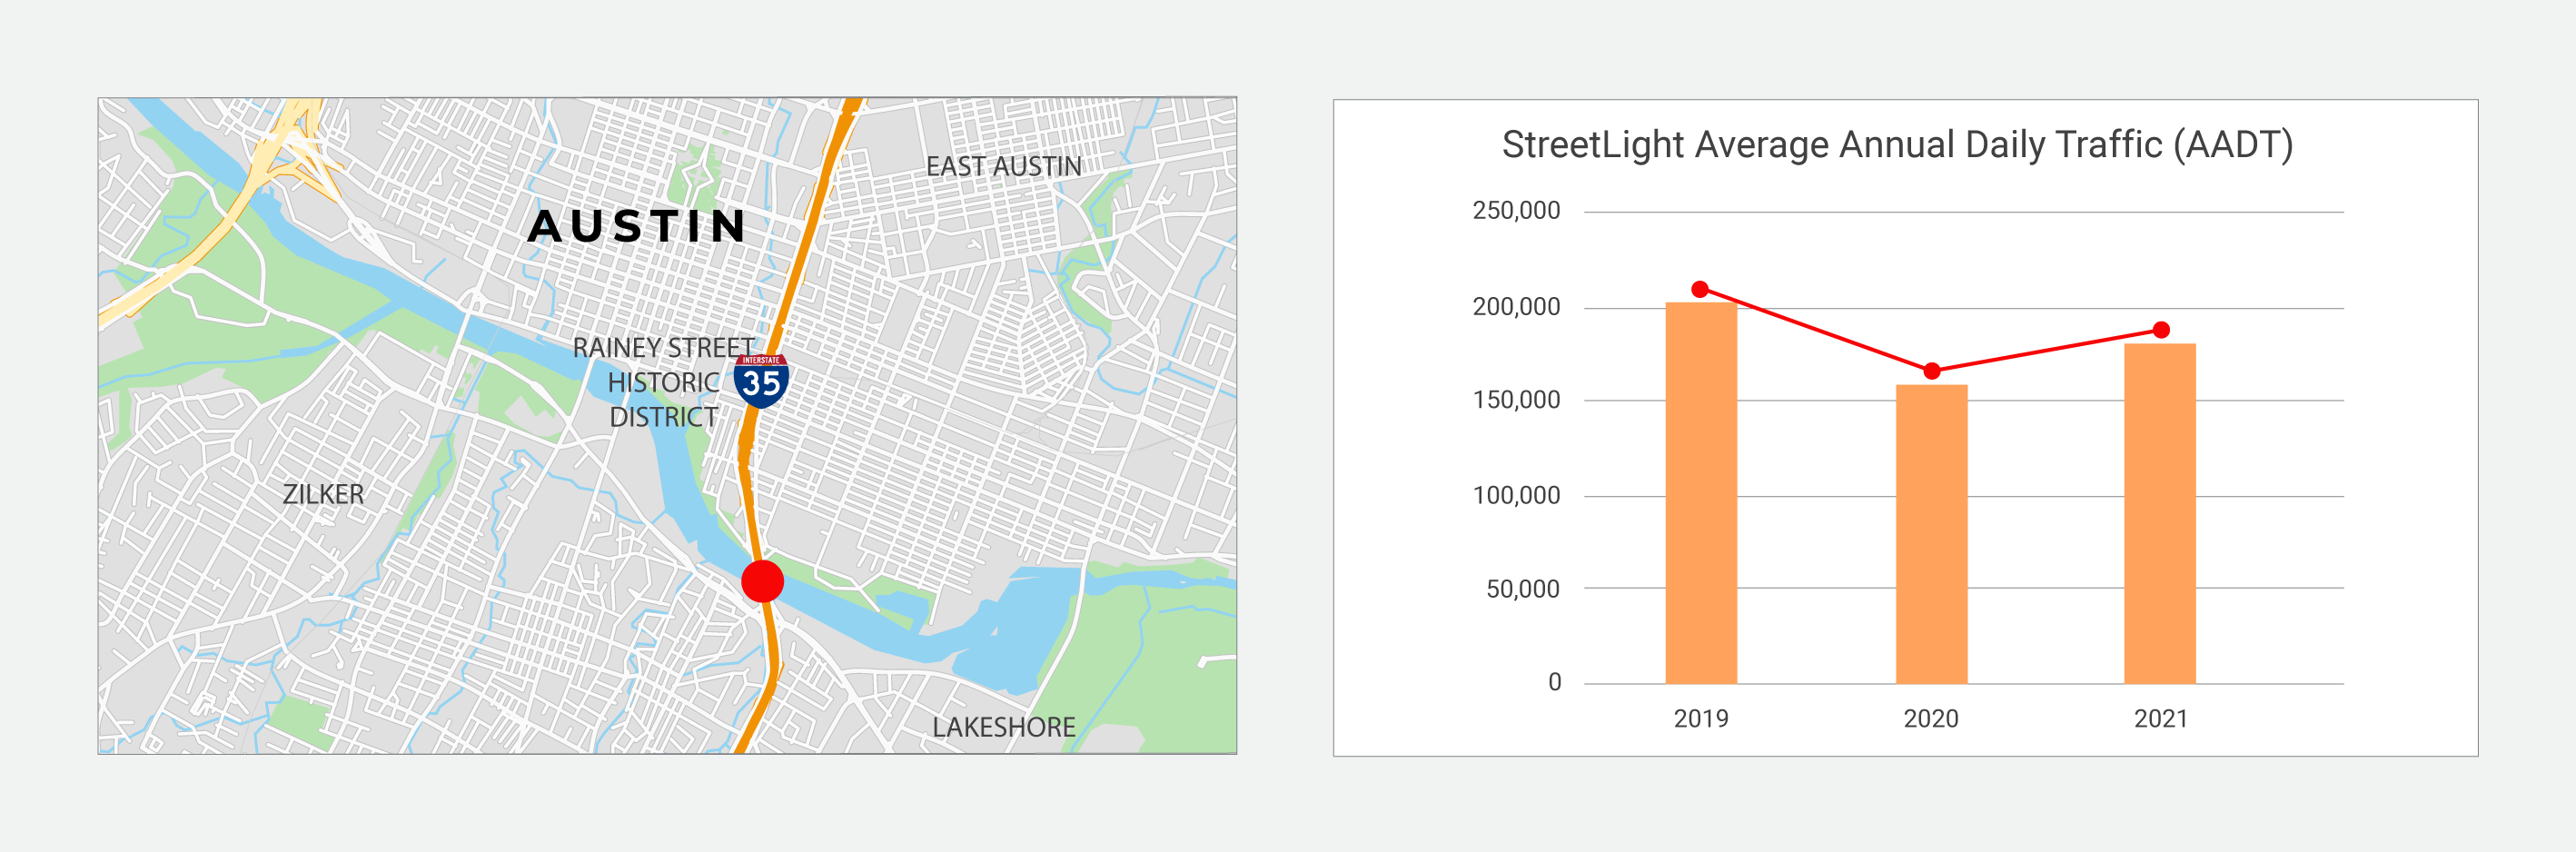
StreetLight InSight® analysis of I-35 indicates a steep rise in traffic in 2021
StreetLight ran an analysis on I-35, a crucial corridor that runs through the center of Austin and one of the most congested highways in Texas. Results from StreetLight InSight® platform indicate a 2019 volume of approximately 200,000 average daily vehicles.
But then the pandemic hit and many people limited their movements in 2020. StreetLight’s AADT Metrics show this depressed average daily vehicle volume substantially.
Simultaneously, Austin’s population continued to boom. Median home prices in the city went up by 31% in 2020, compared to 15.7% statewide, according to Texas Realtors. Austin was the second-fastest-growing city in Texas between 2010 to 2020, according to the U.S. Census Bureau.
What does that mean for traffic?
AADT volumes took a jump of 14% in 2021, despite the pandemic still depressing some amount of travel.
The trend suggested that as life returned to relative normalcy in 2022, I-35 would see its AADT volumes near or above 2019 levels. While factors like high gas prices could keep some traffic at bay, there is no question that given the increase in population, the city is poised to see congestion rise in the future.
To mitigate these trends, planners will need to make data-driven decisions about what infrastructure can lessen traffic and support a growing population.
In Jackson Hole, Wyoming, dramatic AADT growth on an unpaved road shows critical services are needed
Popular cities weren’t the only places that saw population and driving behavior change during the pandemic. Rural locations all over, especially those with popular national parks, saw a major influx of short- and long-term visitors and new residents arrive over the last two years.
For these areas, where it’s difficult to supply and maintain sufficient traffic counters on roads, it can be particularly challenging to see how trends are changing in real-time. And impossible to compare against historical trends, if the data wasn’t collected previously.
StreetLight ran an analysis on an unpaved section of Moose-Wilson Road in Jackson Hole, Wyoming using our AADT metrics, which cover all roads, both low and high volume, and can be compared with historical roadway volumes to understand year-over-year trends.
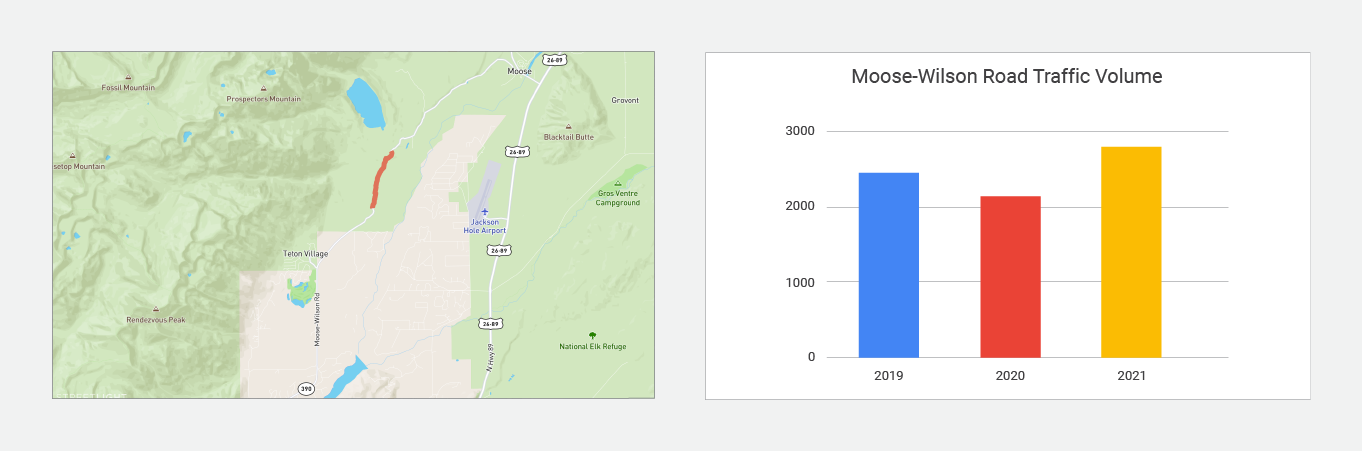
AADT counts for Moose-Wilson Road from StreetLight suggest 2021 traffic volume already exceeded 2019.
The road, which provides an access point to Grand Teton National Park, saw a dip in AADT in 2020, consistent with national trends. But in 2021, AADT had already surpassed 2019 by 8%.
The analysis confirms the unpaved road is a high priority for investment to keep up with traffic, which bumped up again in the first half of 2022.
StreetLight’s 2022 U.S. AADT Metric offers comprehensive coverage, time trend comparisons, and accuracy on par with industry benchmarks
StreetLight has released the AADT metric every year for the past few years, continuously updating it yearly. The latest AADT 2022 U.S. metric is now available. Read the AADT white paper that dives into:
- Comparing trends across recent and historical 2019 – 2022 AADT metrics
- Evaluating StreetLight’s AADT estimates against industry accuracy targets
- How the Monthly Average Daily Traffic (MADT) model utilizes 2020 U.S. Census population and OpenStreetMap (OSM) data, resulting in improved estimated traffic volumes
To access StreetLight’s Annual Average Daily Traffic (AADT) Metrics and the StreetLight InSight® platform, which includes traffic counts, origin-destination, multimodal volumes, and other transportation metrics for any time period, get started here.

1 We used the “BESTMILE” statistic in NHTS. This is the best-available estimate of each household’s mileage, based on odometer readings,
 self-reported VMT, and/or travel miles on a given day.
2 There are additional outliers which exist beyond the range of the y-axis on this graph. They are not shown due to space constraints.

JTNDZGl2JTIwY2xhc3MlM0QlMjd0YWJsZWF1UGxhY2Vob2xkZXIlMjclMjBpZCUzRCUyN3ZpejE2NTIxMzMyMTUyNzMlMjclMjBzdHlsZSUzRCUyN3Bvc2l0aW9uJTNBJTIwcmVsYXRpdmUlMjclM0UlM0Nub3NjcmlwdCUzRSUzQ2ElMjBocmVmJTNEJTI3JTIzJTI3JTNFJTNDaW1nJTIwYWx0JTNEJTI3RGFzaGJvYXJkJTIwMSUyMCUyNyUyMHNyYyUzRCUyN2h0dHBzJTNBJTI2JTIzNDclM0IlMjYlMjM0NyUzQnB1YmxpYy50YWJsZWF1LmNvbSUyNiUyMzQ3JTNCc3RhdGljJTI2JTIzNDclM0JpbWFnZXMlMjYlMjM0NyUzQkRKJTI2JTIzNDclM0JESldaMzdGQ0slMjYlMjM0NyUzQjFfcnNzLnBuZyUyNyUyMHN0eWxlJTNEJTI3Ym9yZGVyJTNBJTIwbm9uZSUyNyUyMCUyRiUzRSUzQyUyRmElM0UlM0MlMkZub3NjcmlwdCUzRSUzQ29iamVjdCUyMGNsYXNzJTNEJTI3dGFibGVhdVZpeiUyNyUyMHN0eWxlJTNEJTI3ZGlzcGxheSUzQW5vbmUlM0IlMjclM0UlM0NwYXJhbSUyMG5hbWUlM0QlMjdob3N0X3VybCUyNyUyMHZhbHVlJTNEJTI3aHR0cHMlMjUzQSUyNTJGJTI1MkZwdWJsaWMudGFibGVhdS5jb20lMjUyRiUyNyUyMCUyRiUzRSUyMCUzQ3BhcmFtJTIwbmFtZSUzRCUyN2VtYmVkX2NvZGVfdmVyc2lvbiUyNyUyMHZhbHVlJTNEJTI3MyUyNyUyMCUyRiUzRSUyMCUzQ3BhcmFtJTIwbmFtZSUzRCUyN3BhdGglMjclMjB2YWx1ZSUzRCUyN3NoYXJlZCUyNiUyMzQ3JTNCREpXWjM3RkNLJTI3JTIwJTJGJTNFJTIwJTNDcGFyYW0lMjBuYW1lJTNEJTI3dG9vbGJhciUyNyUyMHZhbHVlJTNEJTI3eWVzJTI3JTIwJTJGJTNFJTNDcGFyYW0lMjBuYW1lJTNEJTI3c3RhdGljX2ltYWdlJTI3JTIwdmFsdWUlM0QlMjdodHRwcyUzQSUyNiUyMzQ3JTNCJTI2JTIzNDclM0JwdWJsaWMudGFibGVhdS5jb20lMjYlMjM0NyUzQnN0YXRpYyUyNiUyMzQ3JTNCaW1hZ2VzJTI2JTIzNDclM0JESiUyNiUyMzQ3JTNCREpXWjM3RkNLJTI2JTIzNDclM0IxLnBuZyUyNyUyMCUyRiUzRSUyMCUzQ3BhcmFtJTIwbmFtZSUzRCUyN2FuaW1hdGVfdHJhbnNpdGlvbiUyNyUyMHZhbHVlJTNEJTI3eWVzJTI3JTIwJTJGJTNFJTNDcGFyYW0lMjBuYW1lJTNEJTI3ZGlzcGxheV9zdGF0aWNfaW1hZ2UlMjclMjB2YWx1ZSUzRCUyN3llcyUyNyUyMCUyRiUzRSUzQ3BhcmFtJTIwbmFtZSUzRCUyN2Rpc3BsYXlfc3Bpbm5lciUyNyUyMHZhbHVlJTNEJTI3eWVzJTI3JTIwJTJGJTNFJTNDcGFyYW0lMjBuYW1lJTNEJTI3ZGlzcGxheV9vdmVybGF5JTI3JTIwdmFsdWUlM0QlMjd5ZXMlMjclMjAlMkYlM0UlM0NwYXJhbSUyMG5hbWUlM0QlMjdkaXNwbGF5X2NvdW50JTI3JTIwdmFsdWUlM0QlMjd5ZXMlMjclMjAlMkYlM0UlM0NwYXJhbSUyMG5hbWUlM0QlMjdsYW5ndWFnZSUyNyUyMHZhbHVlJTNEJTI3ZW4tVVMlMjclMjAlMkYlM0UlM0NwYXJhbSUyMG5hbWUlM0QlMjdmaWx0ZXIlMjclMjB2YWx1ZSUzRCUyN3B1Ymxpc2glM0R5ZXMlMjclMjAlMkYlM0UlM0MlMkZvYmplY3QlM0UlM0MlMkZkaXYlM0UlMjAlM0NzY3JpcHQlMjB0eXBlJTNEJTI3dGV4dCUyRmphdmFzY3JpcHQlMjclM0UlMjB2YXIlMjBkaXZFbGVtZW50JTIwJTNEJTIwZG9jdW1lbnQuZ2V0RWxlbWVudEJ5SWQlMjglMjd2aXoxNjUyMTMzMjE1MjczJTI3JTI5JTNCJTIwdmFyJTIwdml6RWxlbWVudCUyMCUzRCUyMGRpdkVsZW1lbnQuZ2V0RWxlbWVudHNCeVRhZ05hbWUlMjglMjdvYmplY3QlMjclMjklNUIwJTVEJTNCJTIwaWYlMjAlMjglMjBkaXZFbGVtZW50Lm9mZnNldFdpZHRoJTIwJTNFJTIwODAwJTIwJTI5JTIwJTdCJUUyJTgwJThCJTIwdml6RWxlbWVudC5zdHlsZS53aWR0aCUzRCUyNzEwMDBweCUyNyUzQnZpekVsZW1lbnQuc3R5bGUuaGVpZ2h0JTNEJTI3ODI3cHglMjclM0IlN0QlMjBlbHNlJTIwaWYlMjAlMjglMjBkaXZFbGVtZW50Lm9mZnNldFdpZHRoJTIwJTNFJTIwNTAwJTIwJTI5JTIwJTdCJUUyJTgwJThCJTIwdml6RWxlbWVudC5zdHlsZS53aWR0aCUzRCUyNzEwMDBweCUyNyUzQnZpekVsZW1lbnQuc3R5bGUuaGVpZ2h0JTNEJTI3ODI3cHglMjclM0IlN0QlMjBlbHNlJTIwJTdCJUUyJTgwJThCJTIwdml6RWxlbWVudC5zdHlsZS53aWR0aCUzRCUyNzEwMCUyNSUyNyUzQnZpekVsZW1lbnQuc3R5bGUuaGVpZ2h0JTNEJTI3NzI3cHglMjclM0IlN0QlMjB2YXIlMjBzY3JpcHRFbGVtZW50JTIwJTNEJTIwZG9jdW1lbnQuY3JlYXRlRWxlbWVudCUyOCUyN3NjcmlwdCUyNyUyOSUzQiUyMHNjcmlwdEVsZW1lbnQuc3JjJTIwJTNEJTIwJTI3aHR0cHMlM0ElMkYlMkZwdWJsaWMudGFibGVhdS5jb20lMkZqYXZhc2NyaXB0cyUyRmFwaSUyRnZpel92MS5qcyUyNyUzQiUyMHZpekVsZW1lbnQucGFyZW50Tm9kZS5pbnNlcnRCZWZvcmUlMjhzY3JpcHRFbGVtZW50JTJDJTIwdml6RWxlbWVudCUyOSUzQiUyMCUzQyUyRnNjcmlwdCUzRQ==

