
How Work-From-Home Affects 2020’s Vehicle Miles Traveled Statistics

Although most statewide pandemic-related stay-home orders have been lifted or reduced, many organizations have announced that they will continue work-from-home policies through at least the end of the year, and perhaps into 2021. How will this affect your agency and locality?
We’ve noted many benefits of stay-home policies, such as safer streets for bicyclists and pedestrians, reduced noise, congestion, and air pollution. But we’ve also seen a major drawback: For some government agencies, fewer vehicle miles traveled (VMT) means less gas-tax-related funding.
We turned to Big Data to better understand how work-from-home policies impact VMT. Here, we share how planners can identify, monitor, and predict commuting travel fluctuations in order to estimate the impact on VMT.
VMT Monitor Reveals Ongoing Fluctuations
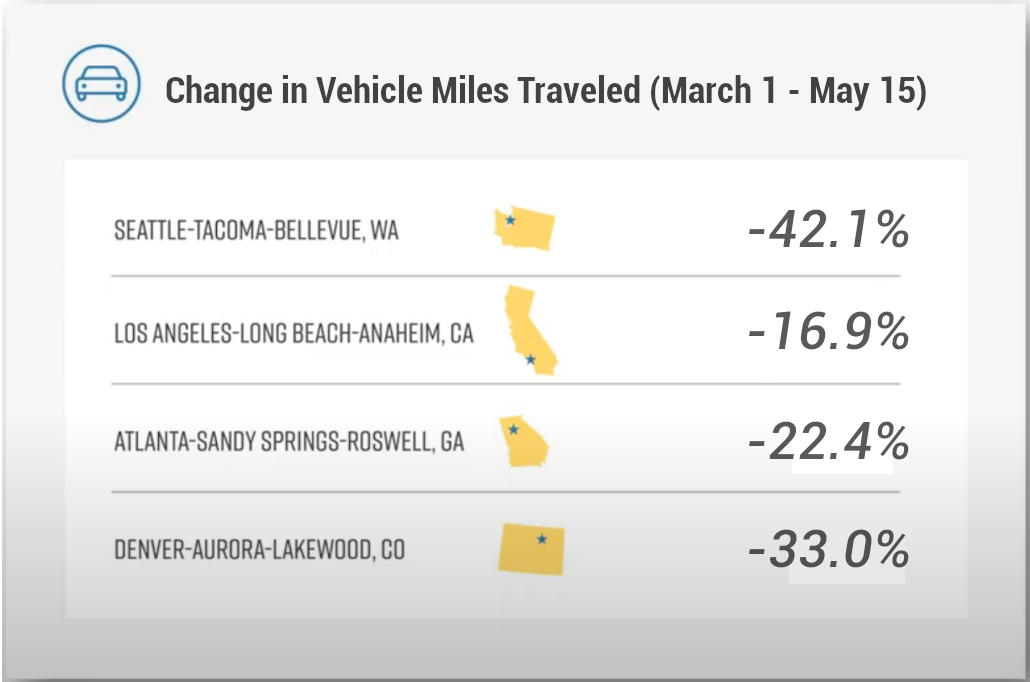
Many U.S. cities have experienced significant decreases in VMT since the pandemic started. We have been tracking these changes by using the StreetLight VMT Monitor, which provides county-by-county VMT measurements for each day since the COVID-19 crisis began, as well as a change from the baseline. We saw a 25% average drop in VMT nationwide from March 1st to May 15th, when most cities had stay-home orders in place.
We know intuitively that total VMT reduction during the pandemic can be attributed not just to work-from-home, but also school closures and less travel to run errands. But since employers announce work-from-home policies, that traffic is a somewhat known entity that agencies can predict and plan for (unlike errand travel), and provides a helpful metric for planners.
Seattle Study: Top Employers Driving Traffic
We delved into Seattle’s traffic fluctuations because the Seattle area has four major companies (Amazon, Microsoft, Boeing, and REI Co-Op) that employ over 150,000 people in Seattle. Together, that’s more than 6% of greater Seattle’s working population. We hypothesized that commuting patterns for these major employers would heavily impact Seattle-area VMT.
Measuring commuting for these four companies normally would have required fielding a survey or placing sensors at the business entries — both difficult and expensive during the best of times, but particularly problematic during a pandemic.
Instead, we used StreetLight InSight® for three analyses that gave us data before and after COVID work-from-home policies:
- Top Routes
- Zone Activity
- Zone Activity with Home/Work Location.
The Top Routes and Zone Activity analyses allowed us to visualize the road segments with the most traffic to and from these employment centers, then measure the trip volumes along these segments.
The Home/Work Location feature allowed us to identify and aggregate where employees live and work. The inferred home locations are clustered into 1 km by 1 km grids, and thus protect the identity of individuals.
These analyses provide additional Metrics which we did not use for this study, including trip distance and traveler demographics (age, income, race, and more).
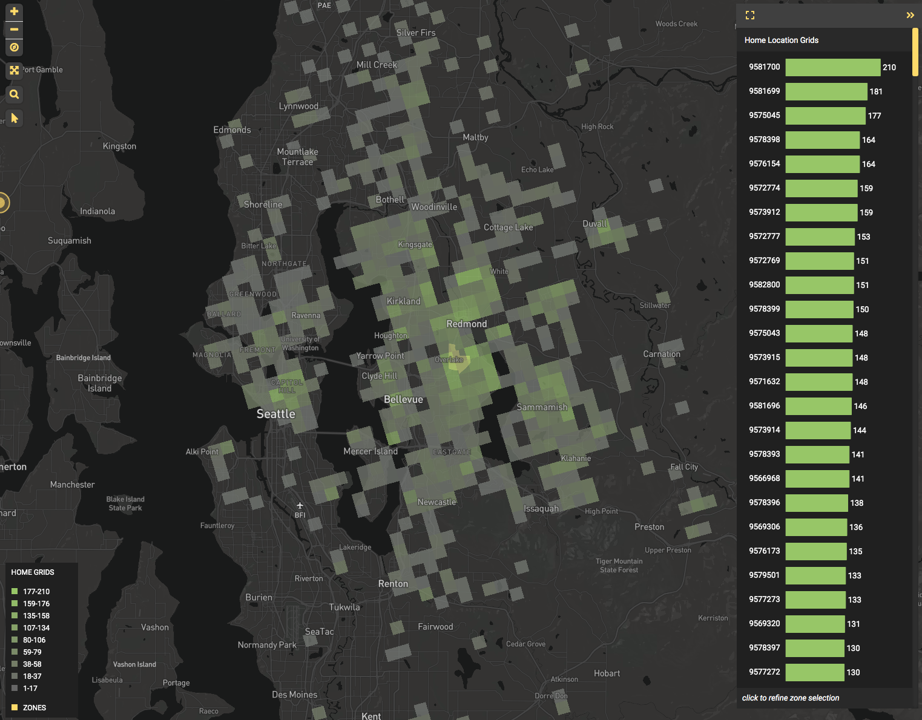
Figure 1: A pre-COVID Zone Activity analysis of Microsoft’s Seattle headquarters shows inferred, aggregated home locations for peak AM commuters.
How Much Seattle Traffic Comes From Commuting?
Our initial hypothesis turned out to be correct — a large percentage of Seattle’s VMT came from commuters working at one of the area’s four largest companies.
The analysis showed that pre-COVID, 4,420,207 daily trips on average were made in Seattle, and 967,102 of those trips were made during peak AM hours. Of those peak AM trips, 40,615 trips were made by Amazon, Microsoft, Boeing, and REI employees traveling from home to work.
In typical conditions, that’s 2% of Seattle’s total daily trips, and 4% of all trips during peak AM hours. Post-COVID, these home-to-work trips only represented 1% of trips made during peak AM hours. That’s a sizable impact.
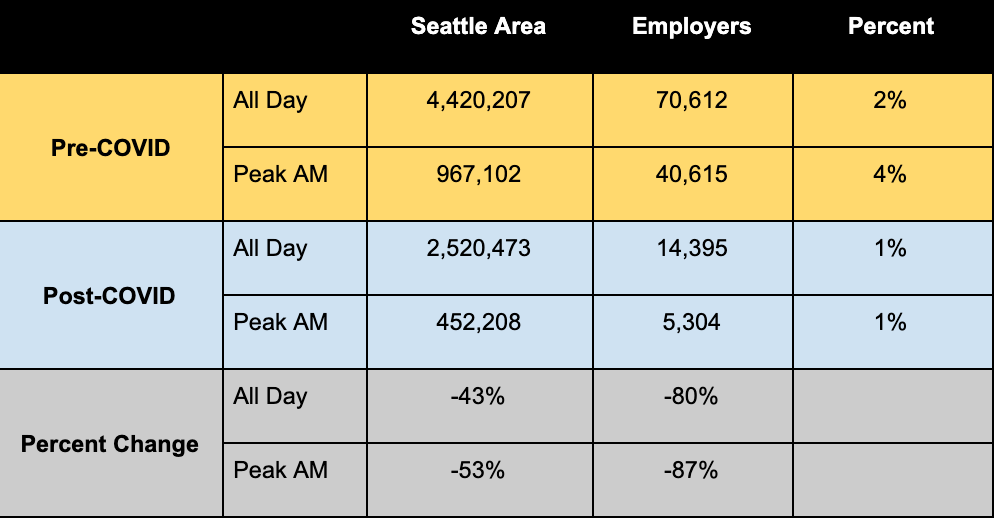
Figure 2: Changes in Seattle-area commuting trip volume for major employers (Amazon, Microsoft, Boeing, and REI).
With these trip volume results we can calculate VMT, and the subsequent impact on Seattle when these four major employers continue (or change) work-at-home policies.
Predicting Work-From-Home’s Effect on VMT
During peak stay-home orders, Seattle experienced a 42% decrease in overall VMT, but across the four large employers commute trips decreased by 80-90%. An interesting note: As the only manufacturing business, Boeing’s traffic decreased least of the four — this correlates with essential employees continuing to work during the pandemic.
We can see that employer commute trips in Seattle during the summer represented a disproportionate share of COVID travel decline. Although residents were still travelling (at 42% of normal VMT) not as many were commuting. Therefore, the travel that exists is being generated otherwise.
Rising VMT despite continuing work-from-home policies indicates that trip purpose is continuing to shift. This finding invites additional analysis: For example, planners may want to understand if different roads are being used, and apply resources to the appropriate routes.
While we may understand some of the short-term ramifications of the pandemic on VMT, it’s also important to plan for its long-term effects. Using Big Data analyses, planners can stay current on travel trends to respond to travel fluctuations.