
Why I Hope Big Data Can Help Stop Cycling Fatalities

I bought a mountain bike a week after I came home crying from a morning road bike ride. My husband and I, riding on a residential four-lane road, had yet again been honked at, yelled at, and intentionally sideswiped by several vehicle drivers. One of them came close enough for me to realize the terrible risk we were taking. We decided to shift our riding off the road and onto dirt trails.
That was six years ago, and cycling fatalities have only gotten worse.
Fortunately, many localities are trying to improve safety for bike and pedestrian travel. Planners are able to gather more data now than ever before. And I’m hopeful that part of the work I do with StreetLight can help.
Cycling Fatalities Are on the Rise
After six years of mountain biking in my hometown of Richmond, Virginia, I’ve broken both arms, a rib, and my nose, plus earned a million nasty bruises, but you know what hasn’t happened? I haven’t been killed by a reckless or angry driver.

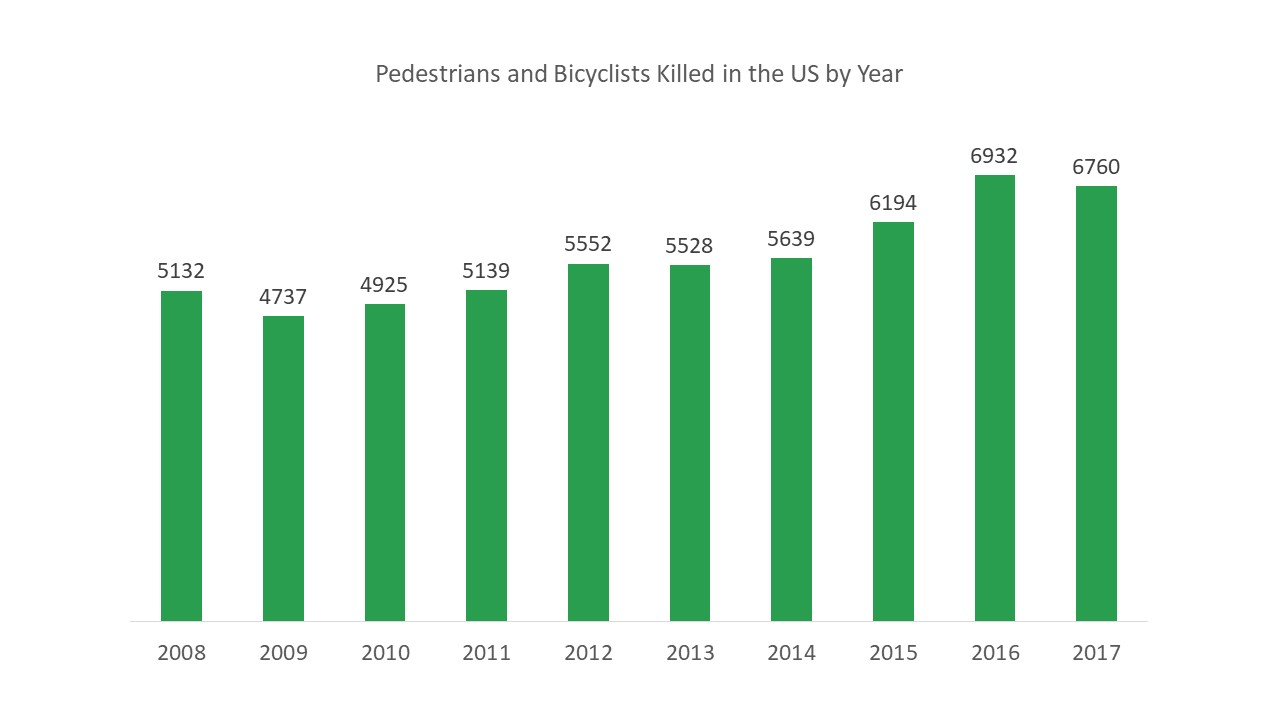
Pedestrians and bicyclists killed by year. Source: Pedestrian & Bicycle Information Center
Cycling and pedestrian traffic fatalities increased 32% from 2010 to 2017, and this statistic is very personal for me. I’m admittedly addicted to my bike, for fun and for health reasons. But the joy cycling brings me is increasingly tempered by fear, especially as more cyclists I know have been killed or injured by vehicle drivers.
Some were left to die, like Lanie Kruszewski, whose hit-and-run driver sped off with a shattered windshield. Or Robyn Hightman, whose fatal collision with a New York City truck driver has galvanized bike-safety activists. Some miraculously survived, like my mountain-biking pal Marty. He made his last road ride after waking up alone on the road shoulder, his bike smashed from a long-gone vehicle driver’s impact.
What the Data Can Tell Us
One reason I joined StreetLight in January is because the company had just added bike and pedestrian metrics to their extensive transportation analytics. I was captivated by the analyses I ran, noting where bike traffic was heaviest in Richmond. When I bought a commuter bike to ride to work, I was able to map a bike-friendly route. I even did a study of the mountain bike trails in my favorite bike park.
Using Big Data to learn more about mobility is fun, but more importantly, it can save cyclist and pedestrian lives.
First, the analytics can reveal where cyclists and pedestrians travel. Planners can see what routes they take, at what time of day and year. They could see, for example, that a lot of cyclists travel River Road and the Huguenot Bridge, where Lanie Kruszewski was killed. That’s an indicator of bike demand. Planners could use the numbers of cyclists on the road to justify widening or continuing a bike lane.
Second, data metrics can show vehicle congestion and, just as important, average vehicle speeds. Areas with a mix of bikes, pedestrians, and speeding cars, like the Huguenot Bridge, carry a higher risk, and should be prioritized for traffic shifts or other mitigation tactics. The prevailing vehicle speed can be used to justify separating bikes from cars with infrastructure.
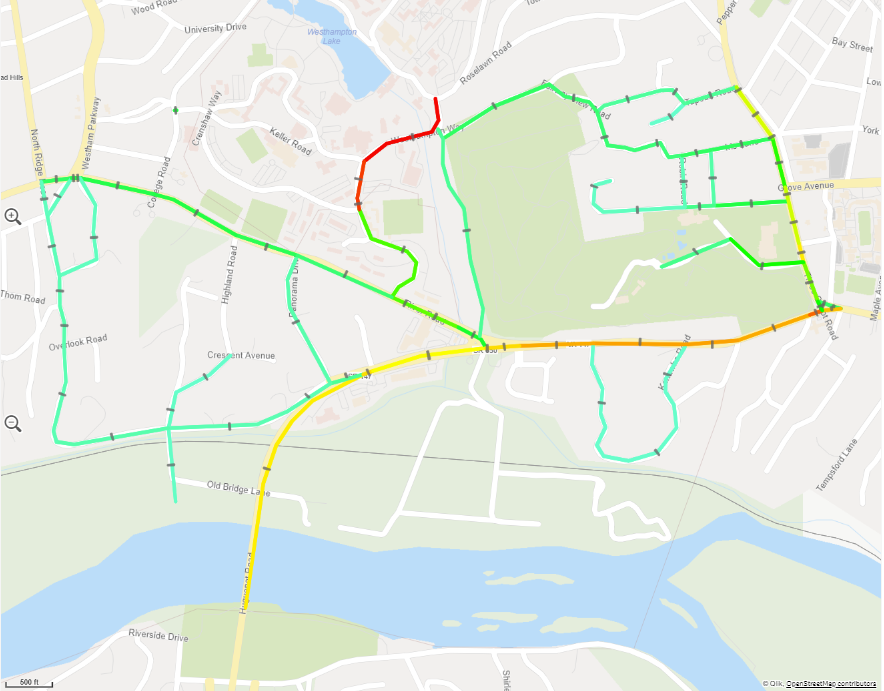
A heat-map visualization shows where bike traffic is concentrated in the River Road area of Richmond.
To that end, analytics also indicate where vehicle and bicycle traffic can shift from and to. For example, does demand show that a bike/pedestrian path should be added to a road that’s parallel to a busy vehicle commuter route? Or, in the case of the Huguenot Bridge, should the wide shoulder be designated a separate bike and pedestrian path?
Finally, Big Data can study before-and-after metrics to reveal if mitigation tactics are working. Learn whether or not vehicle drivers have slowed down, or if cyclists, pedestrians, or vehicles have shifted to different routes.
Let’s Get the Data Into the Right Hands
I wish we could give away this data for free to every locality in the country, but we are a business. We have to make money to pay the brilliant engineers who make these metrics possible. But I am hopeful that this blog post can help get affordable information to more transportation planners for lowering cycling fatalities.
StreetLight’s bike and pedestrian metrics have been part of our premium pricing tier, an add-on included with other specialty data like commercial vehicle and special events metrics. But we noticed that a lot of planners wanted just the bike/ped information — so that’s what we’re doing through October
Maybe one day every planner in every city will have access to the kind of bike and pedestrian analytics I can call up on my work laptop, and more. Then it might be easier to make cars slow down, or shift bikes and vehicles to different routes, or build more bike and pedestrian paths.
Recently, I started riding my road bike again, and last week I rode down River Road and the Huguenot Bridge. Honestly, I don’t feel any safer. But I’m hopeful about the future. If you’re reading this, you’re probably one of the people who can make that future better. Contact us if you want our help.