
Integrated Analysis to Analyze Viewership

This analysis was done in conjunction with our friends at MotionLoft. Thanks to them and to the team at Great Wall of Oakland. Also thanks to Ozumo restaurant and The Broadway Grand apartments for donating the location and powersource for the Motionloft sensors.
The Great Wall of Oakland is a non-profit organization and a 100′x100′ projection installation in Oakland’s Uptown District. The Wall produces monthly projections of media art, along with contributing to the economic and social health of Oakland and supporting artists in developing new work. The Wall, as it’s known by its friends, educates and enlivens the urban community, gives talented local artists a prominent place to screen their work, and enriches the lives of the people who live and work in Oakland. As a free outdoors arts venue in the heart of Oakland, the Great Wall serves an extremely diverse population.
But the question emerges – how many people are educated and enlivened, and just how diverse is that population anyway? These questions are of more than passing interest – many art grants organization require estimates of how many people see the art they will be financing. The Wall’s prominent outdoor location makes this uniquely hard to measure (as opposed to say, a gallery location). Wall executive director Andrea Steves said, “We are working hard to increase our programs and positive impact in the community. But our great strength – being outdoor for all to see – also makes it tough to quantify the full impact of our work. In addition to funders wanting this information, we want to make sure we’re actually in the best location and showing at the best time – and that our projections are reaching as many people as possible.”
The Problem
The Wall, shown in Figure 1 below, is lit up with digital art one night a month. Both pedestrians and vehicles can see the art on The Wall these nights. To maximize viewers, The Wall’s shows are in conjunction with the Oakland Art Murmur, which shuts town Telegraph Avenue to vehicular traffic each First Friday and hosts open gallery tours, street vendors, outdoor music, and more. The Wall is on Grand Avenue, just beyond the edge of the Art Murmur pedestrian zone (see Figure 2).
The challenge to measure viewers is threefold – first, pedestrian counts for specific times are very hard to get especially to compare First Fridays to other days/times. Second, ditto the pedestrian problem for vehicles. Third, The Wall staff has no way to assess the demographics of the viewers, except to know from experience that people come from all parts of the Bay Area to visit Uptown Oakland during First Fridays.

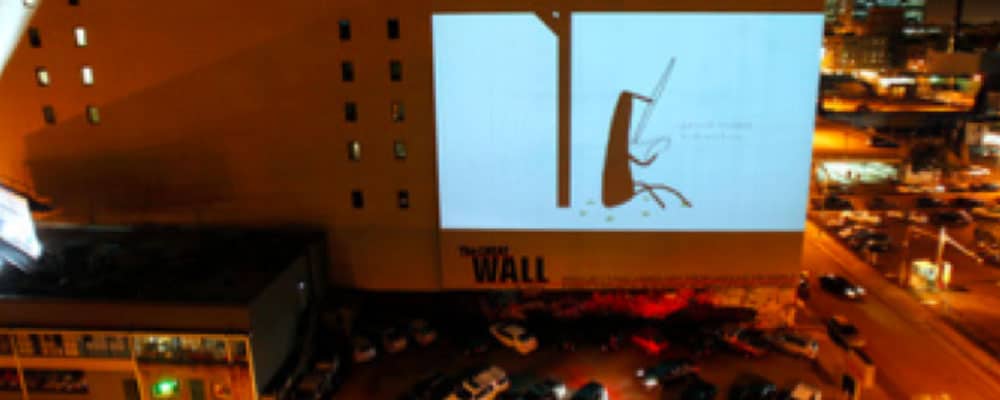
Figure 1: The Wall showing art, as seen from above.
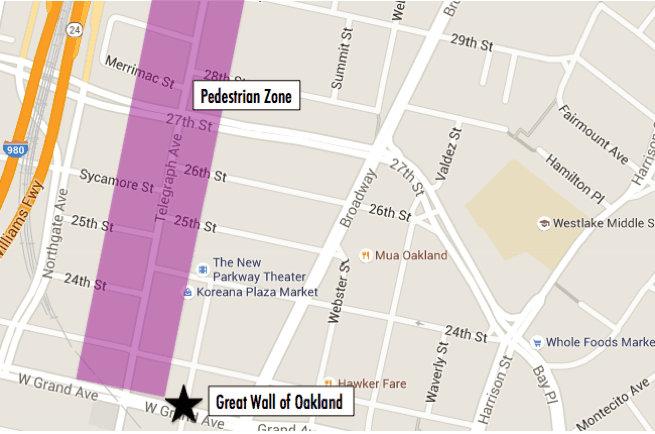
Figure 2: Map of Great Wall of Oakland and First Friday Art Murmur locations.
The StreetLight + Motionloft Solution
Two types of technology were used to create this study. Motionloft computer vision-enable sensors to count pedestrians, and StreetLight InSight® GPS analytics technology. Motionloft installed four sensors around the Great Wall, and StreetLight utilized anonymous GPS traces from tens of thousands of vehicles around the Great Wall to create these analytics. (Motionloft and StreetLight donated the analytics/sensors to the Great Wall for the purposes of understanding viewership.)
Motionloft installed four sensors near The Wall, as shown in Figure 3. Only counts from the three starred sensors were used. The fourth, on Broadway, was installed to see how much foot traffic is “lost” from Broadway. These sensors collected data for several months, allowing us to compare “First Friday” activity both to other Fridays and other weekdays for November and December of 2015.
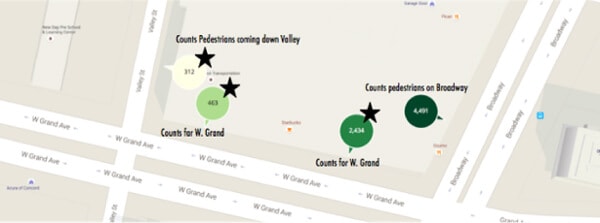
Figure 3: Screenshot from the Motionloft platform showing the locations of pedestrian sensors and counts for one section of an evening.
Though First Friday is a pedestrian event, vehicle analytics matter for two reasons.
- Drivers on Grand have a great view of the Great Wall, especially in slower First Friday traffic
- Many First Friday “pedestrians” drive to the region and park nearby
Thus, StreetLight ran two analyses – one counting vehicles that pass in front of the Great Wall, and the other looking at the characteristics of these drivers as well as those who park in the First Friday region – where are they coming from?
The Findings
The pedestrian sensors created many valuable findings. First, as shown in Figure 4, below, on a typical First Friday, The Wall is visible to ~4500 pedestrians. This is a 170% increase compared to a normal Friday.
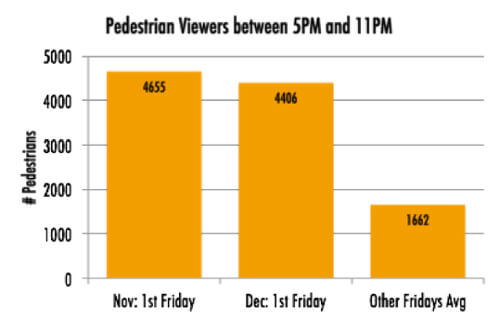
Figure 4: Total Pedestrians who can view The Wall on First Fridays compared to other Fridays in November and December.
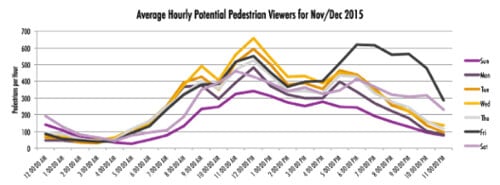
Figure 5: Average hourly pedestrian wall viewers for November and December by day of week and time of day.
In addition, as shown in Figure 5, Fridays evenings are always the busiest night-time hours for this location. Saturday evening comes in second. It is also to interesting to observe that the peak during lunch time on Wednesday and other weekdays is higher than the typical Friday night (though doesn’t last as long). If there are opportunities for The Wall that don’t need darkness to be visible, Weekday lunch could be a great future opportunity.
Finally, as shown in Figure 3, there are lots of potential viewers on Broadway who don’t make the turn down W. Grand. Similarly, lots of pedestrians make it as far as the Starbucks but not all the way past The Wall. The Wall is visible from the Starbucks door, and somewhat visible from the corner of Broadway and West Grand. This finding shows that sign boards at these two locations explaining the amazing art just a few steps away could be a good investment to drive up viewership.
The vehicular analysis also yielded many useful results. The first analysis looked at drivers passing in front of the Great Wall during the shows. We found that despite the nearby road closures, each First Friday between 4500 and 5500 vehicles can view the wall between 5pm and 11pm. This is a 16% increase over typical Fridays. While vehicles may contain more than one person (thus more than one “view”), it is also true that some drivers don’t look at the wall while driving so we did not adjust for occupancy. We note that the many stops due to crosswalks and stoplights just next to The Wall make it likely that everyone in the car will see the art.
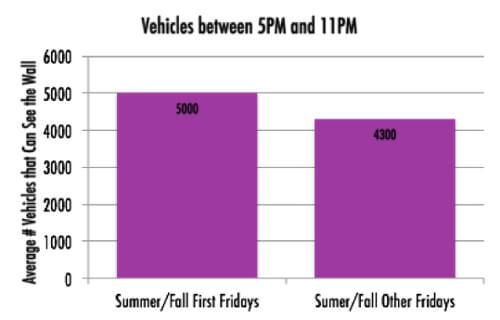
Figure 6: Vehicle viewers on First Fridays versus other Fridays in late 2015.
Next, we pulled the Pedestrian and Vehicular data together to see how viewership compared on First Fridays during the evening. As shown in Figure 7, vehicle viewers dominate in the early hours while Pedestrians are higher in the later hours. This can be useful with thinking about the timing of different elements of shows.
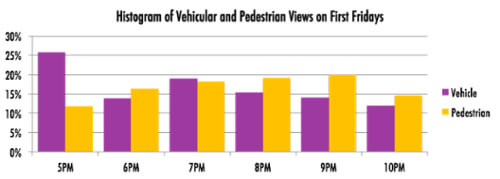
Figure 7: Share of viewers by hour of the night during First Fridays.
Lastly, as shown in Figure 8, we analyzed the origins of visitors to First Fridays. We only looked at visitors by vehicle, thus missing visitors who bike and transit to the event. We found a significant spike in parking events in the vicinity. In addition, the event draws a different type of visitor. Figure 8 shows the ZIP codes of origin for vehicular First Friday visitors. Trips originate from throughout the Bay Area, including lower income parts of West and East Oakland as well as Fremont, as well as across the Bay in San Francisco (and go beyond the map, which we zoomed in to be a little more legible). This shows the wide economic and geographical reach of public art viewed during First Fridays.
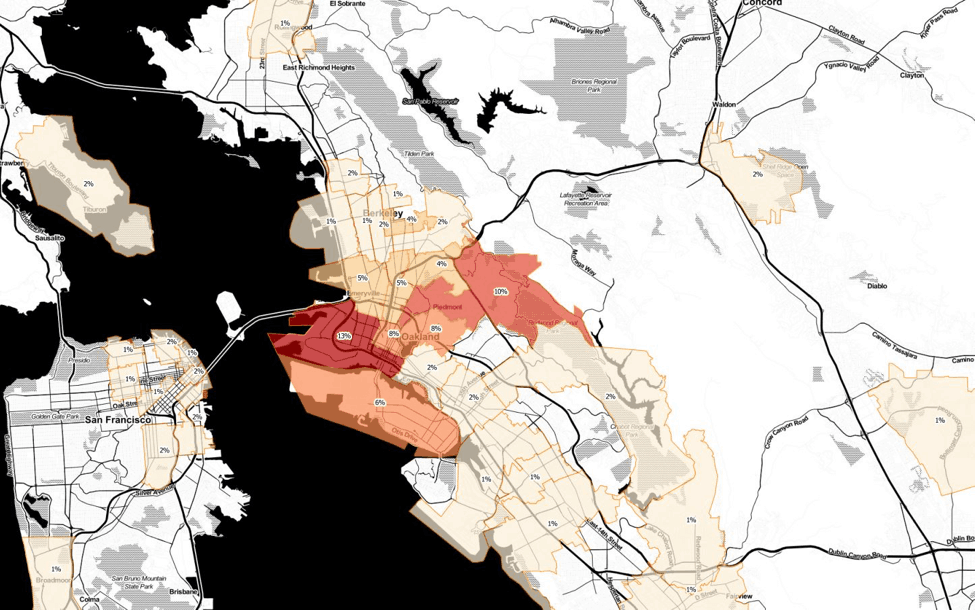
Figure 8 – ZIP codes of origin for First Friday visitors who drove and parked in the First Friday district
Figure 9 shows the difference in this trend for First Fridays compared to other Fridays. The darker orange the zip code, the more likely someone from that ZIP code is to go to the Uptown district on First Friday compared to a normal Friday. White ZIP codes are about the same. Purple ZIP codes means a First Friday visitor is LESS likely to be from that ZIP compared to a normal Friday visitor. As this map shows, First Friday pulls a different crowd – especially more people from West Oakland – a mixed income neighborhood, downtown San Francisco, Berkeley (especially UC Berkeley) and other more distant ZIP codes. In other words, First Friday pulls an even more geographically distributed crowd than a typical Uptown Friday and the Great Wall is seen by folks from all over – West Oakland, downtown San Francisco, Marin, Berkeley, and more.
Figure 9 shows the difference in this trend for First Fridays compared to other Fridays. The darker orange the zip code, the more likely someone from that ZIP code is to go to the Uptown district on First Friday compared to a normal Friday. White ZIP codes are about the same. Purple ZIP codes means a First Friday visitor is LESS likely to be from that ZIP compared to a normal Friday visitor.
Next Steps
StreetLight and Motionloft will continue to explore applications of combining our technologies and analytic approaches to help clients. For The Wall, this report will be used to help in fundraising. Finally, we’ll help The Wall analyze other potential locations for new Walls and installations, gauging which ones could have the biggest impact on the community.