Category: VMT
How Shared Automated Electric Vehicles Can Streamline Future Mobility

How Shared Automated Electric Vehicles Can Streamline Future Mobility
There is growing consensus that to stabilize the climate, we will need to rapidly shift our transportation system to electric vehicles (EVs). Meanwhile, the increased use of automated vehicles and ride-sourcing services like Uber and Lyft could revolutionize our transportation system, but also threaten to increase vehicle travel.
The culmination of these trends is the shared automated electric vehicle (SAEV), which could combine the safety and convenience of self-driving cars, the efficiency of shared mobility, and the sustainability of EVs. But there are many uncertainties about how a SAEV service might operate. How many vehicles would be needed? How much battery range will the vehicles need, and how many charging stations? And how will these fleets impact carbon emissions and the U.S. electricity grid?
What If All Cars Were EVs?
Our research team from LBNL, UC Davis, UC Berkeley, Emerging Futures, Marain, and the ICCT recently published an article in Environmental Science & Technology analyzing a hypothetical future scenario where 100% of personal vehicle mobility in the United States is provided either by private EVs or by SAEVs. We explored how such a fleet might work in practice, and assessed the impacts on carbon emissions, transportation cost, and the electric grid.
Previous studies had looked at SAEV fleets serving a small fraction of trips in a major metro area, but if SAEVs prove as cheap and convenient as anticipated, they could come to dominate the transportation sector, serving significant portions of all trips in areas ranging from urban cores to small towns and rural areas. Analyzing such a radical transition requires data at a similarly massive scale.
Large-Scale Impact Analysis
Working with StreetLight Data, we compiled data for nine combined statistical areas across the U.S. including trip volumes, distances, durations and speeds between traffic analysis zones in each area. We selected these regions to represent a wide range of geographies, densities, and urban forms. We then input this data into an agent-based simulation framework (Routing and Infrastructure for Shared Electric vehicles, or RISE) that routes vehicles to serve trips and to charge over the course of an average day, while ensuring that demand is met efficiently.
One of the main uncertainties in the impact of SAEVs is how many empty miles vehicles will travel for every mile with a passenger ( known as the “deadheading ratio”). Currently, many fleets operate with deadheading ratios of around 40%, meaning that vehicles are driving without a passenger almost half of the time.
But through our simulations with StreetLight Data, we found that this ratio depends on the density of trips in a given area – the more trips there are, the more likely each one will be served by a vehicle that is already close by. In turn, this means that in the future, if the majority of trips currently done in private vehicles are replaced by SAEVs, deadheading could fall to less than 15% in most areas.
Figure 1. Ratio of empty miles to total vehicle miles (deadheading ratio) in each simulated region versus square kilometers per trip, a measure of trip density. Multiple points for each region represent scenarios with different levels of trip volumes. The dotted line shows a square root regression fit.
We then input these results into an optimization model (Grid-integrated Electric Mobility or GEM) that determines the least-cost combination of vehicles and chargers. The model also takes into account the different cost and carbon emissions associated with charging at different times of day, and identifies the optimal way to schedule charging while still keeping travelers satisfied. Each of these steps involves complex trade-offs; for example, charging is both cheap and clean in the middle of the day when solar generation is high, but many vehicles are needed to serve trips during that time.
One Automated EV = 11 Personal Vehicles
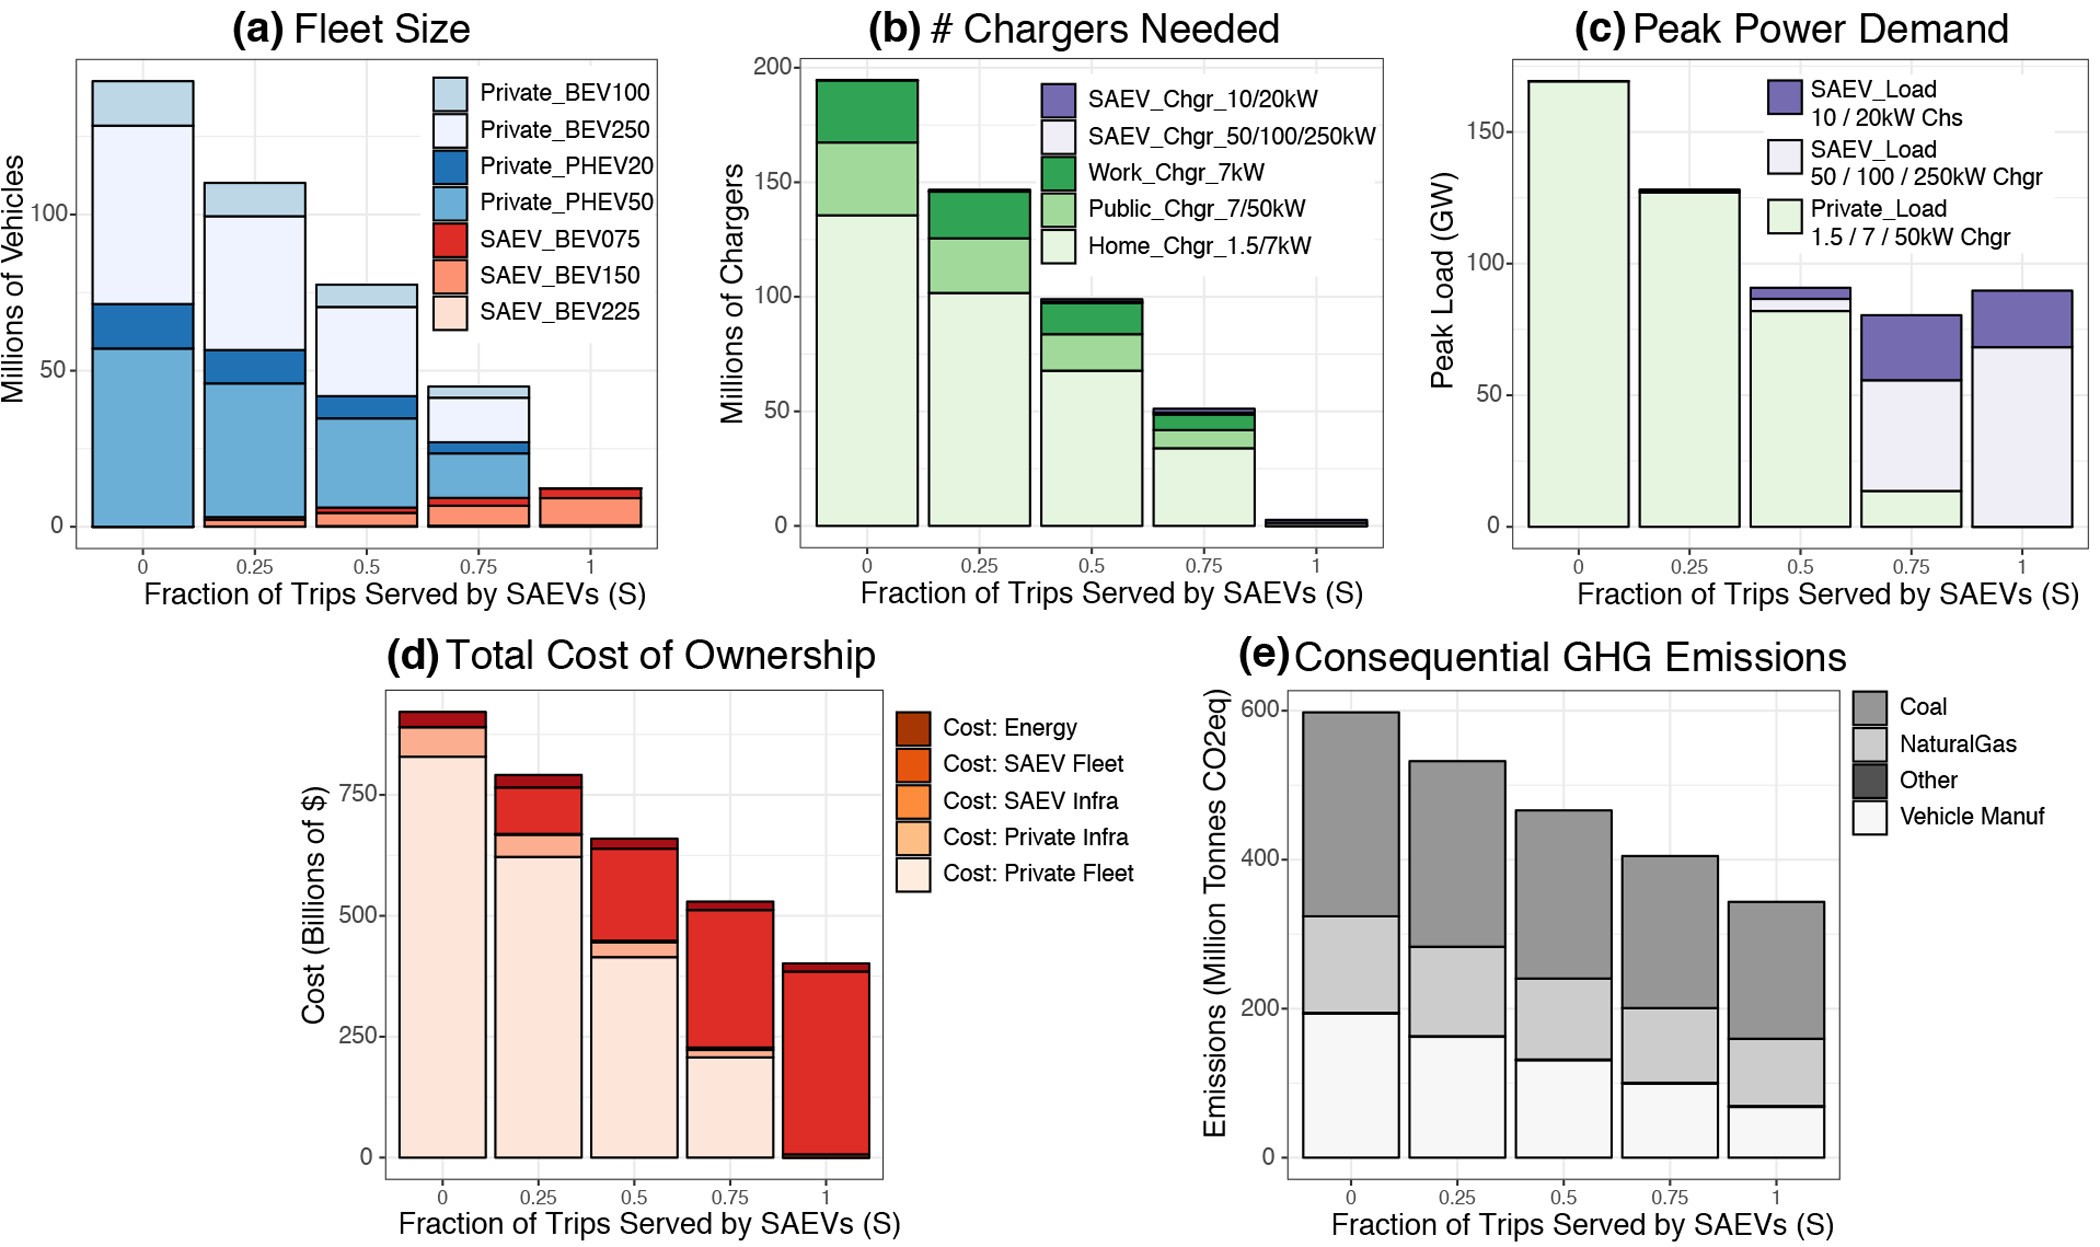
Through this analysis, we found that SAEVs could dramatically reduce both the cost and environmental impact of personal mobility. Due to the lower deadheading rates, we found that each SAEV could replace an average of 11 private vehicles. While rural regions would require longer-range battery capacities than urban regions, we found that only 4% of the SAEV fleet would need a range of 225 miles to satisfy all trips in these areas, and SAEVs in urban regions would be able to serve all trips with a mixture of 75- and 150-mi. range vehicles, and virtually no longer-range vehicles.
In turn, these efficiencies could reduce cost by over half, saving $570 billion per year nationwide. Decreased vehicle manufacturing would reduce carbon emissions by almost half compared to private EVs, and 70% compared to gasoline vehicles, or 800 million tons of CO₂ per year. Because the fleet would charge at the cheapest times, peak electricity demand from transportation could be reduced by almost half, almost as much as optimizing the charging schedule of each individual private EV.
Figure 2. (a) Fleet size, (b) numbers of chargers, (c) peak power demand, (d) total cost of ownership, and (e) consequential GHG emissions versus fraction of trips served by SAEVs.
There are many uncertainties as to how or when this future might come to be, including the safety of automated vehicles, implications for labor, and consumer preferences for shared versus private transportation. But through large-scale modeling facilitated by big data, this study shows how these technologies might operate if adopted at a national scale and provides some insight into the potential for large economic and environmental benefits.Summarized from “Private Versus Shared, Automated Electric Vehicles for U.S. Personal Mobility: Energy Use, Greenhouse Gas Emissions, Grid Integration, and Cost Impact” by Colin J. R. Sheppard, Alan T. Jenn, Jeffery B. Greenblatt, Gordon S. Bauer, and Brian F. Gerke, Environmental Science & Technology 55, no. 5 (March 2, 2021): 3229–39.
Key Transportation Metrics for Bridge Maintenance

Key Transportation Metrics for Bridge Maintenance
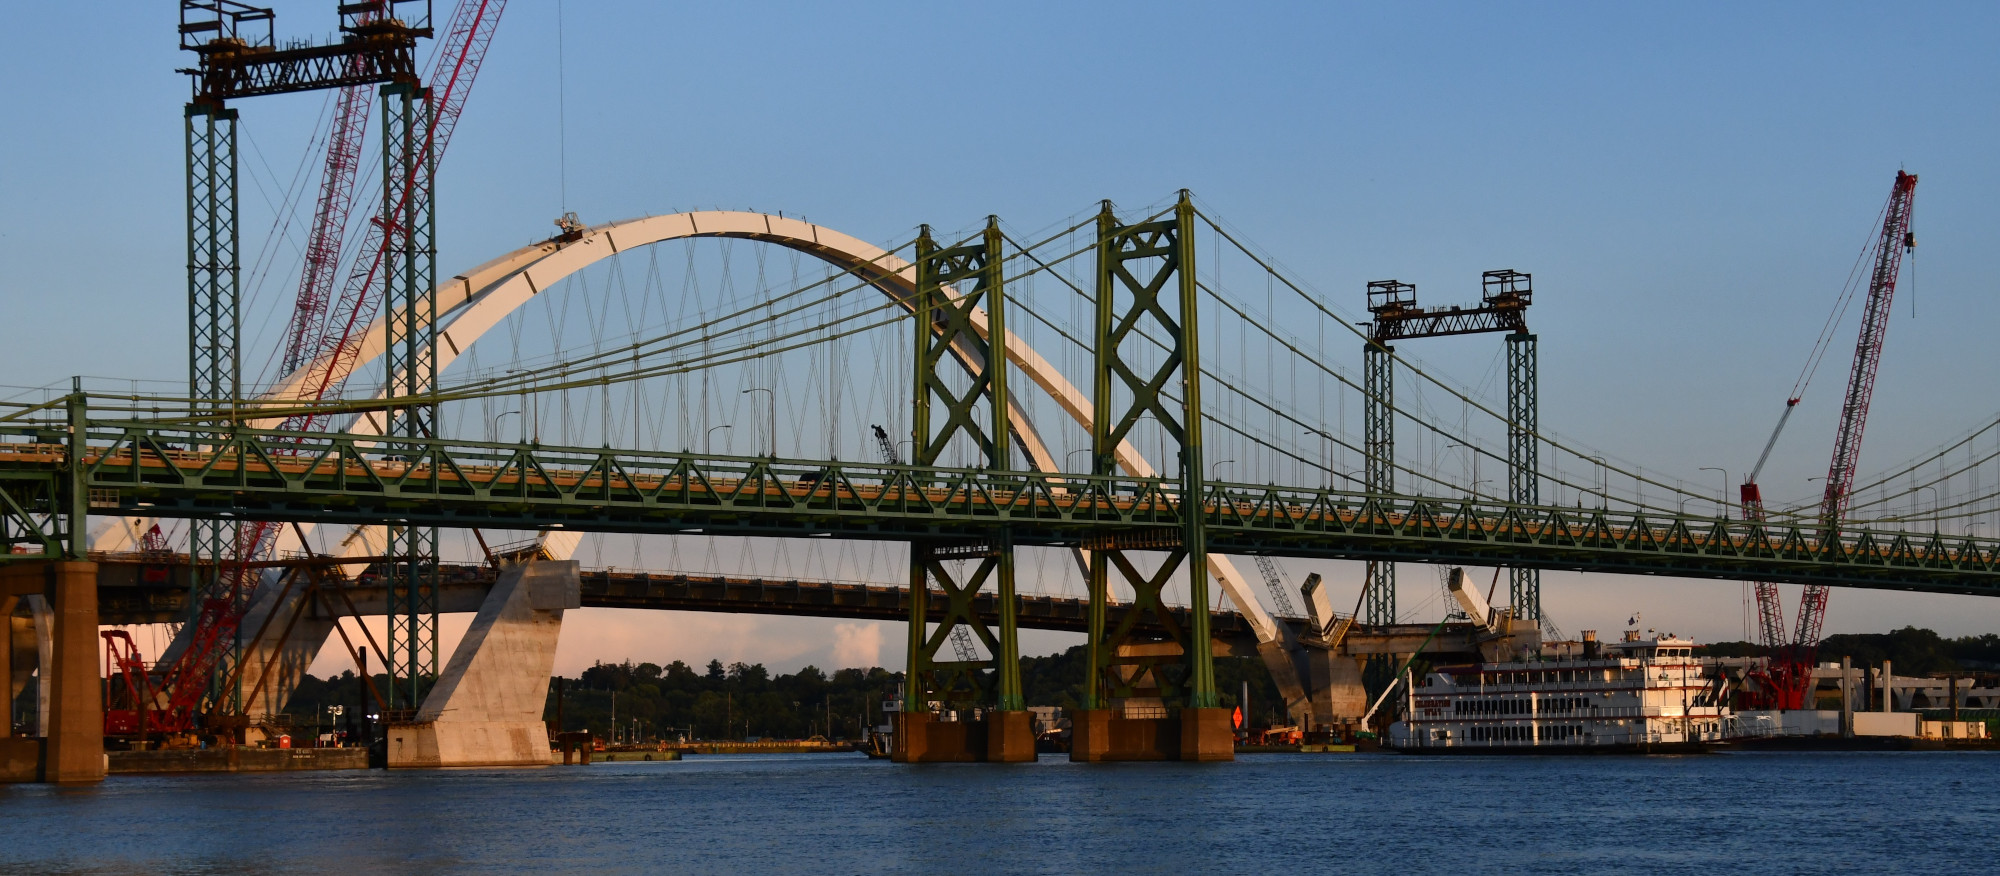
After moving to Davenport, Iowa, a month ago, I started exploring the area with trips southeast across the Mississippi River to Moline, Illinois. The drive is only five miles one way, but the massive I-74 bridge construction project creates some detour challenges, and this sparked my curiosity. A few minutes in StreetLight InSight® answered my questions about where traffic was detouring (surprise: not the suggested route), and what impact that might have for several of the other aging bridges across that section of the mighty Mississippi.
One lane of the new bridge is open now, but when I first moved to the area there was a detour both ways. Going southeast, to Moline, the suggested detour was easy to take. On the way back, however, my GPS always avoided the suggested detour, and sent me across three different bridges for the return northwest trips to Davenport.
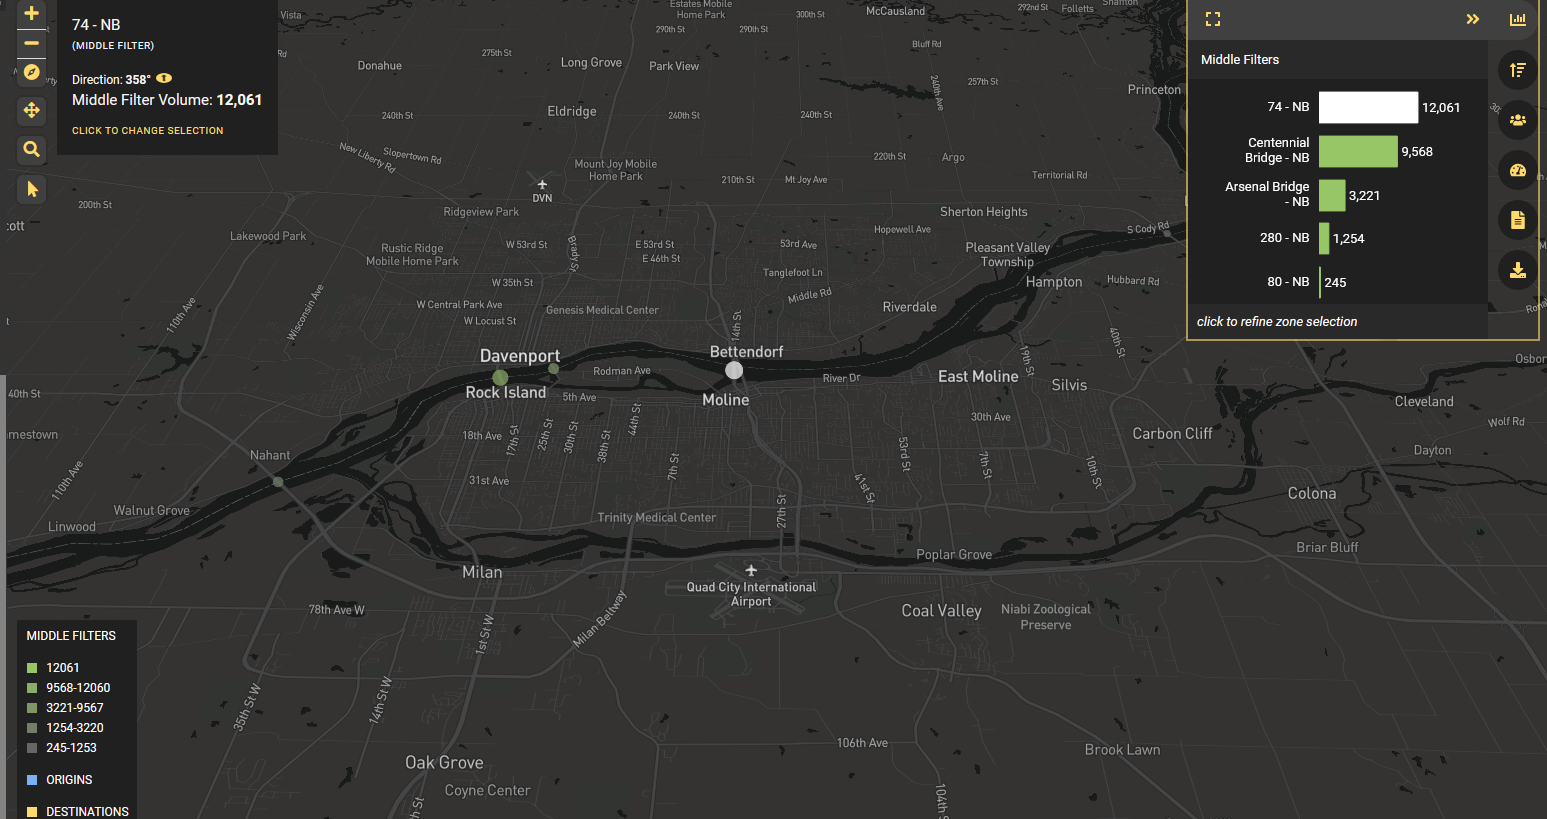
I wasn’t the only one. My analysis showed that local trips were taking the I-74 detour southeastbound to Moline, but northbound trips to Davenport via the recommended detour dropped by ~17%. These northbound trips seemed to be primarily distributed between the Centennial and Arsenal Bridges.
The Arsenal Bridge is particularly interesting because the published AADT from Iowa DOT (IDOT) for the bridge is 7,500, which means more than 1,200 northbound trips crossed the Arsenal Bridge daily. Understanding the increased wear to a bridge like the Arsenal can be important, as it is an older bridge built in the late 1800s.
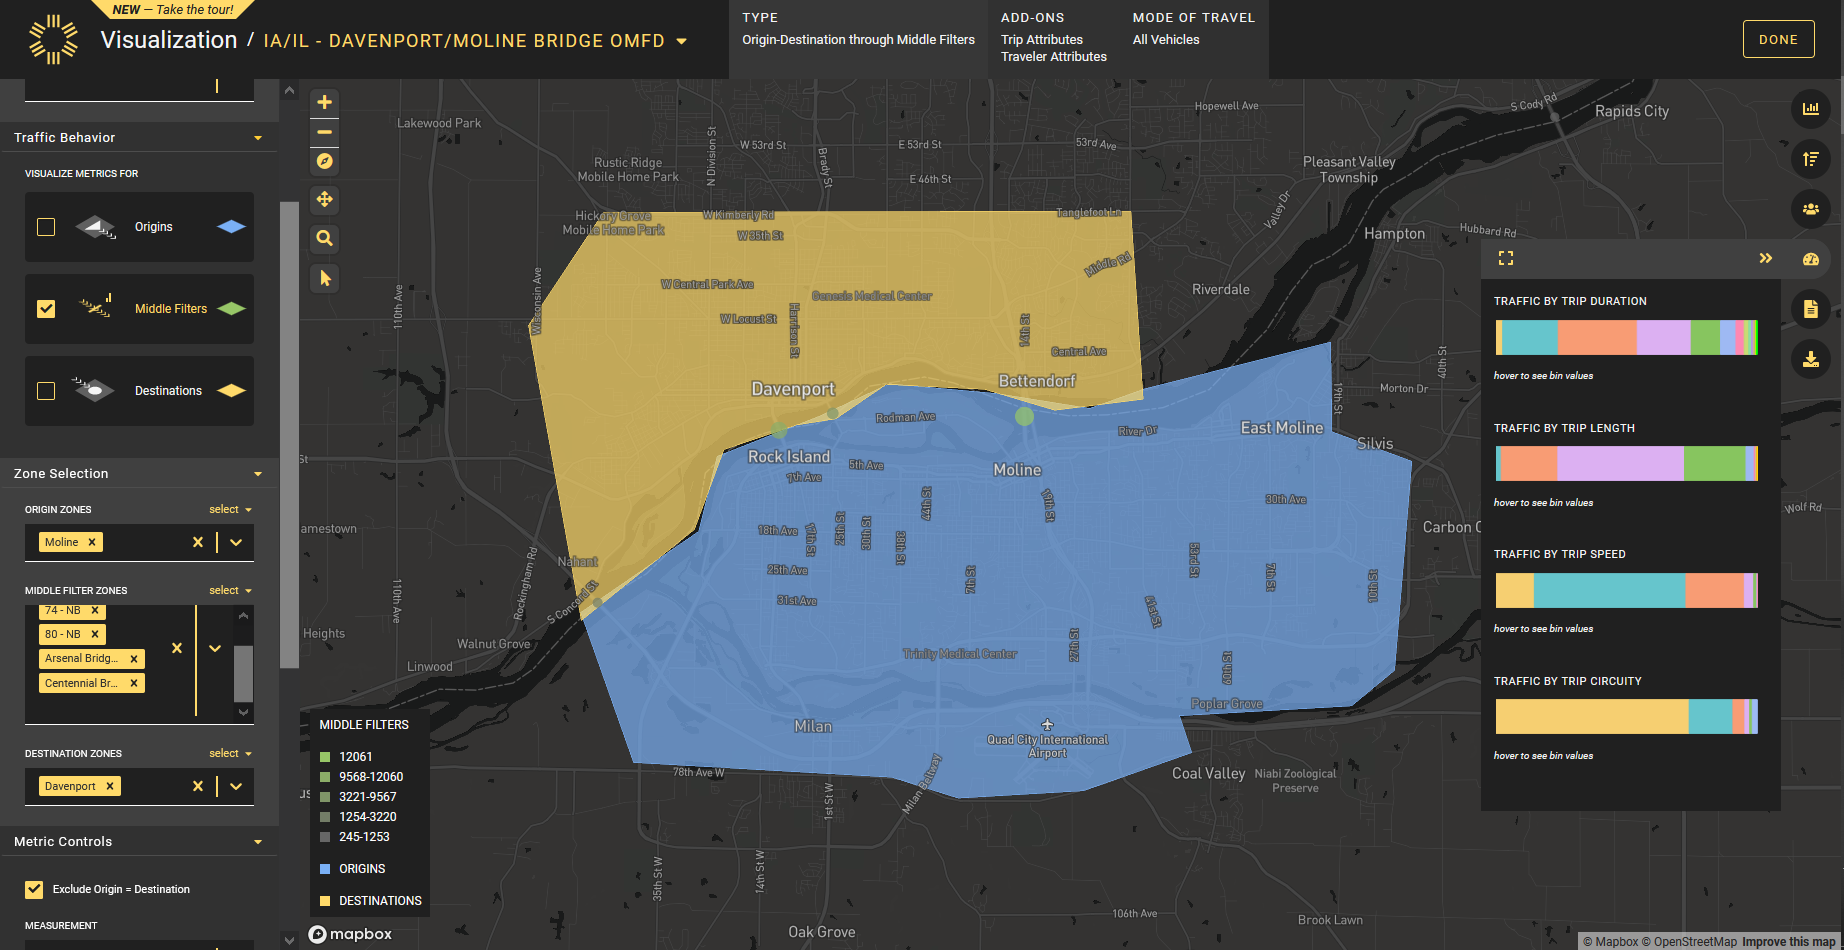
Figure 1: Using StreetLight InSight® to select origin and destination zones for analysis.
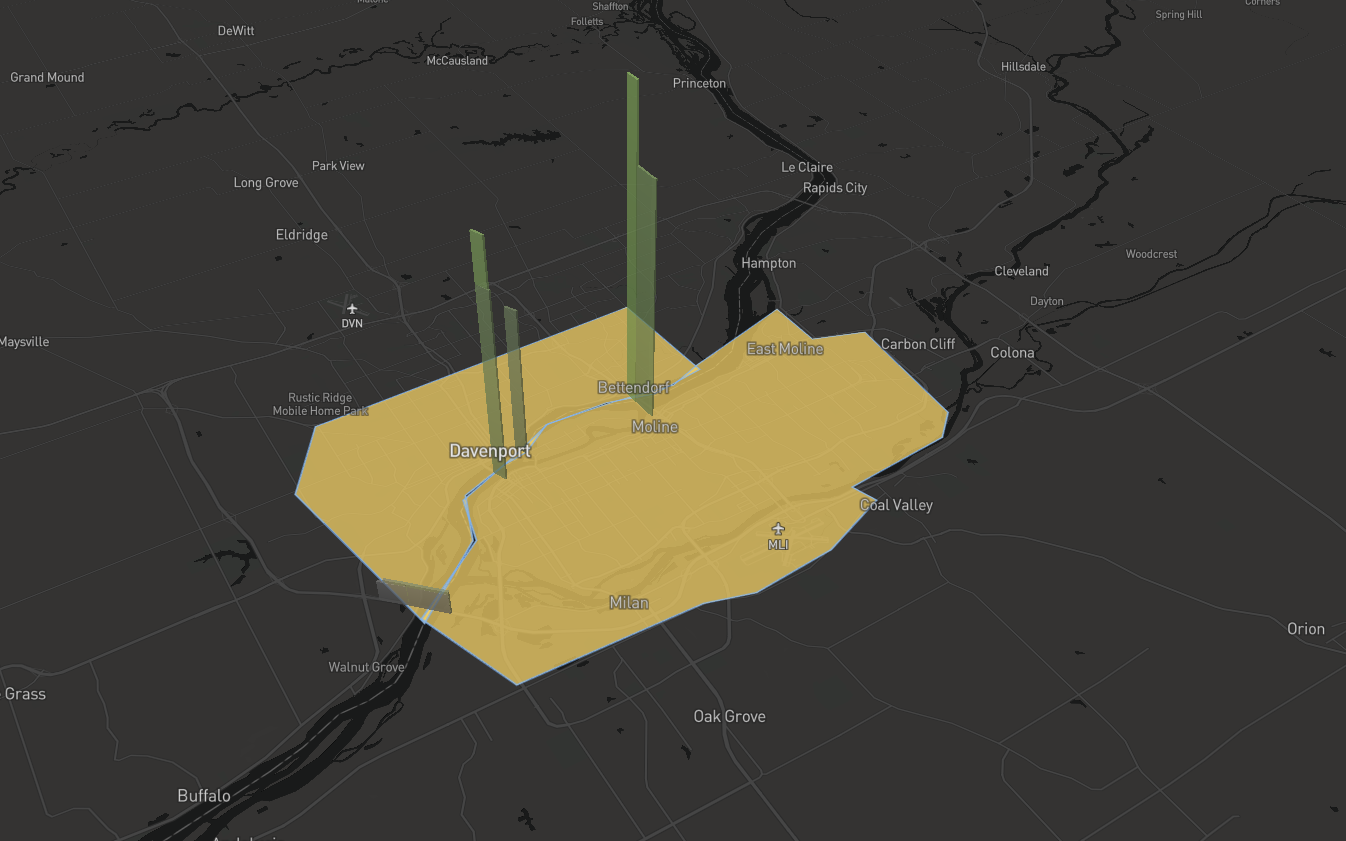
Figure 2: Middle filters on the bridges between origin and destination zones capture travel across each bridge.
To run the analysis, I geofenced the Moline and Davenport areas to identify local trips, adding the bridges to identify all alternate routes taken. Moline and Davenport were used as origins and destinations, and gates on the bridges were used as middle filters.
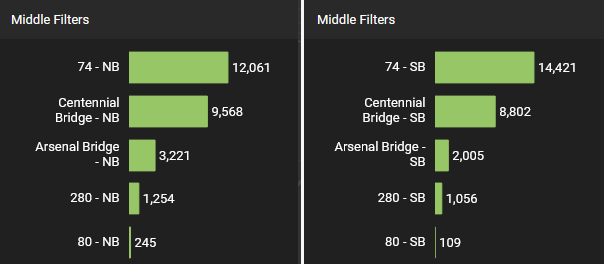
Figure 3: Statistics for northbound and southbound travel via five middle filters.
On the left are northwestbound movements affected by the poor detour access and on the right are southeastbound movements. Looking at a typical weekday in 2019 (to capture average traffic pre-pandemic), there are about 2,500 northwest trips displaced to other bridges to avoid the detour. These vehicles are choosing routes that add miles to their trip distance, potentially adding more congestion on local roads.
Figure 4: The analysis delves into trip attributes including trip length and trip distance.
Arsenal Bridge is the most affected bridge – average trip duration via that bridge is 27 minutes heading southeast, and almost 29 minutes going northwest, a pretty significant impact on trips taking the bridge.
Why does this matter?
Travelers choosing longer routes over a marked detour will create more VMT for a region, which raises emissions. And more driving on older bridges will create more wear and tear, requiring more maintenance.
Agencies armed with this data may be able to adjust detour routes, identify traffic sources, and adjust resources to maintain affected roads and bridges. Me, I’ll just be happy when the I-74 bridge project is finally completed!
Surprising Changes to Traffic Congestion in Urban Areas

Surprising Changes to Traffic Congestion in Urban Areas
Analyzing travel in major metropolitan areas throughout the U.S. shows surprising new patterns that only a granular analysis can decipher. Specifically, the data shows that while total miles driven are similar to February 2020, big changes have arisen in when and where trips occur in metropolitan areas.
Essentially, we see the same vehicle miles travelled (VMT) in metro areas, but without the same level of congestion, and in new locations. This decoupling of VMT and urban-area congestion shakes many of the foundations of our models and decision tools about transportation infrastructure, investment, funding, mode choice, and more.
Significant Shift in Rush-Hour Trips
In the past, when we have looked at trips by time of day (especially weekday trips), we have always seen a “bi-modal” trip distribution. These are our traditional peak AM and peak PM periods, coinciding with commuting to and from work for many employees.
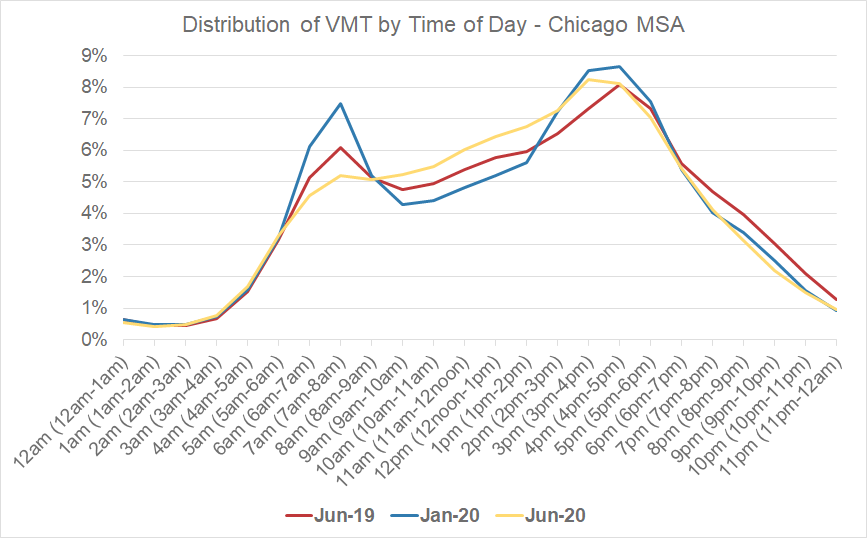
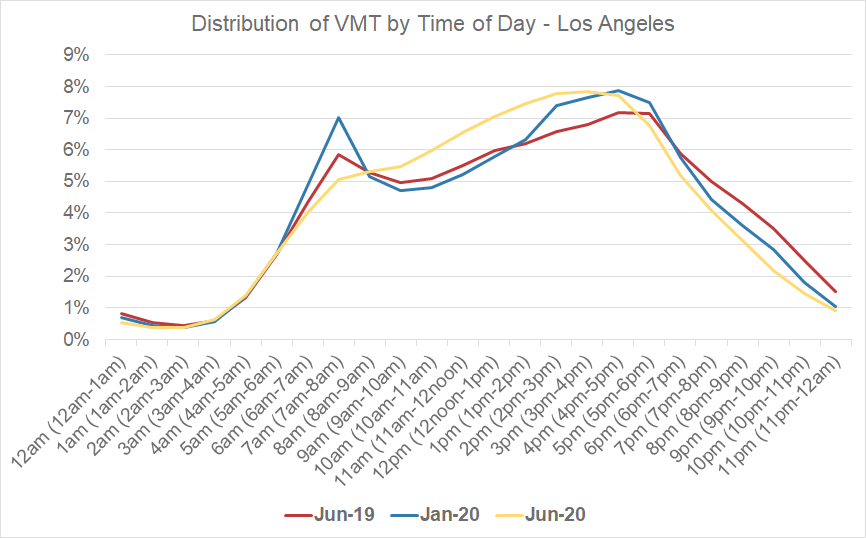
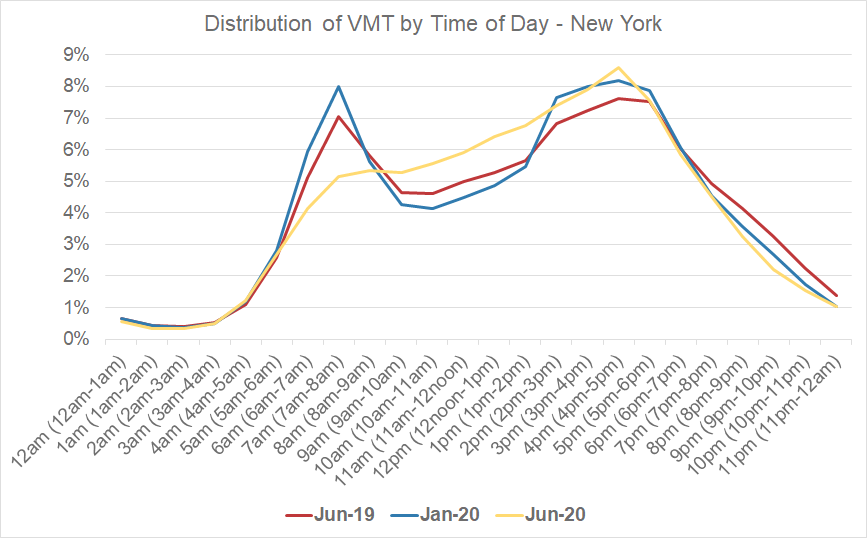
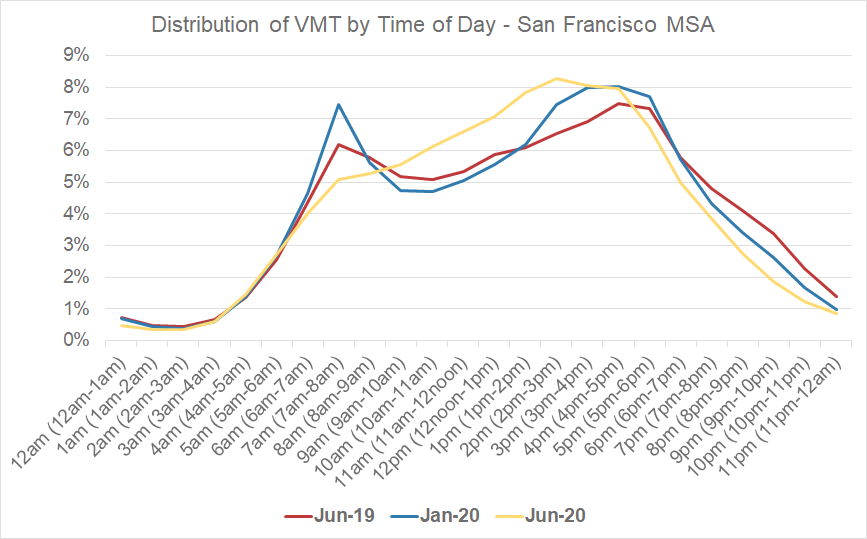
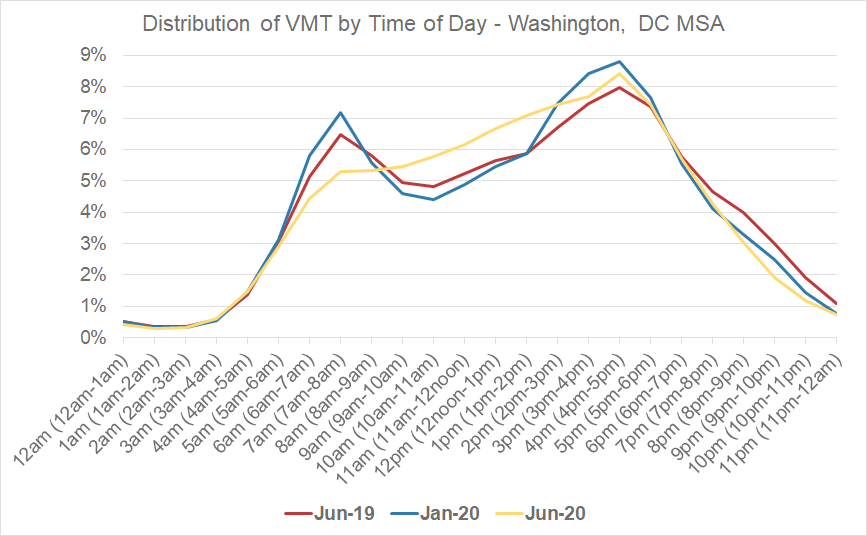
Now, when we examine the hourly distribution of VMT in metro areas, we see a “smoothing” of peak AM travel time during what has traditionally been the morning commute period. These trips are shifting (or being replaced) with more trips happening during the midday hours.
For five separate MSAs, we looked at the distribution of VMT by time of day for average weekdays in June 2019 and January 2020 (pre-COVID), compared to June 2020 (post-COVID). In all cases, we see the bi-modal peaks in the pre-COVID periods, as well as the reduction of the morning commute peak in the post-COVID period across all five MSAs.
We still see peak PM travel behavior, along with more VMT in the afternoon than before.
Figure 1: Hourly VMT analysis for the Chicago MSA.
Figure 2: Hourly VMT analysis for the Los Angeles MSA.
Figure 3: Hourly VMT analysis for the New York MSA.
Figure 4: Hourly VMT analysis for the San Francisco MSA.
Figure 5: Hourly VMT analysis for the Washington, D.C. MSA.
Decentralized Urban Travel
When we examine where post-COVID trips originate, we see a decrease in metro area trips in city centers, and an increase in trips farther away from the traditional downtown/core urban areas.
Highlighting the Chicago and Washington, D.C. MSAs at a granular spatial level, we found that the areas with the largest decrease in trips between 2019 and 2020 were in the core urban/downtown/central business districts of the MSAs. Areas in the less densely populated outer regions of the MSAs saw actual increases in trips, year over year.
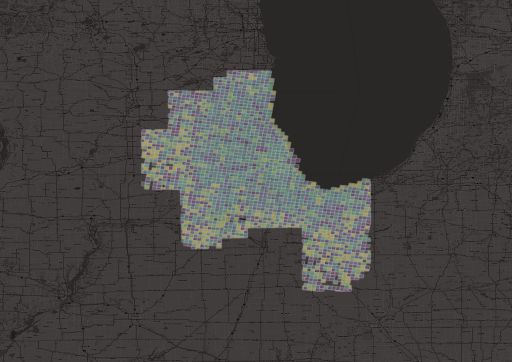
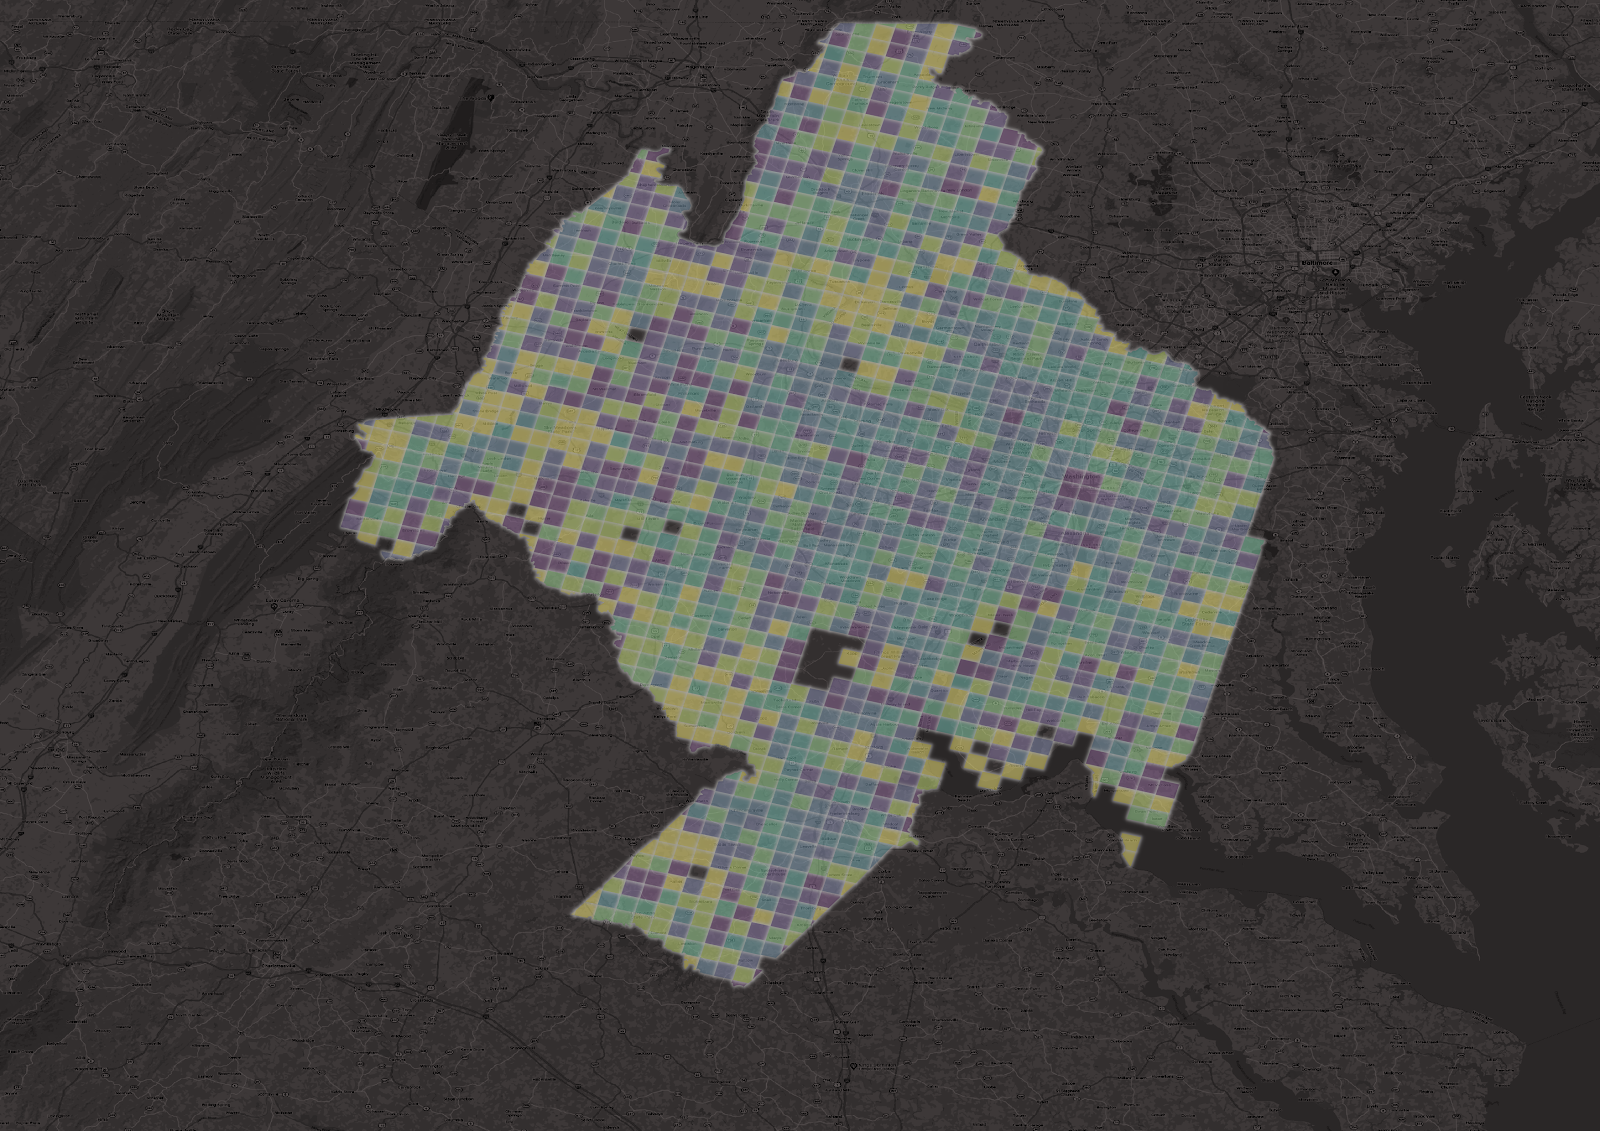
In the image below, we have plotted the percent change in trip starts throughout the Chicago MSAs, in 3km grids. The darker the shading, the higher the percent decrease in trip starts. The light-yellow represents increases in trip starts in June 2020 compared to June 2019.
Figure 6: Overview of change in trip starts from June 2019 to June 2020 for the Chicago MSA.
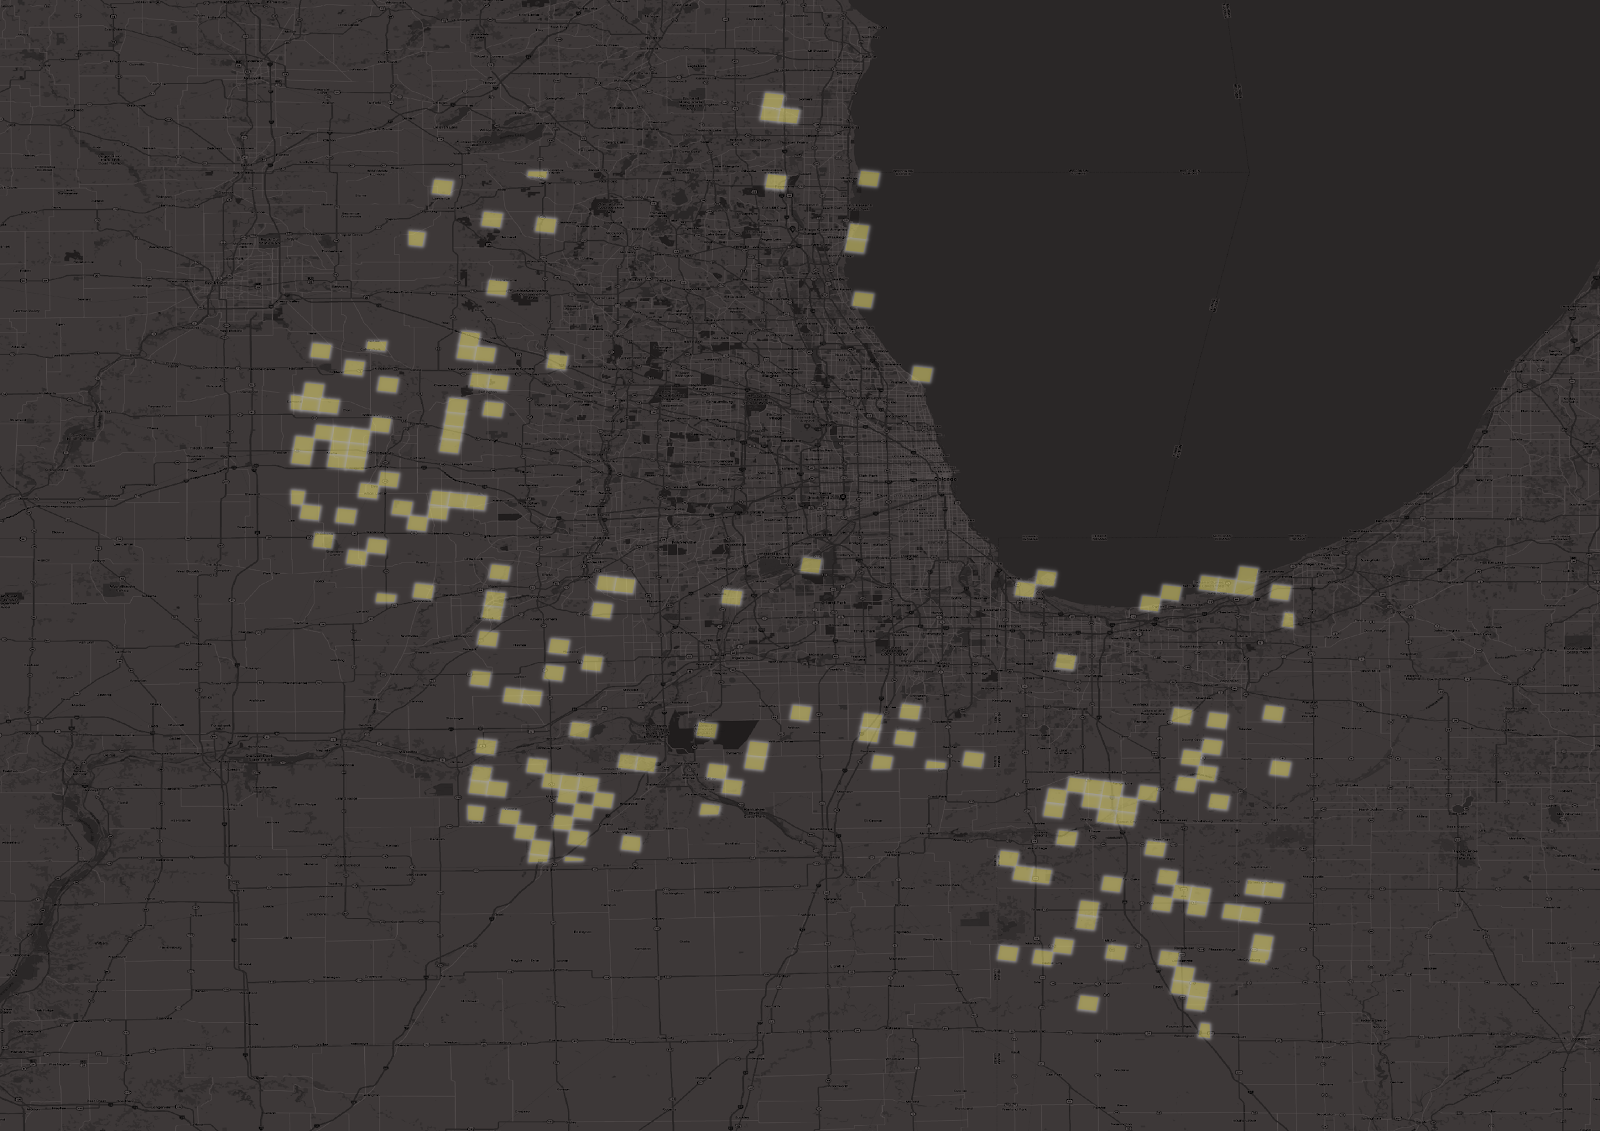
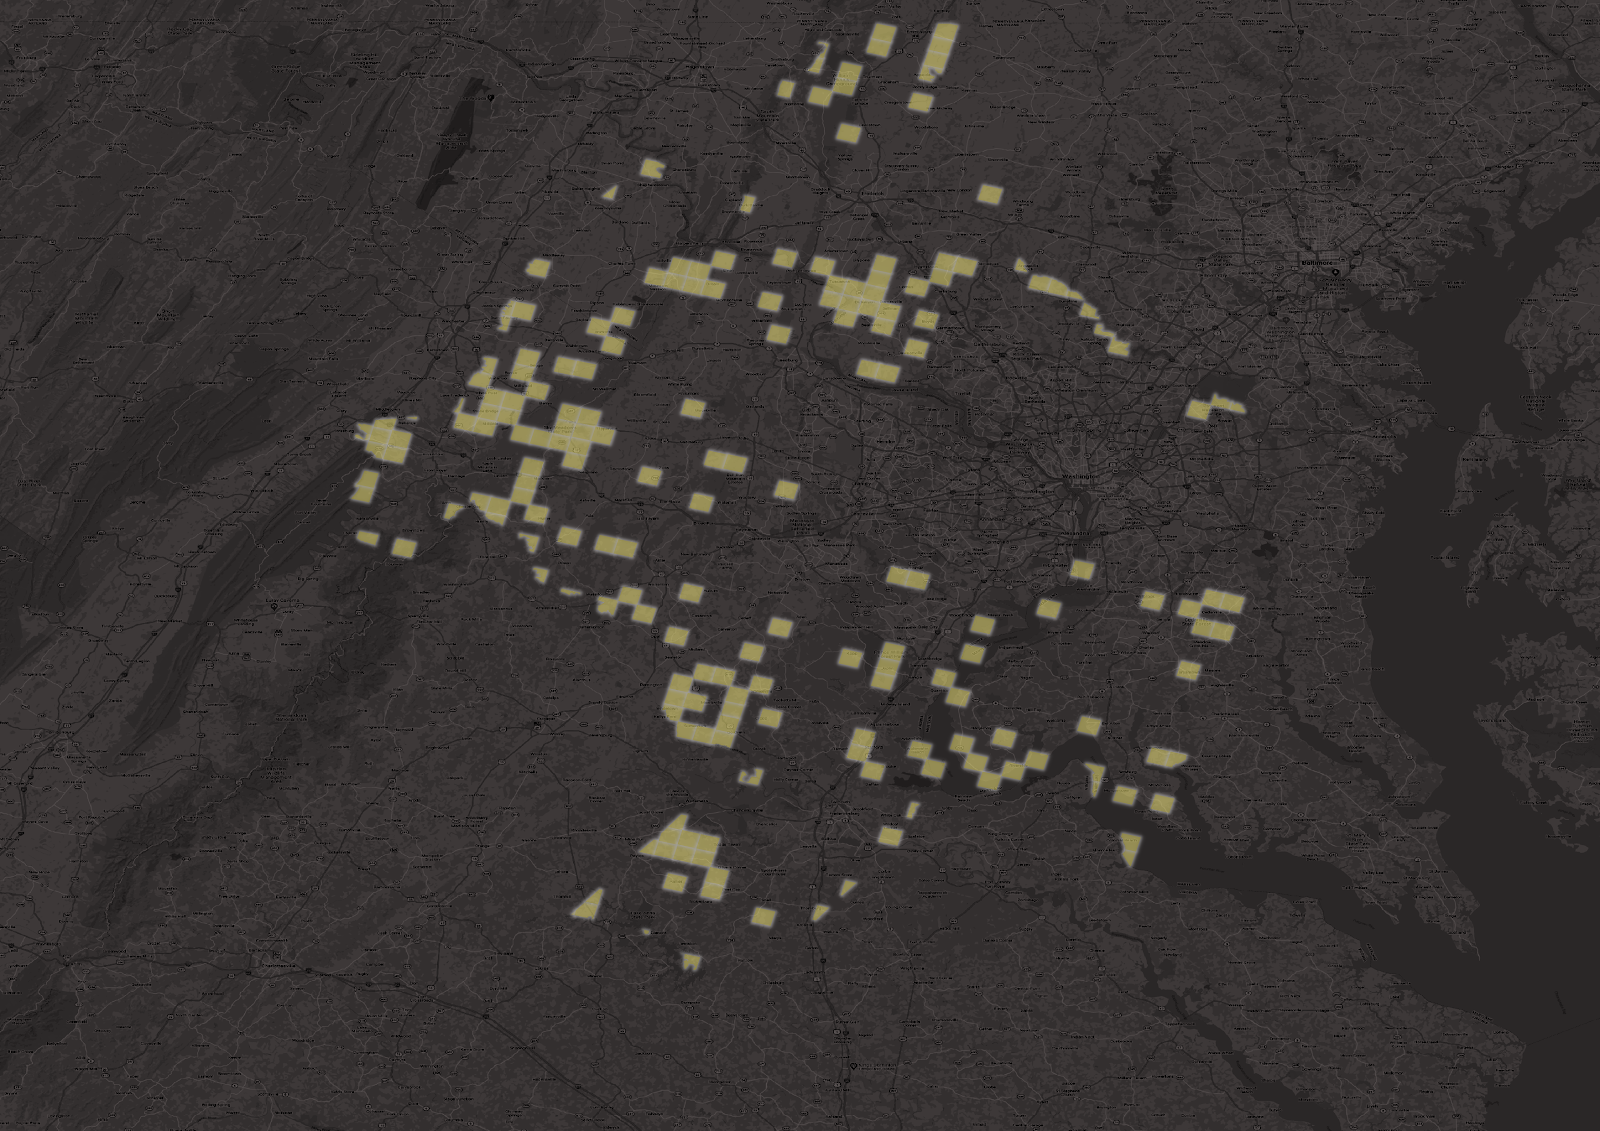
When we plot just the grids where trip starts have increased year over year, we see there is a large concentration of this activity in the outer regions of the Chicago MSA.
Figure 7: Chicago areas with trip increases from June 2019 to June 2020.
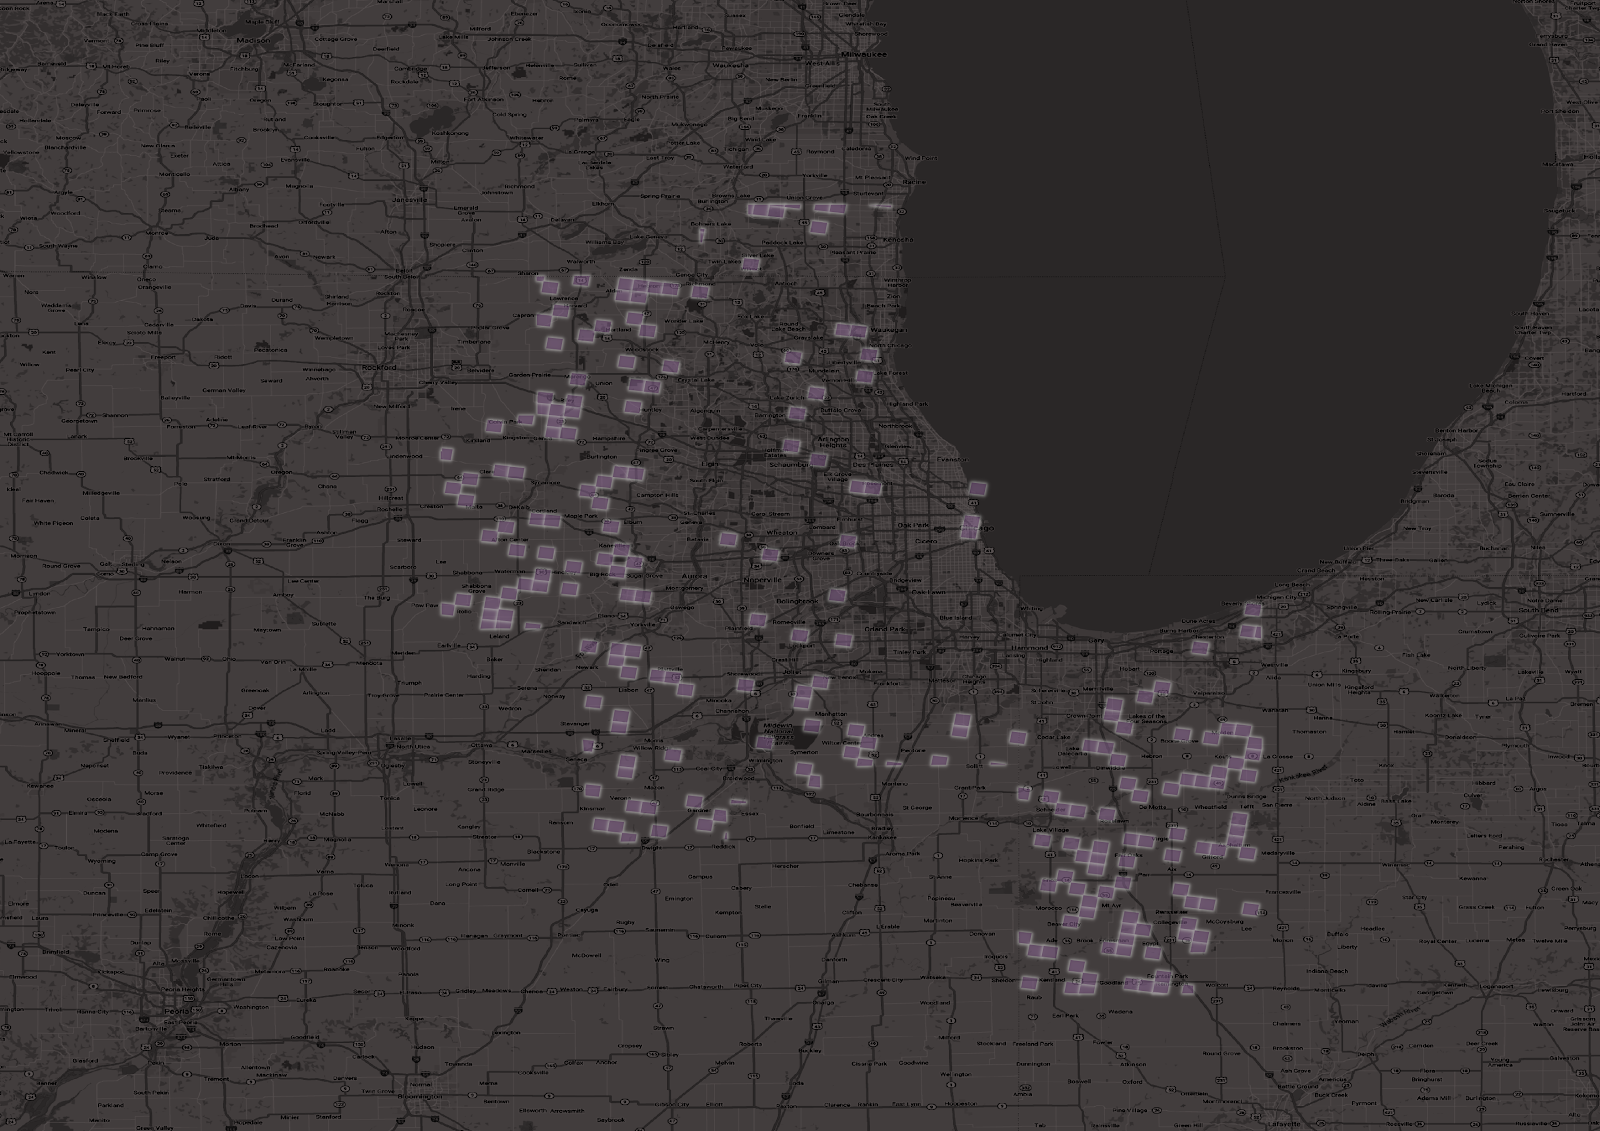
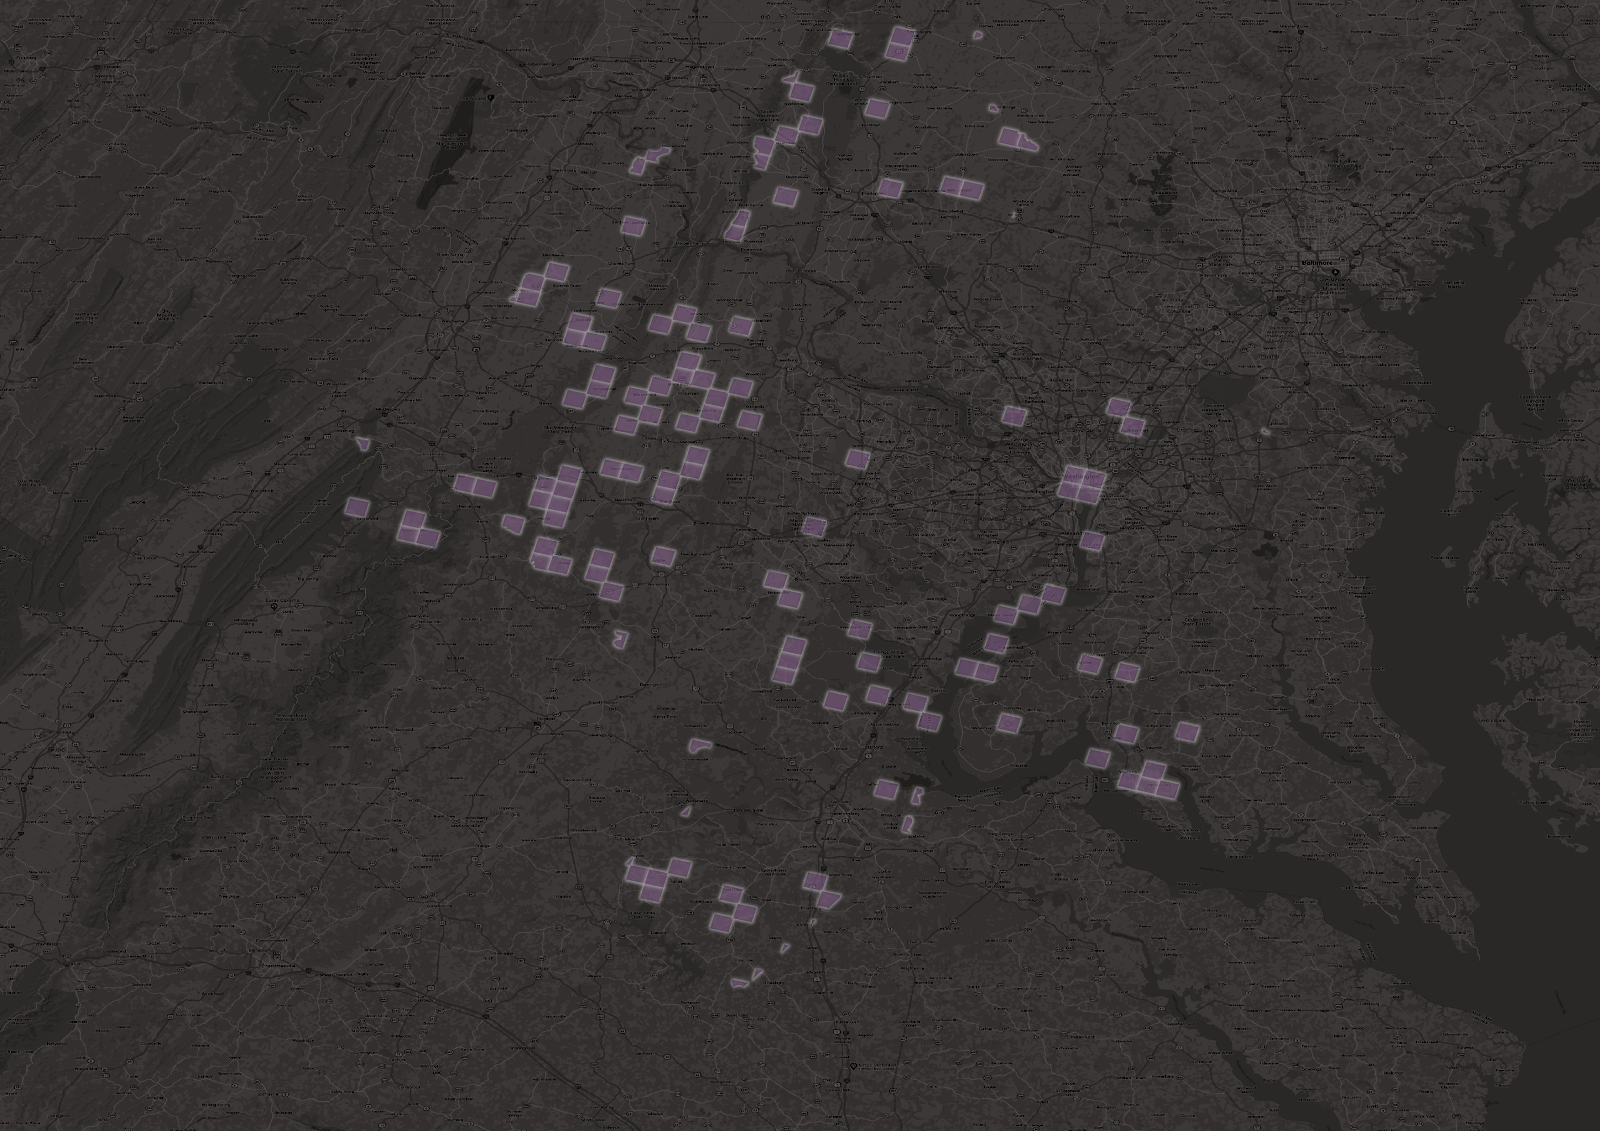
Conversely, when we plot the areas with the largest percent decreases in trip starts, we see locations closer to Chicago’s urban core.
Figure 8: Chicago areas with the largest trip decreases from June 2019 to June 2020.
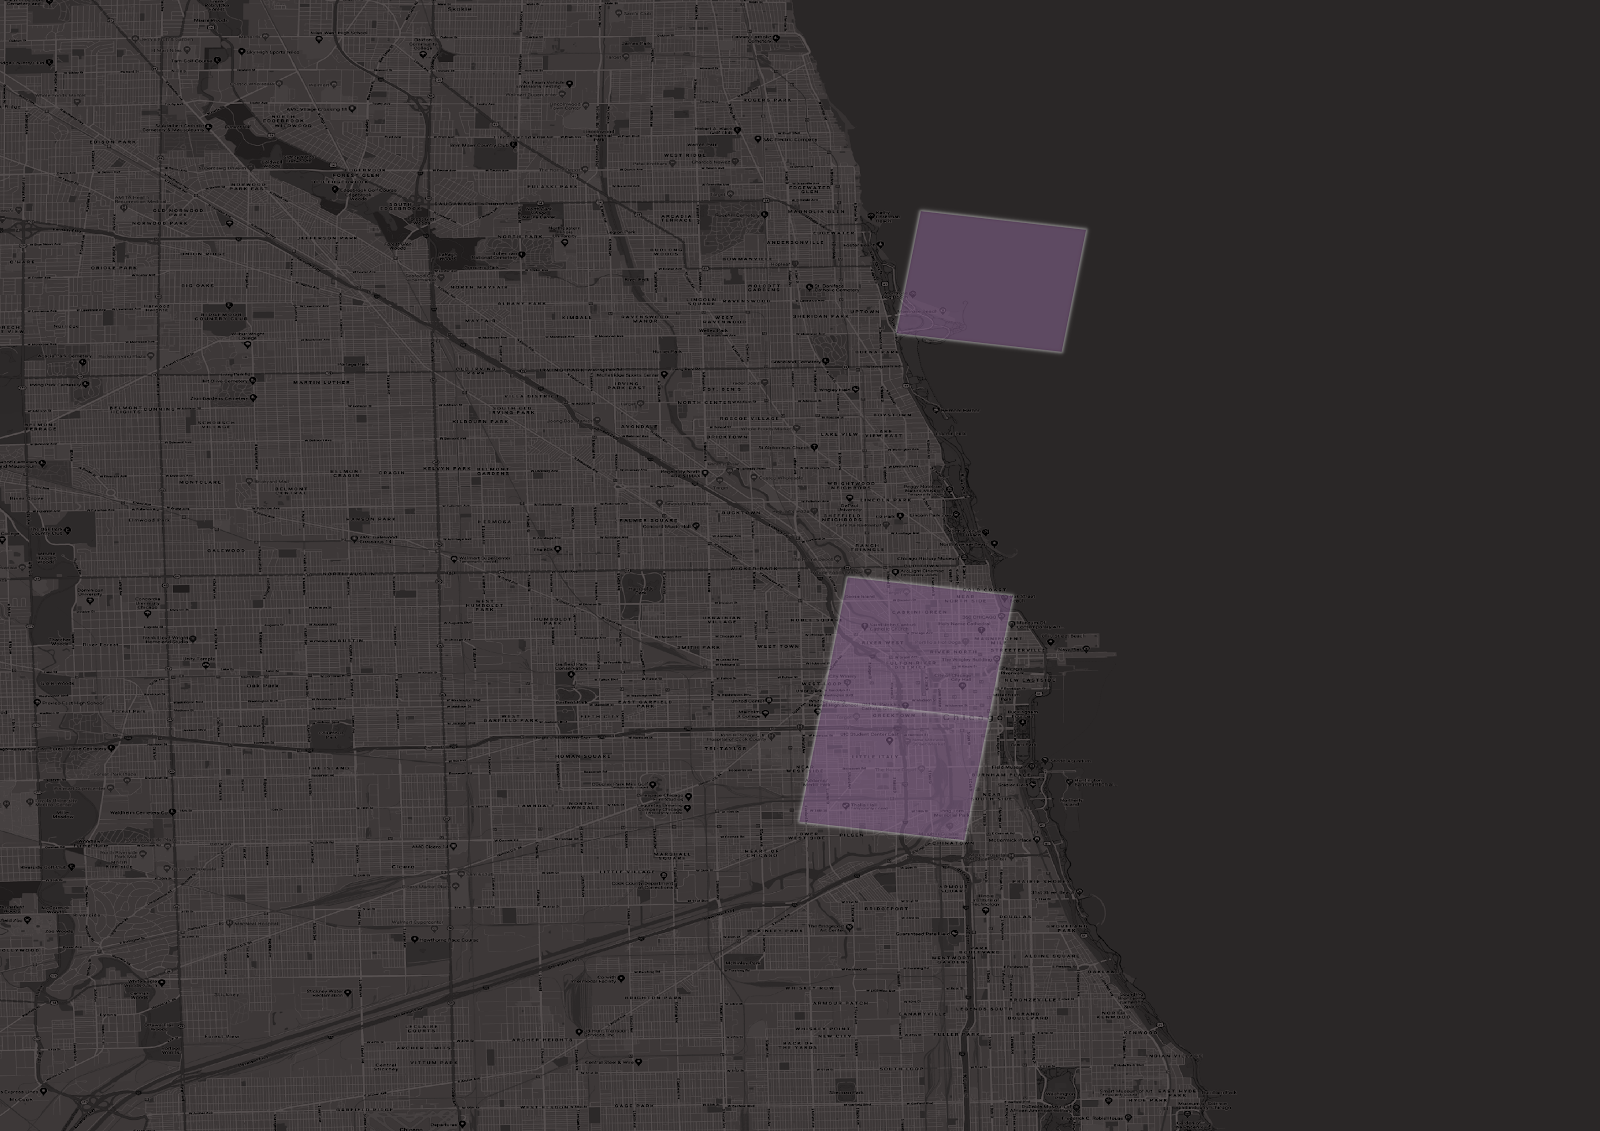
When we zoom in on Chicago’s urban core, we see it is included.
Figure 9: The Chicago MSA urban core shows significant decreases in trip activity from June 2019 to June 2020.
When we examine the Washington, D.C. area, we see a similar pattern as well.
Figure 10: Overview of change in trip starts from June 2019 to June 2020 for the Washington, D.C. MSA.
Figure 11: Washington, D.C. areas with trip increases from June 2019 to June 2020.
Figure 12: Washington, D.C. areas with largest trip decreases from June 2019 to June 2020.
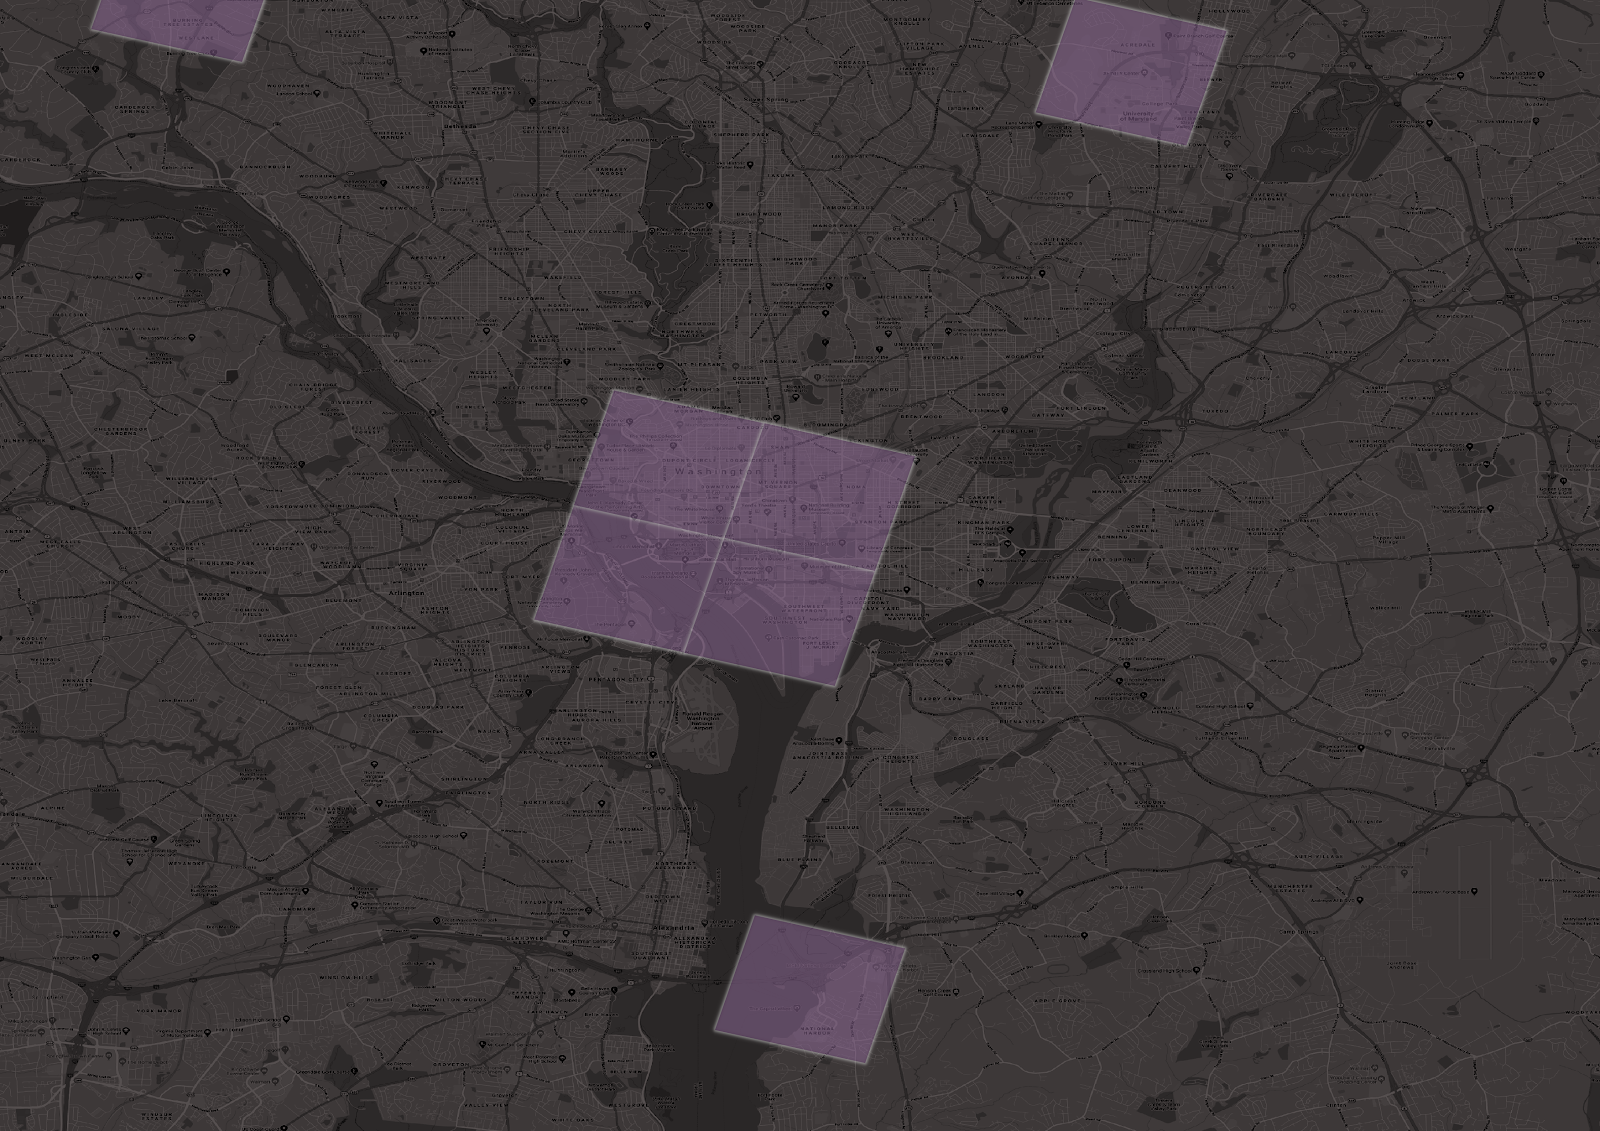
Figure 13: The Washington, D.C. MSA urban core shows significant decreases in trip activity from June 2019 to June 2020.
Monitoring Future Changes
Transportation models have relied on assumptions about established time-of-day trip patterns, but these patterns are changing. It is extremely important to monitor travel patterns and behaviors during these times — and to dig deeper with hourly and location-specific metrics. Even when our quarantines and work-from-home requirements relax, it’s possible that some of these behavior shifts will stick. Understanding the new and emerging behaviors will help transportation professionals plan for the future in a more effective manner.
How Work-From-Home Affects 2020’s Vehicle Miles Traveled Statistics

How Work-From-Home Affects 2020’s Vehicle Miles Traveled Statistics
Although most statewide pandemic-related stay-home orders have been lifted or reduced, many organizations have announced that they will continue work-from-home policies through at least the end of the year, and perhaps into 2021. How will this affect your agency and locality?
We’ve noted many benefits of stay-home policies, such as safer streets for bicyclists and pedestrians, reduced noise, congestion, and air pollution. But we’ve also seen a major drawback: For some government agencies, fewer vehicle miles traveled (VMT) means less gas-tax-related funding.
We turned to Big Data to better understand how work-from-home policies impact VMT. Here, we share how planners can identify, monitor, and predict commuting travel fluctuations in order to estimate the impact on VMT.
VMT Monitor Reveals Ongoing Fluctuations
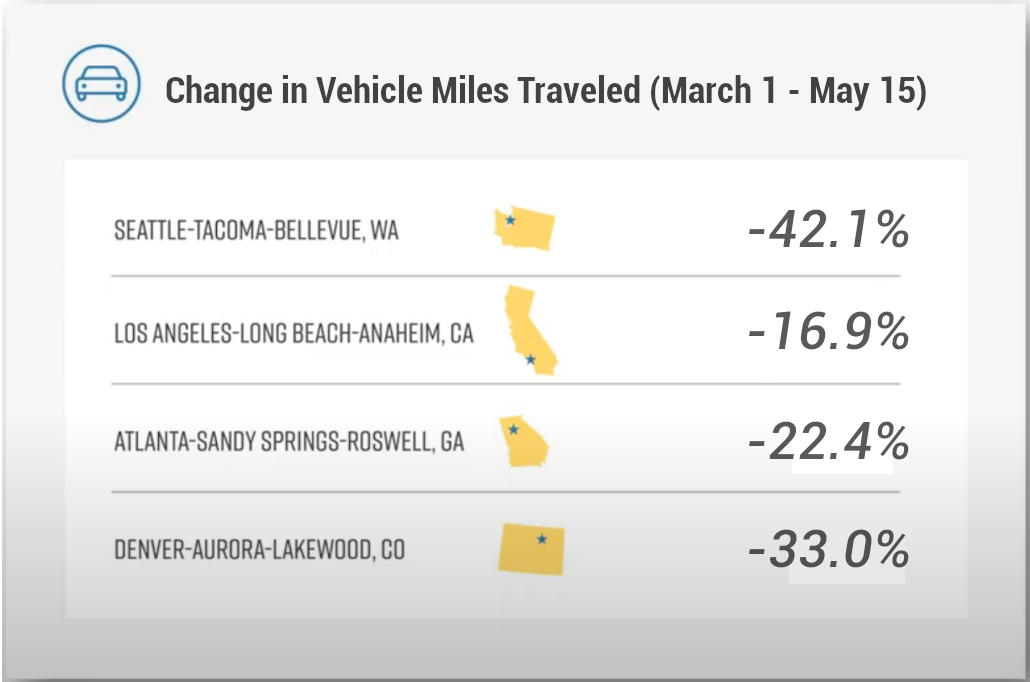
Many U.S. cities have experienced significant decreases in VMT since the pandemic started. We have been tracking these changes by using the StreetLight VMT Monitor, which provides county-by-county VMT measurements for each day since the COVID-19 crisis began, as well as a change from the baseline. We saw a 25% average drop in VMT nationwide from March 1st to May 15th, when most cities had stay-home orders in place.
We know intuitively that total VMT reduction during the pandemic can be attributed not just to work-from-home, but also school closures and less travel to run errands. But since employers announce work-from-home policies, that traffic is a somewhat known entity that agencies can predict and plan for (unlike errand travel), and provides a helpful metric for planners.
Seattle Study: Top Employers Driving Traffic
We delved into Seattle’s traffic fluctuations because the Seattle area has four major companies (Amazon, Microsoft, Boeing, and REI Co-Op) that employ over 150,000 people in Seattle. Together, that’s more than 6% of greater Seattle’s working population. We hypothesized that commuting patterns for these major employers would heavily impact Seattle-area VMT.
Measuring commuting for these four companies normally would have required fielding a survey or placing sensors at the business entries — both difficult and expensive during the best of times, but particularly problematic during a pandemic.
Instead, we used StreetLight InSight® for three analyses that gave us data before and after COVID work-from-home policies:
- Top Routes
- Zone Activity
- Zone Activity with Home/Work Location.
The Top Routes and Zone Activity analyses allowed us to visualize the road segments with the most traffic to and from these employment centers, then measure the trip volumes along these segments.
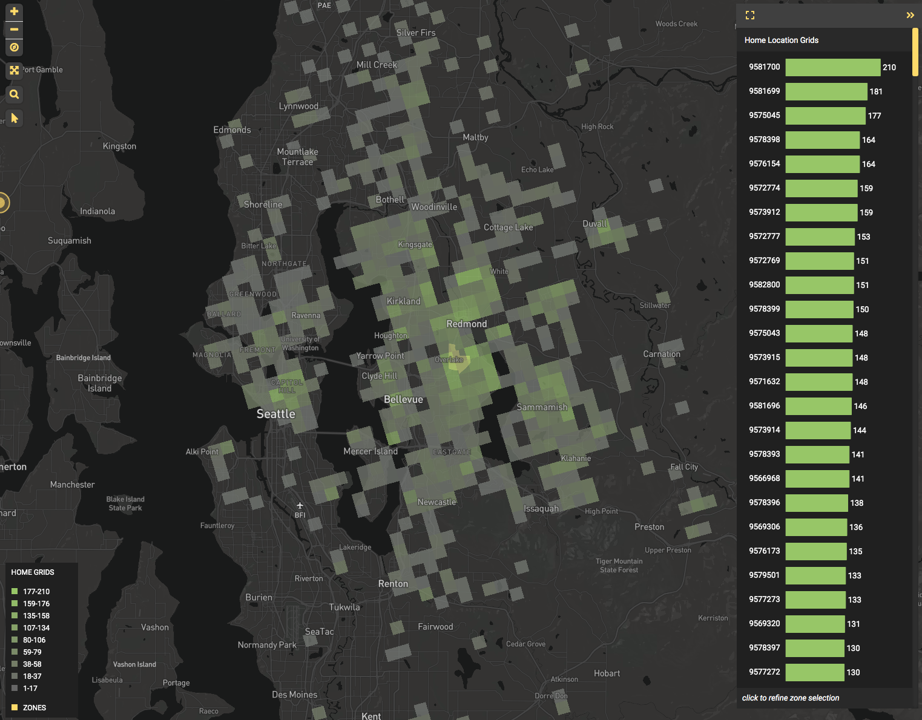
The Home/Work Location feature allowed us to identify and aggregate where employees live and work. The inferred home locations are clustered into 1 km by 1 km grids, and thus protect the identity of individuals.
These analyses provide additional Metrics which we did not use for this study, including trip distance and traveler demographics (age, income, race, and more).
Figure 1: A pre-COVID Zone Activity analysis of Microsoft’s Seattle headquarters shows inferred, aggregated home locations for peak AM commuters.
How Much Seattle Traffic Comes From Commuting?
Our initial hypothesis turned out to be correct — a large percentage of Seattle’s VMT came from commuters working at one of the area’s four largest companies.
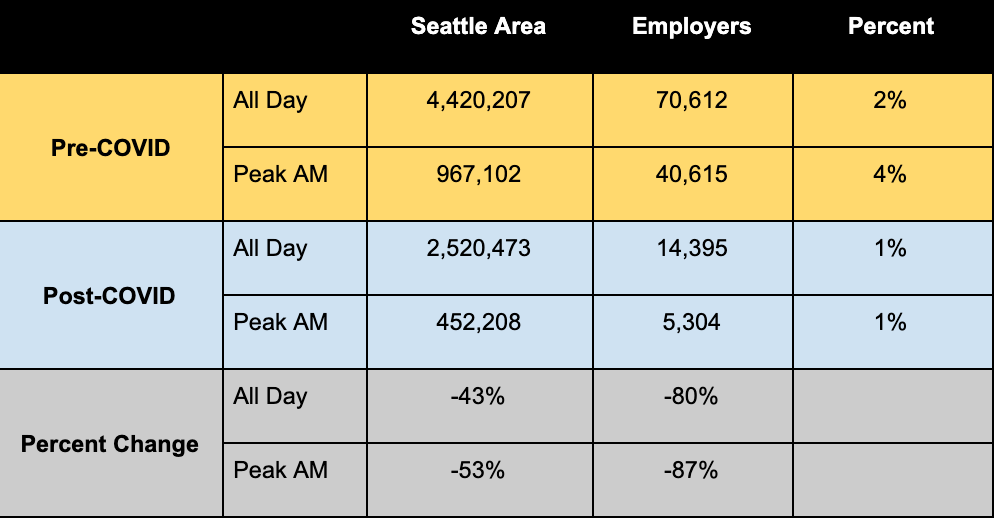
The analysis showed that pre-COVID, 4,420,207 daily trips on average were made in Seattle, and 967,102 of those trips were made during peak AM hours. Of those peak AM trips, 40,615 trips were made by Amazon, Microsoft, Boeing, and REI employees traveling from home to work.
In typical conditions, that’s 2% of Seattle’s total daily trips, and 4% of all trips during peak AM hours. Post-COVID, these home-to-work trips only represented 1% of trips made during peak AM hours. That’s a sizable impact.
Figure 2: Changes in Seattle-area commuting trip volume for major employers (Amazon, Microsoft, Boeing, and REI).
With these trip volume results we can calculate VMT, and the subsequent impact on Seattle when these four major employers continue (or change) work-at-home policies.
Predicting Work-From-Home’s Effect on VMT
During peak stay-home orders, Seattle experienced a 42% decrease in overall VMT, but across the four large employers commute trips decreased by 80-90%. An interesting note: As the only manufacturing business, Boeing’s traffic decreased least of the four — this correlates with essential employees continuing to work during the pandemic.
We can see that employer commute trips in Seattle during the summer represented a disproportionate share of COVID travel decline. Although residents were still travelling (at 42% of normal VMT) not as many were commuting. Therefore, the travel that exists is being generated otherwise.
Rising VMT despite continuing work-from-home policies indicates that trip purpose is continuing to shift. This finding invites additional analysis: For example, planners may want to understand if different roads are being used, and apply resources to the appropriate routes.
While we may understand some of the short-term ramifications of the pandemic on VMT, it’s also important to plan for its long-term effects. Using Big Data analyses, planners can stay current on travel trends to respond to travel fluctuations.
4 Patterns for (VMT) Vehicle Miles Traveled by State in 2020

4 Patterns for (VMT) Vehicle Miles Traveled by State in 2020
Continuing our work with strategic partner Boston Consulting Group, we are sharing their latest COVID-19 analysis. BCG helps transportation industry professionals apply data to decision making, particularly during the current volatile travel patterns.
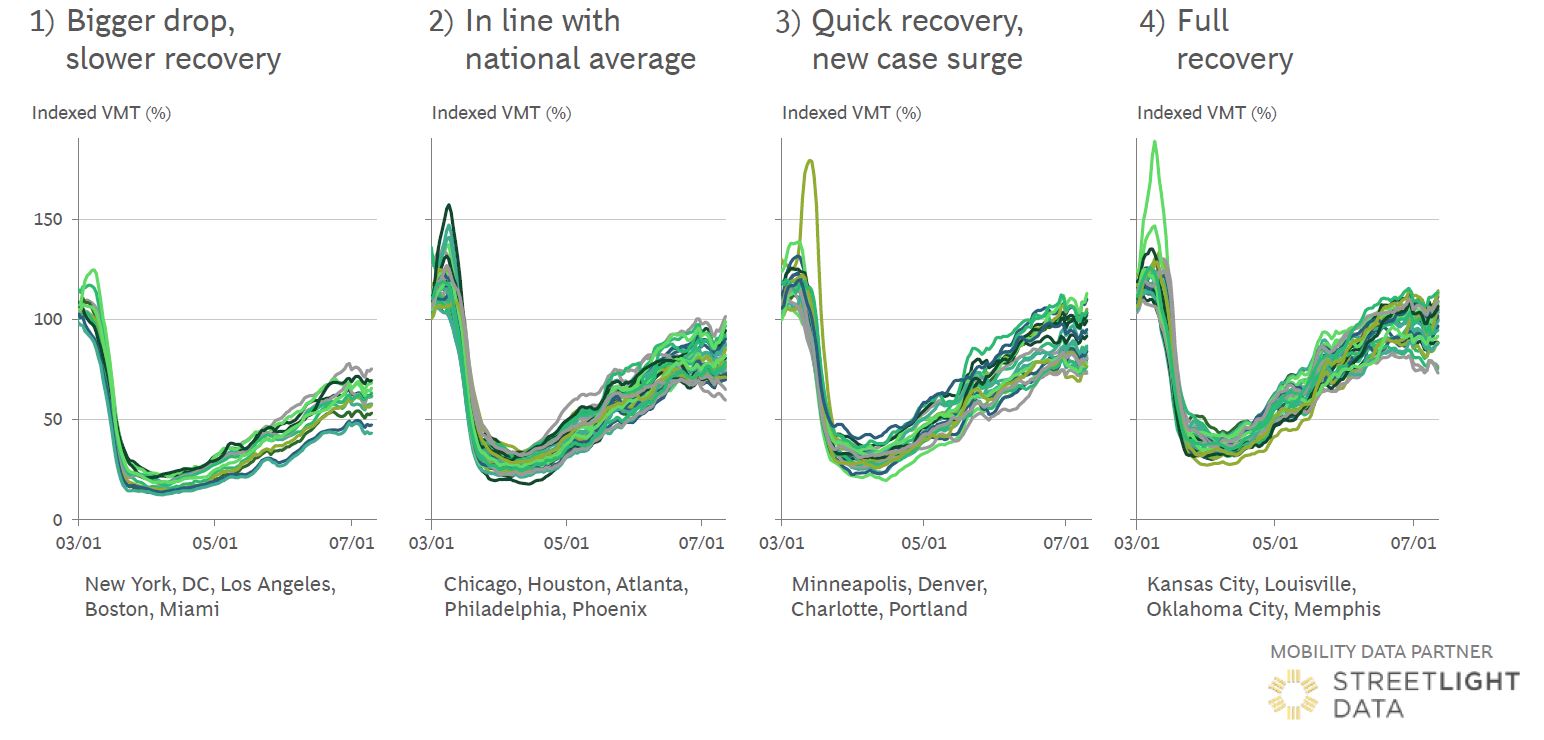
This analysis builds on BCG’s Trip Reduction Index, which analyzed COVID-19’s impact on vehicle miles traveled. In this second analysis, BCG shares slides analyzing changes in VMT by state, county, and MSA, then grouped them into four archetypes based on VMT patterns.
Urban Areas: Bigger Drop and Slower Rebound
Figure 1: VMT bottomed out in early April and rebounded in rural counties. Urban counties saw both a bigger drop and slower rebound.
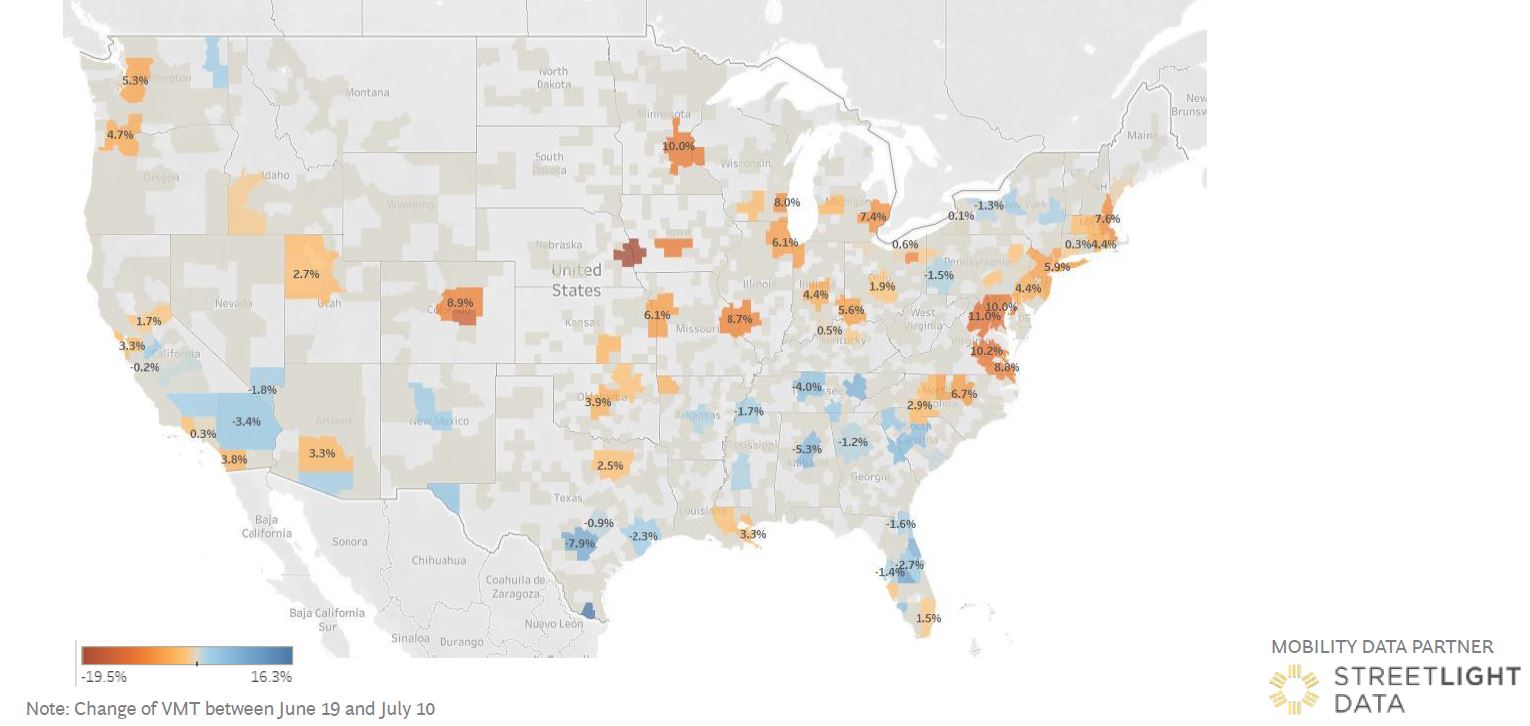
Figure 2: Trip reduction indicates VMT reduction versus January average values. Most states rebounded through early July, with the Northeast and California standing out as the areas with the largest remaining drop.
Figure 3: Trip reduction index by county on July 10, 2020.
Figure 4: Trip reduction index by MSA on July 10, 2020.
Four Varied Recovery Patterns by State
Figure 5: The VMT development varies quite a bit by state. We grouped the states into four archetypes.
Figure 6: Regional clusters formed around the four archetypes.
Figure 7: Several states see some fall in VMT since mid June, driven by resurgence of COVID-19 cases.
Figure 8: Recovery clusters deviate from mid June, with rise in COVID-19 cases.
Figure 9: Higher income and share of professional services employment drive larger VMT drops at the state level.
Figure 10: The VMT development varies quite a bit by MSA across the four archetypes.
Granular Analysis Reveals Local Variability Within States
Figure 11: Distinctly different MSA profiles present in the same region/state.
Figure 12: Several MSAs see some fall in VMT since mid June, driven by resurgence of COVID-10 cases.
Figure 13: Higher income, population density, share of non-vehicle transit drive larger VMT drops at metro level.
Augustin K. Wegscheider is a partner at Boston Consulting Group’s Automotive & Mobility Practice, where he manages the Center for Mobility Innovation in North America.
California SB 743: Why All States Should Use Vehicle Miles Traveled (VMT) vs Level of Service

California SB 743: Why All States Should Use Vehicle Miles Traveled (VMT) vs Level of Service
Transportation experts across the country are studying the effects of record low transportation greenhouse gas emissions this spring, and finding an unexpected potential takeaway from the COVID-19 pandemic. The question is, how can we create infrastructure and incentives to keep emissions low as people begin to travel again and the economy recovers?
California shows us a progressive option. By passing State Bill 743 (SB743), California is shifting how it measures the impact of transportation projects. Formerly projects were measured by Level of Service (LOS), or the capacity of infrastructure to handle the increased traffic flow. SB 743 requires that transportation projects evaluate the effect on vehicle miles traveled (VMT), or how much more traffic the project will cause. In other words, measure not the impact on drivers, but the impact that driving has on all of us.
This is the right way to evaluate transportation projects, and not just for urban or highly populated localities. Here’s why VMT impact should inform planning in all states.
What SB 743 Measures
The California Environmental Equality Act has mandated that the VMT becomes one of the thresholds for assessing environmental impact for any development or any road project. In other words, how many vehicles miles traveled will be generated by your project?
This is a significant change from estimating how many additional cars the road could hold, to determining how many more trips will be generated.
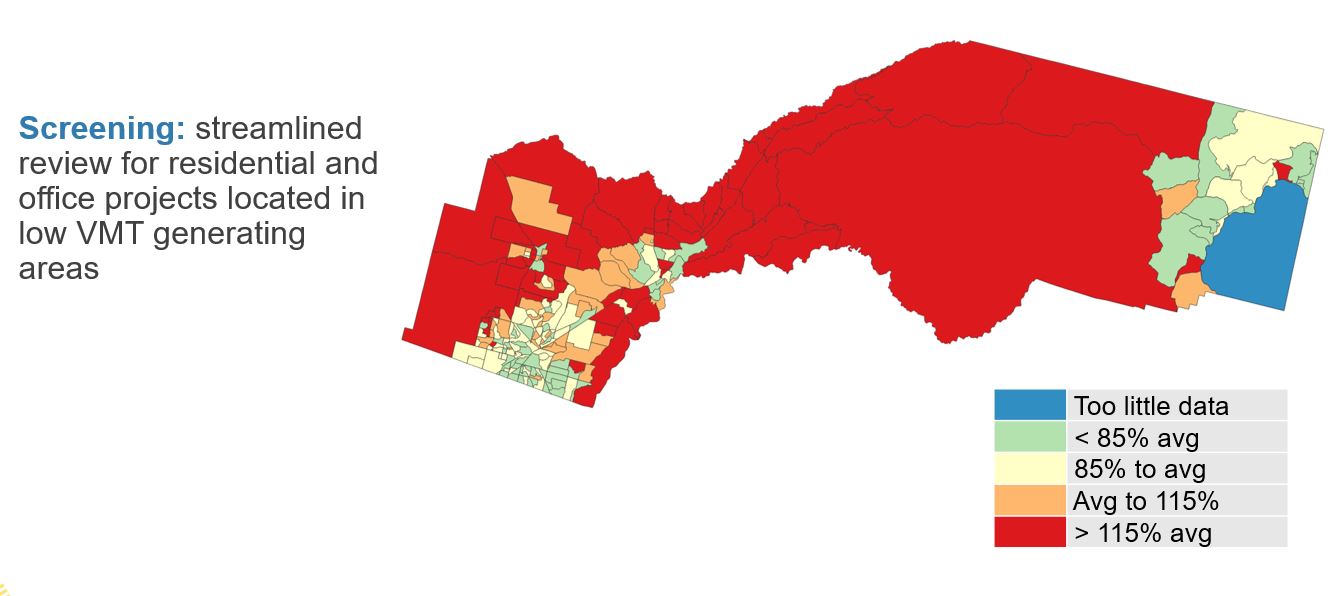
Intended Use Case #1 – Screening
HBW TRIP LENGTH – RESIDENTS VMT IMPACT SCREENING COMPARED TO COUNTY AVG
Figure 1: A project located in an area that has low VMT/capita compared to the surrounding area may be able to streamline the CEQA permitting process.
Today, the world outside California performs transportation studies like a project I recently helped with: We determined that a commercial building would generate more congestion. The existing road was only two lanes wide, so the project proponents had to put in a third lane. And if you build it, they will come! So there were more cars on the road, and more emissions.
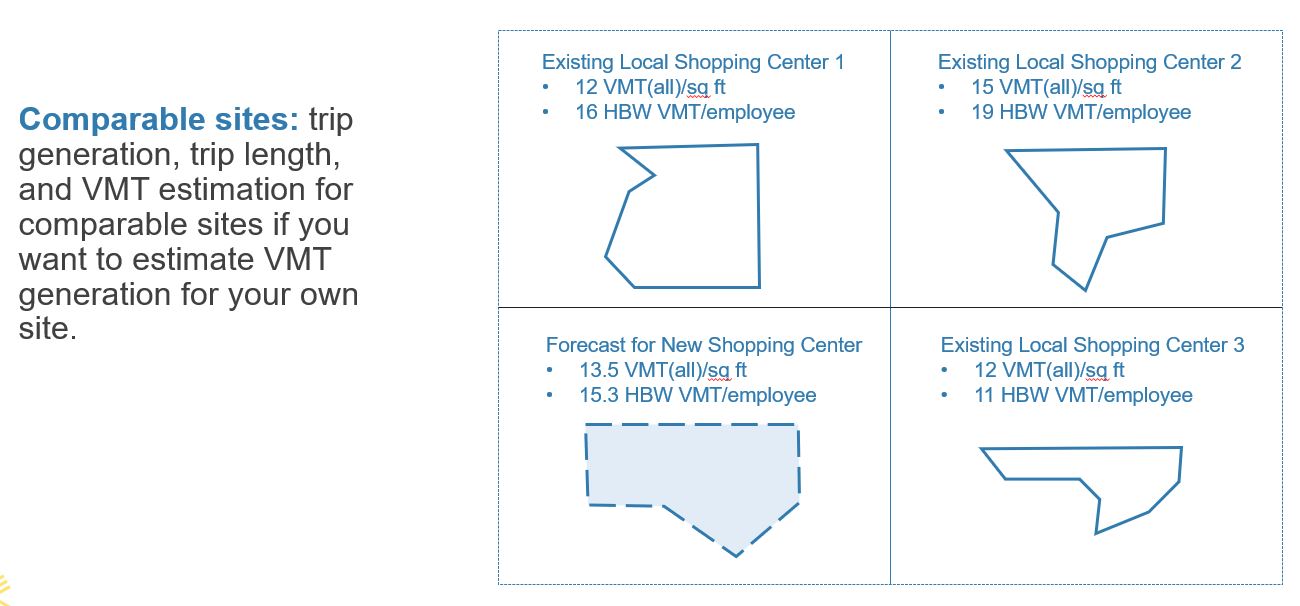
Intended Use Case #2 – Comparables
HBW TRIP LENGTH – RESIDENTS VMT IMPACT SCREENING COMPARED TO COUNTY AVG
Figure 2: By looking at VMT generated by similar existing locations, practitioners can more accurately forecast the VMT impact of a new development.
But if we had adhered to VMT guidelines instead of LOS, we wouldn’t have been free to build more capacity. Instead, we may have developed techniques to serve the same amount of visitors with less driving (transit options or locating the project in a denser, more walkable part of the city). Less personal vehicle traffic, lower emissions.
Better Results Beyond California
Incorporating VMT into transportation studies, or replacing LOS completely, has benefits not just for California but for Midwest farmland, Northeast urban centers, Southern sprawl, and everything in between.
Increased Safety
Lower VMT can contribute to lower traffic crash rates. The U.S. has the highest vehicle crash rate in the world, linked to our correspondingly highest driving rate. There is a body of research linking VMT with vehicle-related fatalities, with many Vision Zero advocates supporting a decrease in VMT.
Health Benefits
The U.S. has a known obesity problem, particularly across the midwest and southeast, known to be linked to a growing body of serious health problems. Not surprisingly, we’re also not walking as much as many other developed countries including Canada, Germany, and China. Honestly, nobody can blame us, when much of our country lacks sidewalks, bike paths, transit hubs, and other infrastructure to promote active transportation.
Improved Environmental Habitats
How many local species of red legged frogs or tiger salamanders will your project displace? What plants will be affected, and how much water runoff will it create?
In California, project managers must pay fees to offset environmental disturbance. Although other parts of the country may not have the level of environmental emphasis as the West coast, planners everywhere should be aware of project impacts. Incorporating VMT into impact studies adds to our understanding of how the environment will be affected.
Farmland Preservation
More greenhouse gas means more global warming, less rain, and fiercer climate change. America’s farmland is shrinking as farmers battle these growing weather challenges.
Water is becoming a threatened natural resource, with drought forcing America’s farmers to fallow their fields. With an emphasis on VMT instead of LOS, fewer roads and less sprawl means less water runoff and better water conservation.
Equitable Housing
As more and more workers can’t afford to live in high income areas, they must commute longer distances, which drives up VMT. Although building new housing in an area far from jobs may not have a problem under LOS guidelines, it would likely create more VMT.
Incorporating VMT studies into residential land use planning can decrease commuting trips simply by placing workers closer to home.
Boosting Density
Favoring VMT can boost the growing “urban village” movement, which places construction around mass transit stations. For some cities, urban village is an actual land-use designation. The idea is to put residences in more dense locations and provide nearby efficient transit, making more of a spoke-and-hub transportation system rather than an endless web.
This type of building is becoming more important in developed areas of the country that have literally run out of room. Instead of building out, planners are looking up.
Ultimately, transportation planning is tied to urban planning and environmental planning. These are three legs of the same stool, and VMT glues them all together.
The Data Powering Updated VMT
One reason California was able to establish SB 743 is that they can now measure VMT in a very granular way. Our VMT metrics have been independently validated for this specific use.
Our Big Data metrics allow California planners to identify VMT by specific land use, like residential travel, “home based work” commutes, retail or “other based other” travel, and more.
In addition, Big Data VMT can pinpoint customized time periods: specific days, hours, days of the week, or or for an annual average time period. It can provide full-trip data, instead of truncating trips as models do. And Big Data VMT can be updated in real-time, so that the data doesn’t age from project to project.
I may be biased, since I live in California. But on SB 743, I think my home state is leading the way for better transportation planning, and a better world
Three Surprising Truths About Transportation Emissions

Three Surprising Truths About Transportation Emissions
Almost 10 years ago, as an eager PhD student at Berkeley, I entered a contest to help fund my research topic on collecting data to support wider electric vehicle adoption. Even though my business idea was just for the contest, after I won, the idea took hold in my mind and I soon launched StreetLight Data.
Last month I finished that PhD on Transportation Behavioral Data and Climate Change. In the meantime, StreetLight has expanded to provide metrics for all personal vehicles, trucks, bicycles, and pedestrians. Our scope has grown, but the company’s mission still aligns with my PhD.
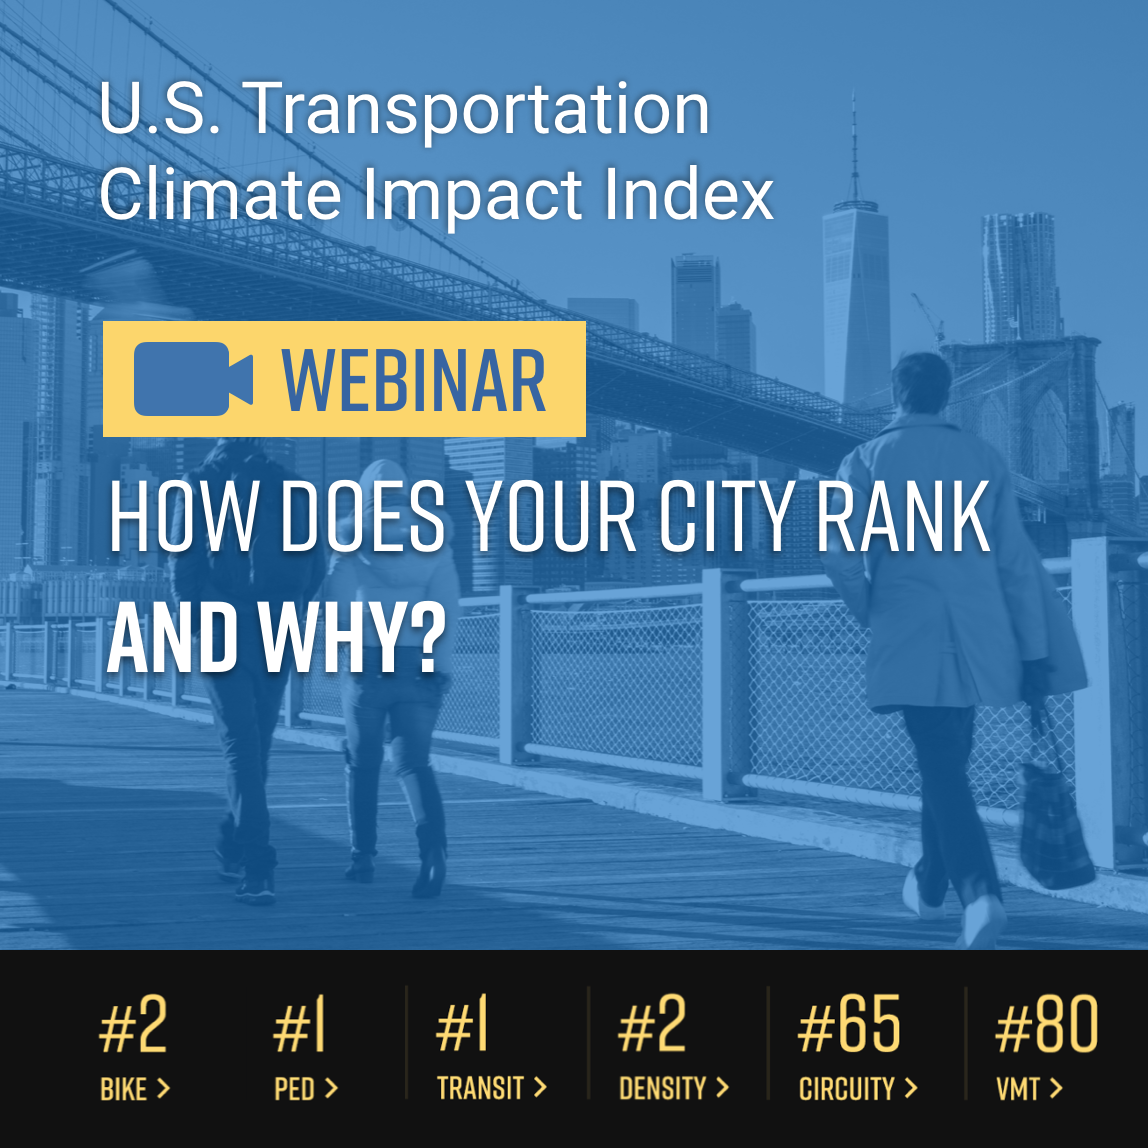
That’s why I’m especially excited about some of the surprising findings in our recently released 2019 U.S. Transportation Climate Impact Index. It uses real-world data to measure what’s actually going on with transportation in our cities. The results challenge some of our most-loved assumptions.
Bikes Aren’t the Future
Our sustainability conversation, especially in the media, has focused on really visible types of sustainability. I’m all for biking and walking, but biking in itself isn’t good for the climate, nor is transit, nor walking. From a transportation emissions standpoint, these modes are only good if they displace something bad, like personal petroleum-burning vehicles. The Climate Impact Index encourages us to talk about more robust solutions.
For example, with better land-use planning or some sort of infrastructure we can shift an SUV driver in Texas from 10 miles every day to 5. Or we can build bike lanes in San Francisco and shift a one-mile Prius driver to a bike. Shifting the Texas SUV has vastly more impact.
The Climate Impact Index helps us think in this comparative way, particularly because most cities are never going to build a subway system like New York’s. Yet, there are still big things they can do that have huge climate impact, and those changes should be recognized and rewarded. With this list we wanted to remind everybody that finding the answer is not one-size-fits-all.
Why Congestion Doesn’t Matter
There are so many lists out there focusing on congestion. Sure, congestion is annoying and wastes time, but today’s efficient cars don’t really cause more transportation emissions when they are moving slowly. Congestion in some sense is actually good, because horrible congestion may make people look at alternatives, like transit or bikes.
For our Climate Impact Index we agonized over what factors to weight and how high. In fact, we originally planned to have sliders instead of set weights, so that planners could adjust the weights themselves and see the results. But then we decided our list would have more power if it sparked real conversations around the real issues that affect transportation emissions.
Planting a stake in the ground like that was really hard for me. I’m an academic, and I like to debate pros and cons. I know there’s no perfect algorithm for measuring the impact of transportation emissions. What we can do, however, is push thinking about how data can measure concrete outcomes.
But Maybe Horses Count
Judging from the conversations that have already come back from my colleagues, creating this list was totally worth it. We’ve got people thinking in creative ways.
Some people have responded with strong opinions about what to measure, and why. And I like that they feel deeply about these issues. Maybe they’ll take this transportation emissions impact idea even further than we did.
We’ve gotten a lot of questions about the non-obvious cities on the “Top 10” list like Des Moines and Madison. People ask me how a city like Des Moines can be “sustainable” when they don’t have a developed transit system. Well, it’s because they drive less.
I don’t care how you drive less. I don’t care if it’s because your area has transit, or bike lanes, or a compact environment, or whatever. I’ll take it any way I can get it.
People have really glommed on to the horse and buggy situation in Lancaster as a solution, which I think is fantastic. I’ve ended up in more than a few entertaining conversations about the impact of horse methane emissions (about which I know absolutely nothing).
Let’s Find a Fast Fix
When it comes to climate change, we are running out of time. We need to reduce vehicle miles traveled (VMT) in the most sprawling, most SUV and truck-filled places in the U.S., and we need to do it now.
We studied the factors that we judged important. But it’s infinite really, the data to analyze for understanding and managing transportation emissions. I encourage others to explore their own analyses.
I know that influencing transportation is the most powerful thing I can do in my limited time on earth, because changes in transportation infrastructure deeply affect our carbon output for the next 30 years. That’s where StreetLight works hard to have an impact. After all, if you can’t measure it, you can’t manage it.

