
Corona Bicycle Metrics: Where Bicycling Increased and (Surprise!) Decreased
Bike shops sold out quickly, and cyclists seemed to be everywhere during May’s widespread stay-home orders. But were Americans actually cycling more? Our analysis provides cycling facts instead of anecdotes about cycling during COVID. And some of the results surprised us.
To understand the shifts in cycling behavior beyond the anecdotal headlines, we used our bicycle Metric from StreetLight InSight®. We’ve just released updated data through May of 2020 to enable these sorts of trend analyses.
Our takeaway: In the new pandemic mobility framework, biking is a more important travel option than driving.
Mapping the Peak Corona Bicycling Metrics
We broke the country into Census Bureau Statistical Areas (CBSAs). We analyzed the number of bicycle miles travelled (BMT) starting in each CBSA for March, April, and May 2019 and 2020. We compared each pair of months (March 2019 to March 2020, etc) to understand how things have changed at a granular level. We focused on May, since May 2020 saw the largest concentration of stay-home orders, and grouped each outcome into one of five categories:
- Massive increase (90%+ ~Double the previous year’s BMT)
- Large increase (50-89% increase compared previous year’s BMT)
- Some increase (20-49% increase compared to previous year’s BMT)
- Slight increase (1-19% increase compared to previous year’s BMT)
- Some decrease (0-33% decreased compared to previous year’s BMT)
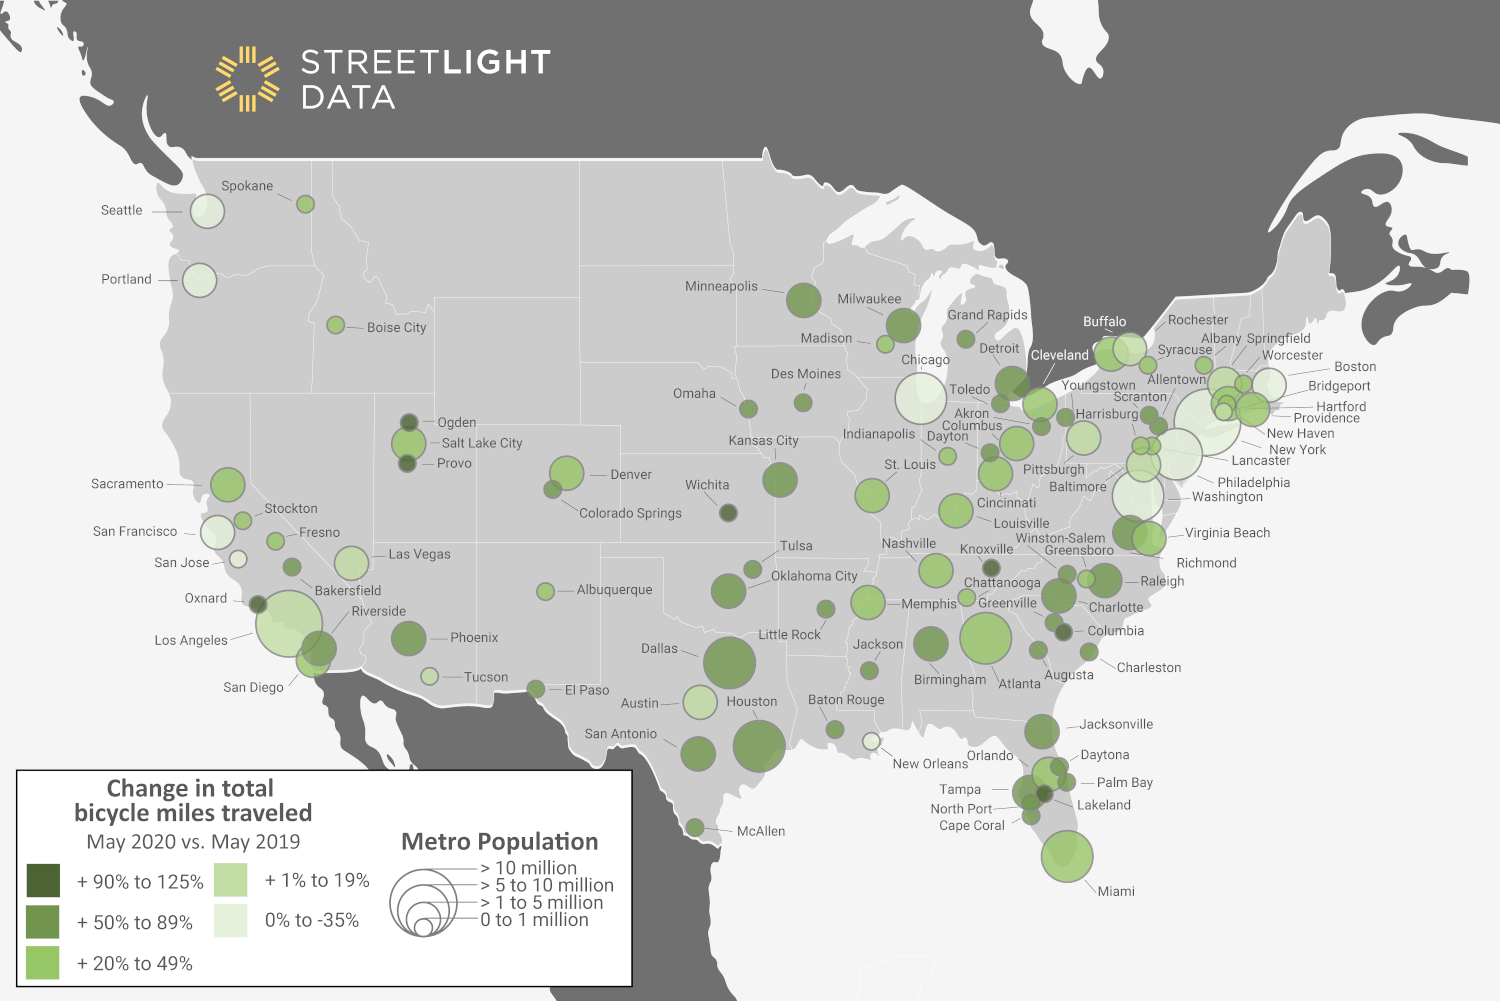
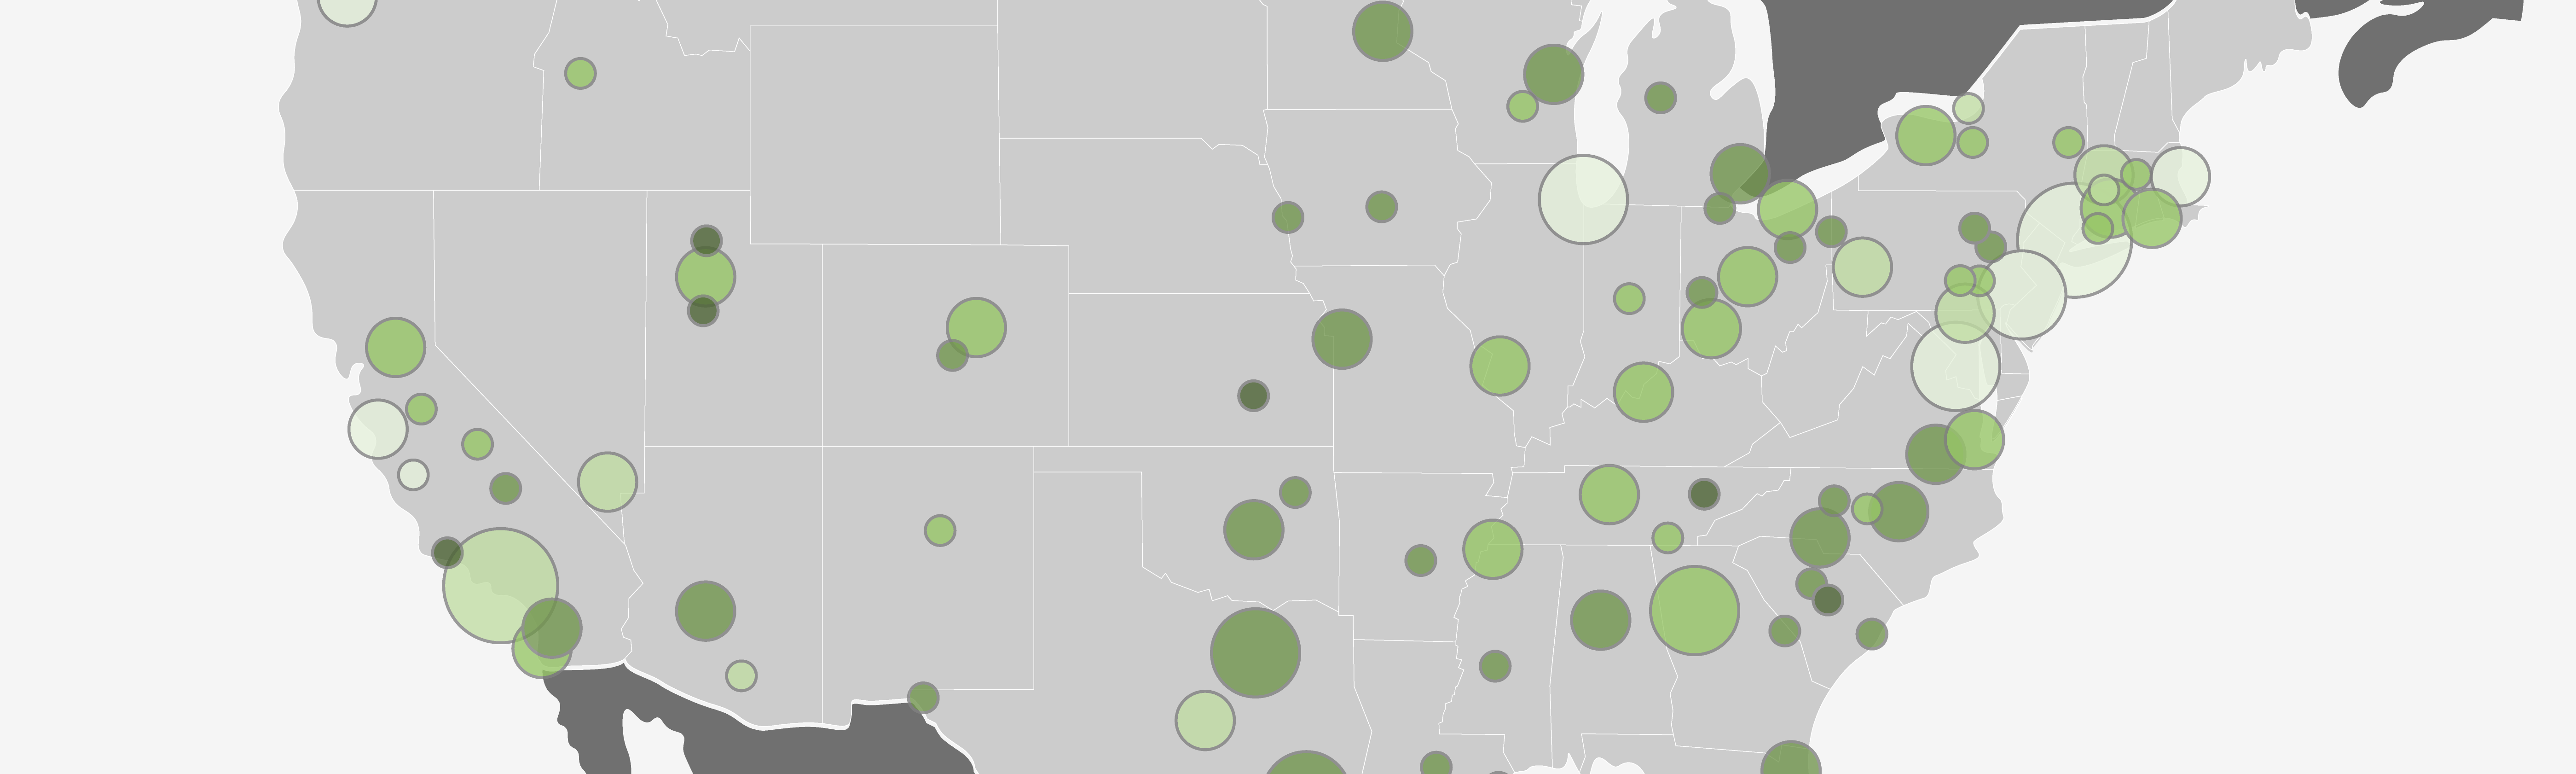
Figure 1: Comparing May 2019 to May 2020 revealed some surprises in bicycling activity. While many smaller metro areas nearly doubled in bicycle trips, several major metro areas known for bicycle commuting actually dropped.
Cycling Doubled in Metro Areas Not Known for Bike Commuting
We saw this massive increase in cities including Ogden (UT), Lakeland, (FL), Knoxville (TN), Columbia (SC) and Provo (UT) and Oxnard (CA). These are cities not ranked highly for commuter cycling, according to our 2020 U.S. Transportation Climate Impact Index.
Why did these areas have the sharpest increase? We know these cities are popular areas for mountain biking, road biking, and/or triathlons. Could it be that folks either out of work or with fewer entertainment options spent more time on outdoor activities?
Not only did the number of trips in these CBSAs increase, but also the average length increased, which may indicate more “fitness” bicycling. However, when we took a closer look at Ogden, we saw that the average trip length still stayed below five miles, much shorter than a typical road or mountain bicycling workout.
To dig a little deeper, we broke the Ogden region into grids and compared the spatial distribution of trip origins in May 2019 to May 2020.
As shown in the figure, biking increased across the region, especially in the city center. This could indicate a rise in biking for all kinds of trips, including recreational, errands, or work. This bodes well for building biking as a more common mode of transportation for all kinds of trips.
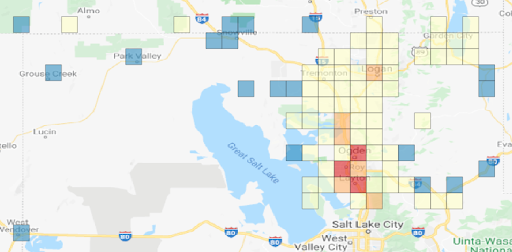
Figure 2: Changes in bike trip starts across the Ogden metro area between May 2019 and May 2020. In blue grids, bike trip starts decreased in May 2020 compared to May 2019. The yellow, orange, and red grids show where bike trip starts increased (red having the most increase and orange the least). Bicycling increased broadly across the metro region, including in the towns.
Cycling Dropped In Notably Bike-Friendly Metro Areas
Bicycling actually decreased in Portland (OR), New York (NY/NJ), Boston (MA), San Francisco (CA), and the District of Columbia. But it’s important to append some additional data to that finding before we conclude that biking is doomed in these places: Bicycling miles decreased less than car miles decreased.
This supports what we’ve anecdotally seen on these cities’ streets: Bike travel declined a lot less than car travel. Thus the share of all trips that are made by bike increased. For example, in the Portland metro area we found bike miles traveled fell by about 10%, but VMT dropped by 35%.
In other words, shelter-at-home compliance drove a reduction in overall travel, especially commuting (by both car and bike). All four of these metro areas have well-developed bike commuting activity, and that significant drop in bike commuting wasn’t quite filled by recreational bike activity. Also, some residents fled the densest cities for more suburban options.
We also gridded the Portland metro area (like Ogden above) to see the change in distribution of bicycle trip starts
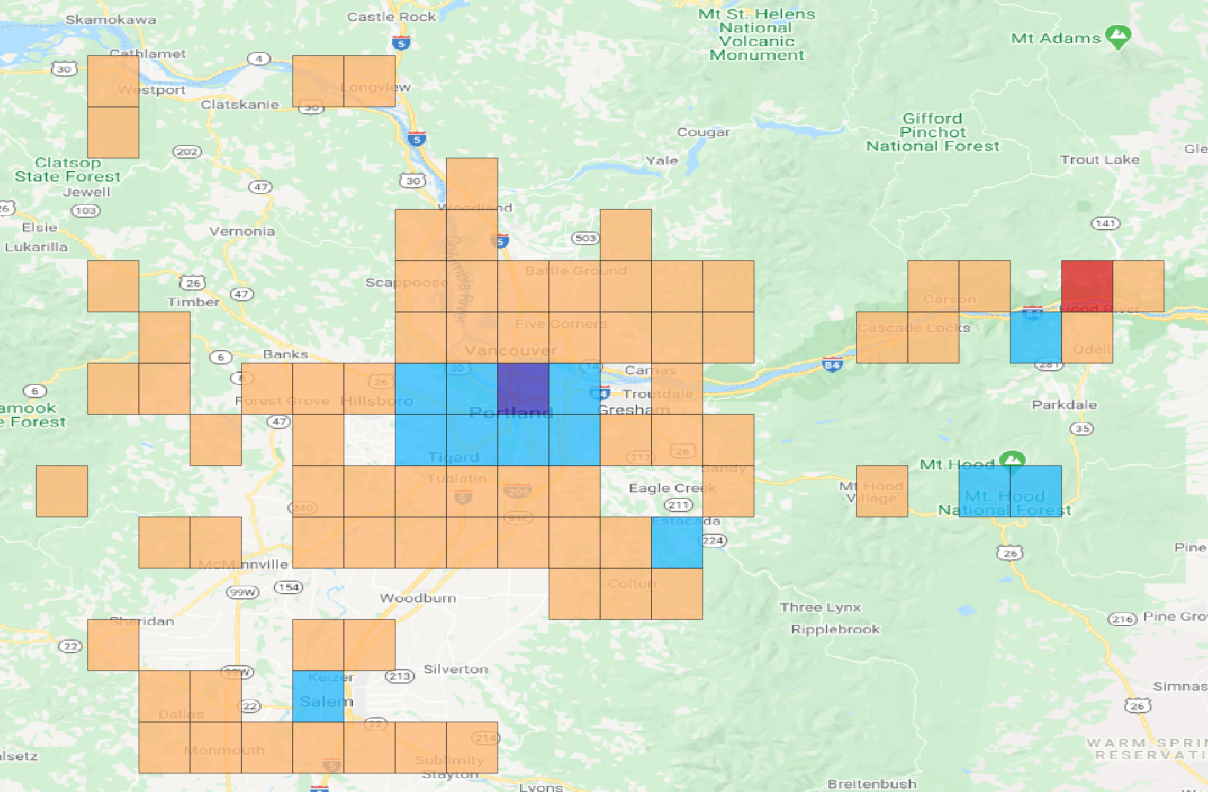
Figure 3: Changes in bike trip starts across the Portland metro area between May 2019 and May 2020. In the blue grids, bike trip starts fell in May 2020 compared to May 2019. The dark blue grid is where most trips starts were lost (downtown Portland). The orange grids show where bike trip starts increased. The red grid has the biggest increase (where there is a mountain biking trailhead).
But as work-and-everything-else-from-home relaxes in the (sometime) future, we hope the rise in non-commute biking, combined with a gradual return to work, will lead to an overall increase in total biking.
These types of analyses are just the beginning of what planners and advocates can learn about alternative modes during the pandemic. Of course, local experts will have a deeper knowledge of cycling habits in their area, and will have insights into why and where cycling may have grown or dropped and how to sustain it in the future. We look forward to these conversations.