
COVID-19’s Impact on Travel in Small Urbanized Areas of Ohio and West Virginia

Our customers have been using our metrics to understand the impact of COVID-19 and the stay-home orders. We asked Panini Chowdhury of the Brooke Hancock Jefferson Metropolitan Planning Commission if we could share his analysis of changing travel in northern West Virginia and Jefferson County, Ohio. Our summary covers:
Although the public health impact of COVID-19 has so far been minimal in northern West Virginia and Jefferson County, Ohio, travel was heavily affected. But exactly where, and why? To get answers, Brooke Hancock Jefferson MPO drew on multiple primary and secondary sources, including StreetLight Data, to study the month of March.
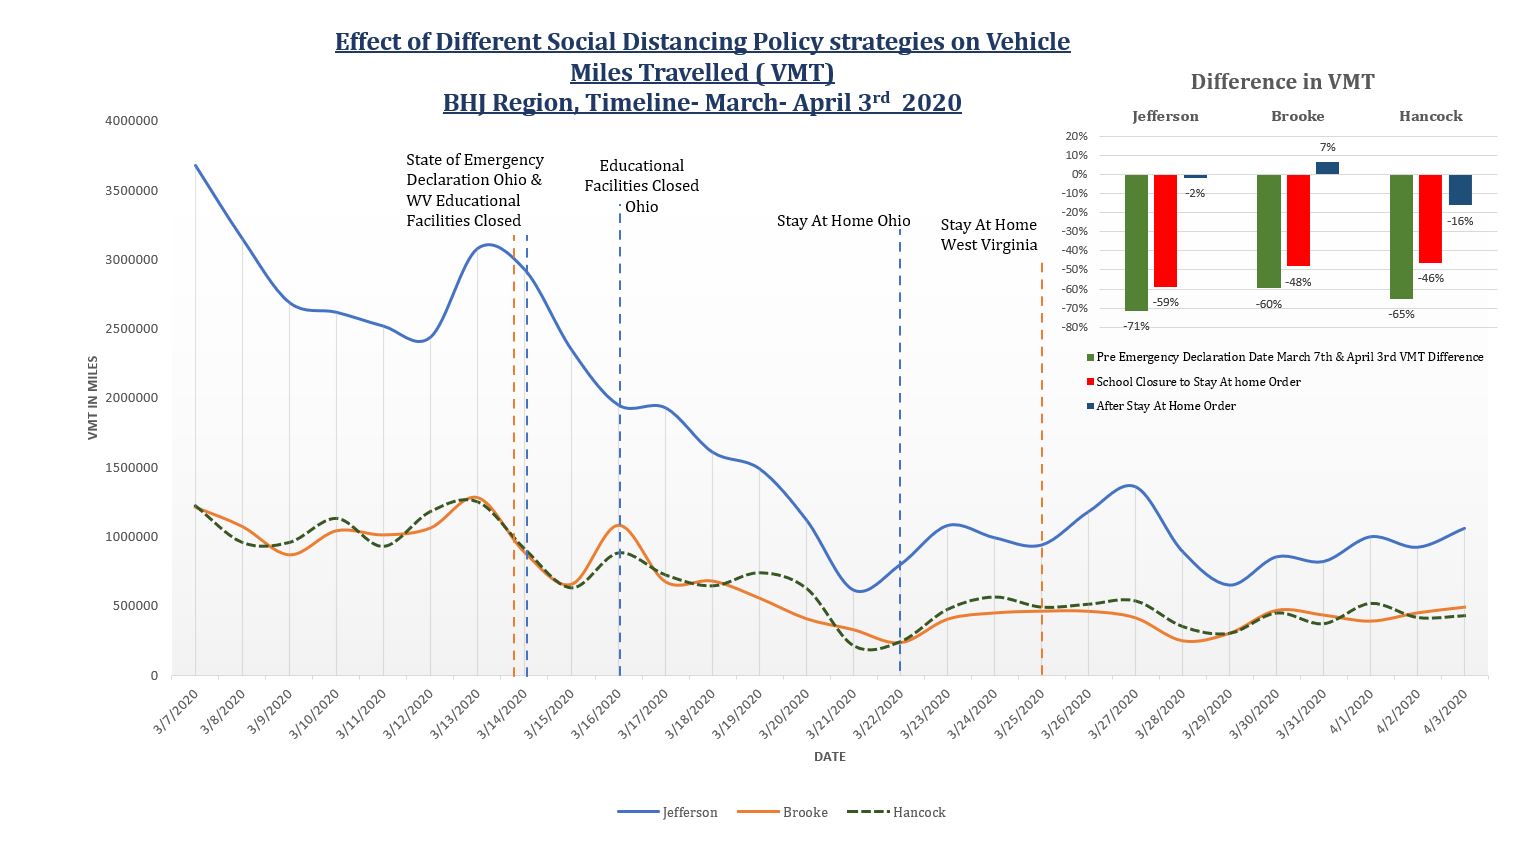
Figure 1: Comparison of VMT drop during March in Jefferson, Brooke, and Hancock counties.
Effect of School Closures
First, the data showed that Vehicle Miles Travelled (VMT) fell over 60% in March. Closer analysis revealed that school closures were the main cause.
On both sides of the Ohio River VMT fell over 50% when the respective schools closed. But after each state issued stay-home orders, VMT change was minimal. In fact, Hancock county VMT increased by 7% during that time period.
Educational institutions are major employers in the BHJ region, so this impact did not surprise analysts.
Other major employment sectors of this region include healthcare, manufacturing, and government — all classified as “essential” work. That also helped explain the relatively unchanged VMT post stay-home orders.
Excluding a large decrease in school-related trips in mid March, weekly travel habits remained static in the BHJ region except for peak grocery trips on Friday or Saturday.
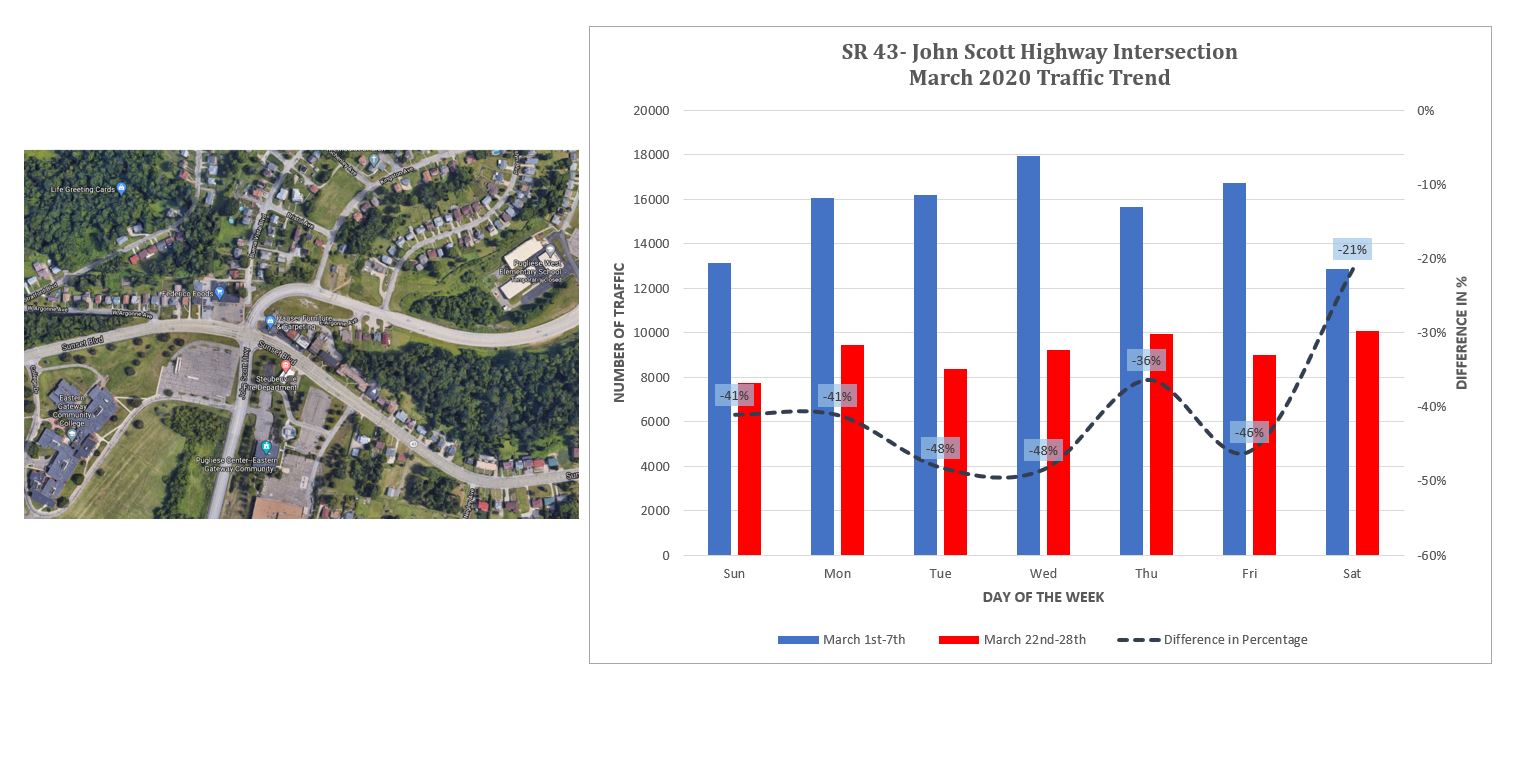
Figure 2: Micro analysis of traffic signal data at a busy intersection validated the drop in weekly travel.
Analysts dug deeper by collecting traffic signal data from the busy intersection of SR 43 and John Scott Highway in Steubenville, Ohio. The first and last weeks of March showed a 48% decrease in vehicle travel during the week, but a much smaller change on Saturdays. Analysts hypothesized that the dip in weekday traffic correlated with a nearby elementary school and community college (both closed). Weekend traffic was likely caused by grocery trips, exempt from stay-home orders.
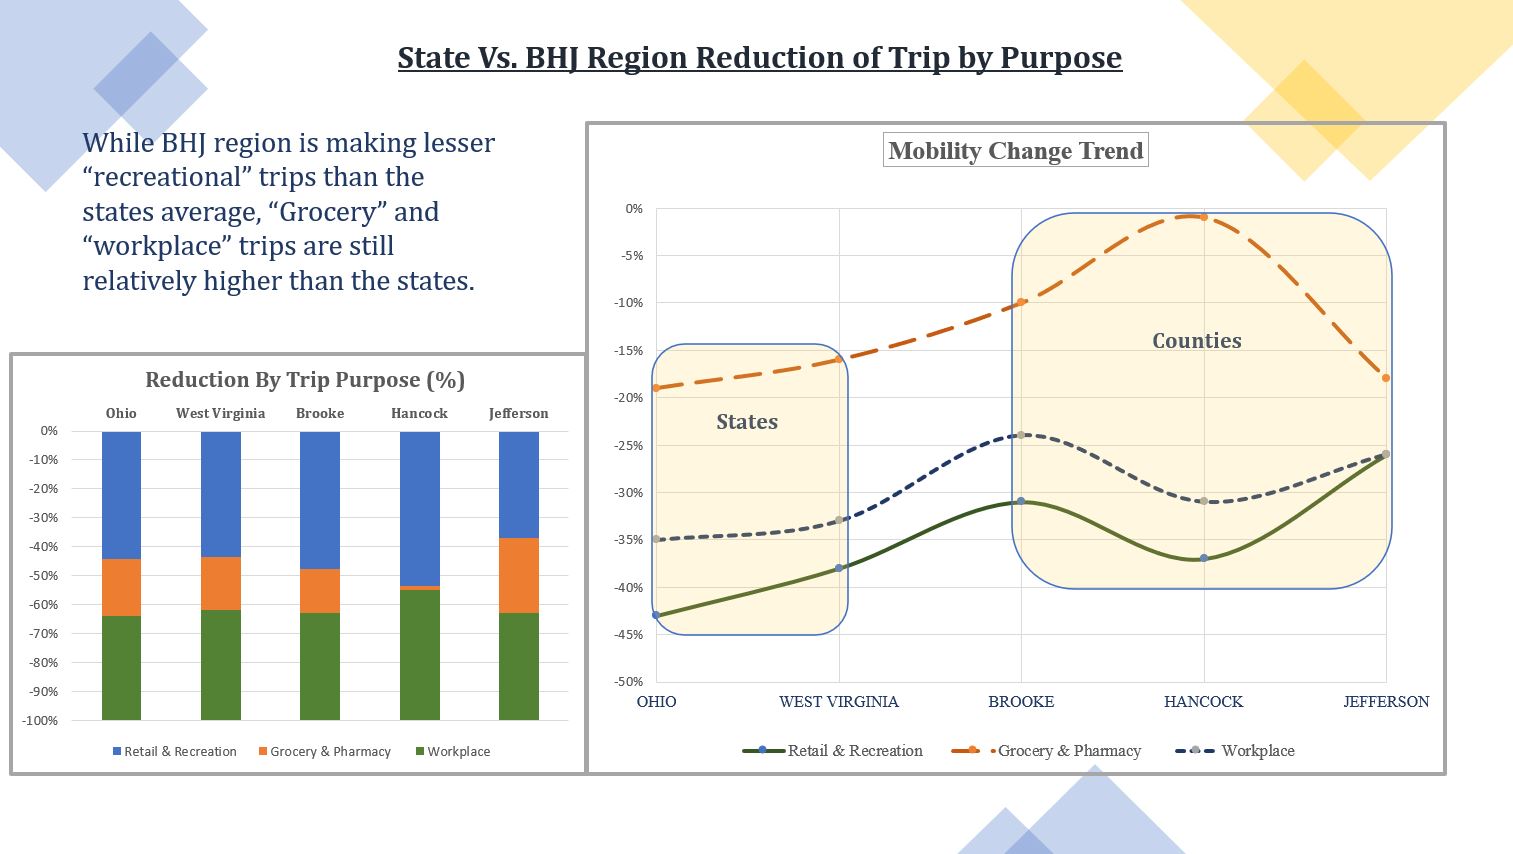
Figure 3: Analyzing trips by purpose revealed that grocery trips actually increased in the region while recreation and work trips decreased.
Linking Trip Purpose to VMT
While the analysis revealed that area drivers were making fewer trips, planners wanted to understand what type of travel was most affected. They used StreetLight InSight® to study trip purpose. Analysts compared travel for retail, grocery, and workplace.
They found that drivers were making fewer recreational trips than the states average, but grocery and work trips remained high when compared with state averages.
In particular, grocery trips fell only 1% in Hancock county. Hancock county also showed the region’s highest reduction in work trips.
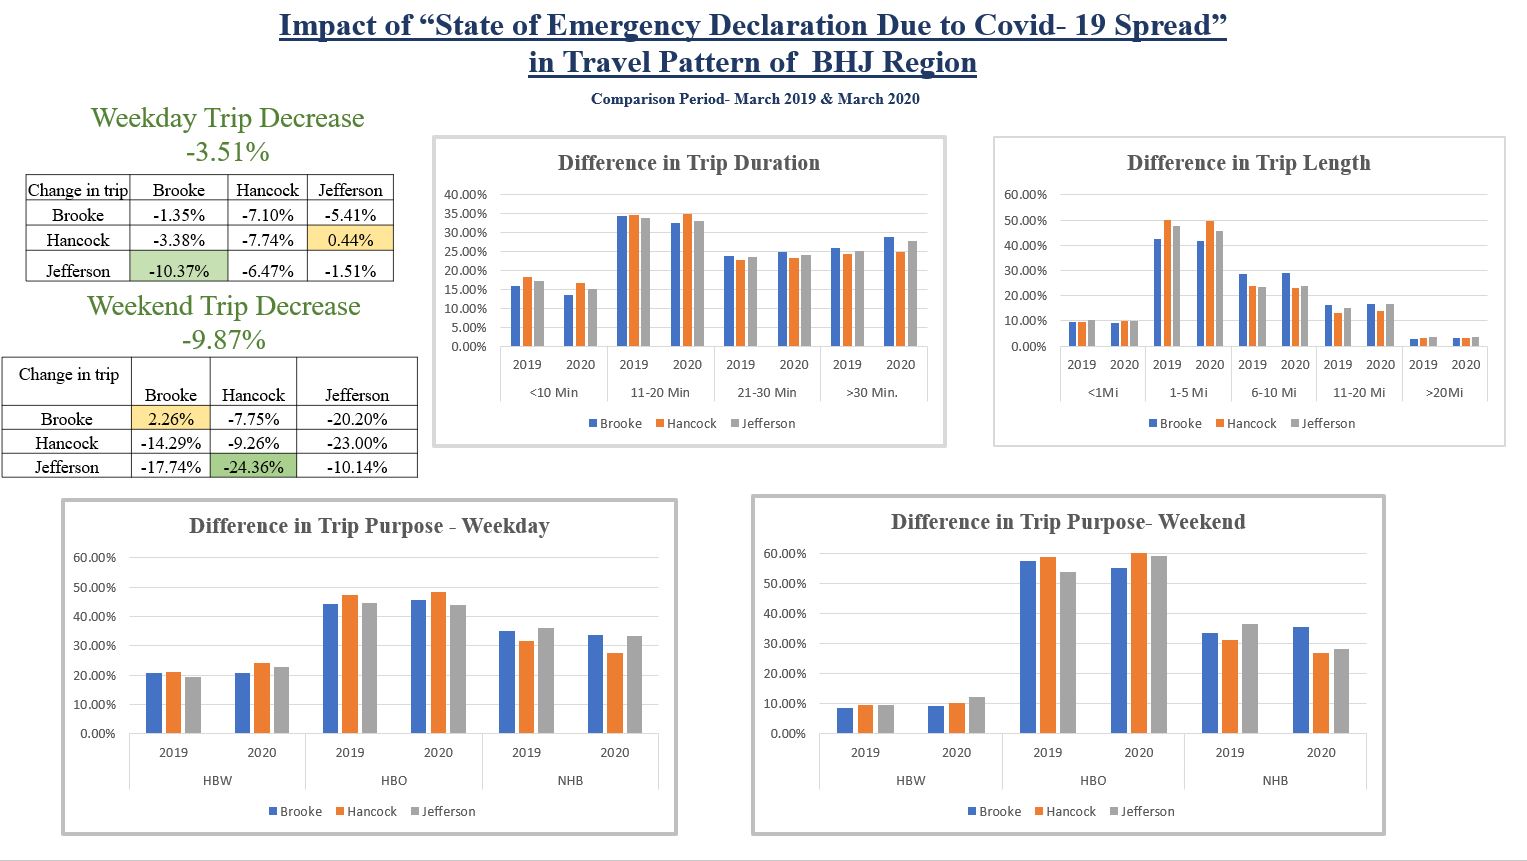
Figure 4: Comparing year-over-year travel for the month of March showed a minimal drop for travel in non-urban counties.
Year Over Year Changes
Using StreetLight’s historical data, analysts were able to go “back in time” to compare data from March 2020 to March 2019. They discovered that travel during stay-home orders didn’t drop by much compared to the previous year.
In March 2020, weekday travel decreased only by 3.5% with weekends nearly to 10% compared to 2019. Hancock county showed the largest decrease in travel, with the smallest in Jefferson.
Analyzing longer trips, the largest decrease is from Jefferson to Brooke 10.3%, and the smallest decrease of 1% Hancock to Jefferson. Generally, this reduction rate was found more during weekends rather than weekdays — consistent with the previous findings that people made fewer recreational trips (which generally occur over the weekend).
While Home-Based Work (HBW) trips in March 2020 remained similar compared to 2019, there was a decrease in Home-Based Other (HBO) and Non-Home Based (NHB) trips. Trip lengths compared to 2019 were fairly consistent throughout the region, with a slight increase in longer trips in Brooke county and a 2% decrease in shorter trips in Jefferson County.
Throughout the region, drivers made relatively fewer short trips (fewer than ten minutes) which was approximately 2%. Longer trips (more than 30 minutes) increased by 2.5%-3% especially in Brooke County.
By overlaying traveler demographics, the analysis found that drivers earning over $75,000 annually were traveling more than their counterparts with income lower than $20,000. Analysts hypothesized that a higher purchasing power explained this situation because of significant panic buying in the region after the state emergency declaration. Other than these two lower and upper-income limits, travel across income groups remained consistent between time frames.
Urban Versus Rural Differences
After stay-home orders, all urban centers in the region experienced a significant decrease of VMT, with larger metropolitan areas seeing a 20% travel reduction. This was due to, most likely, the higher presence of non-essential workplaces in the more densely-populated urban areas (population greater than 200,000).
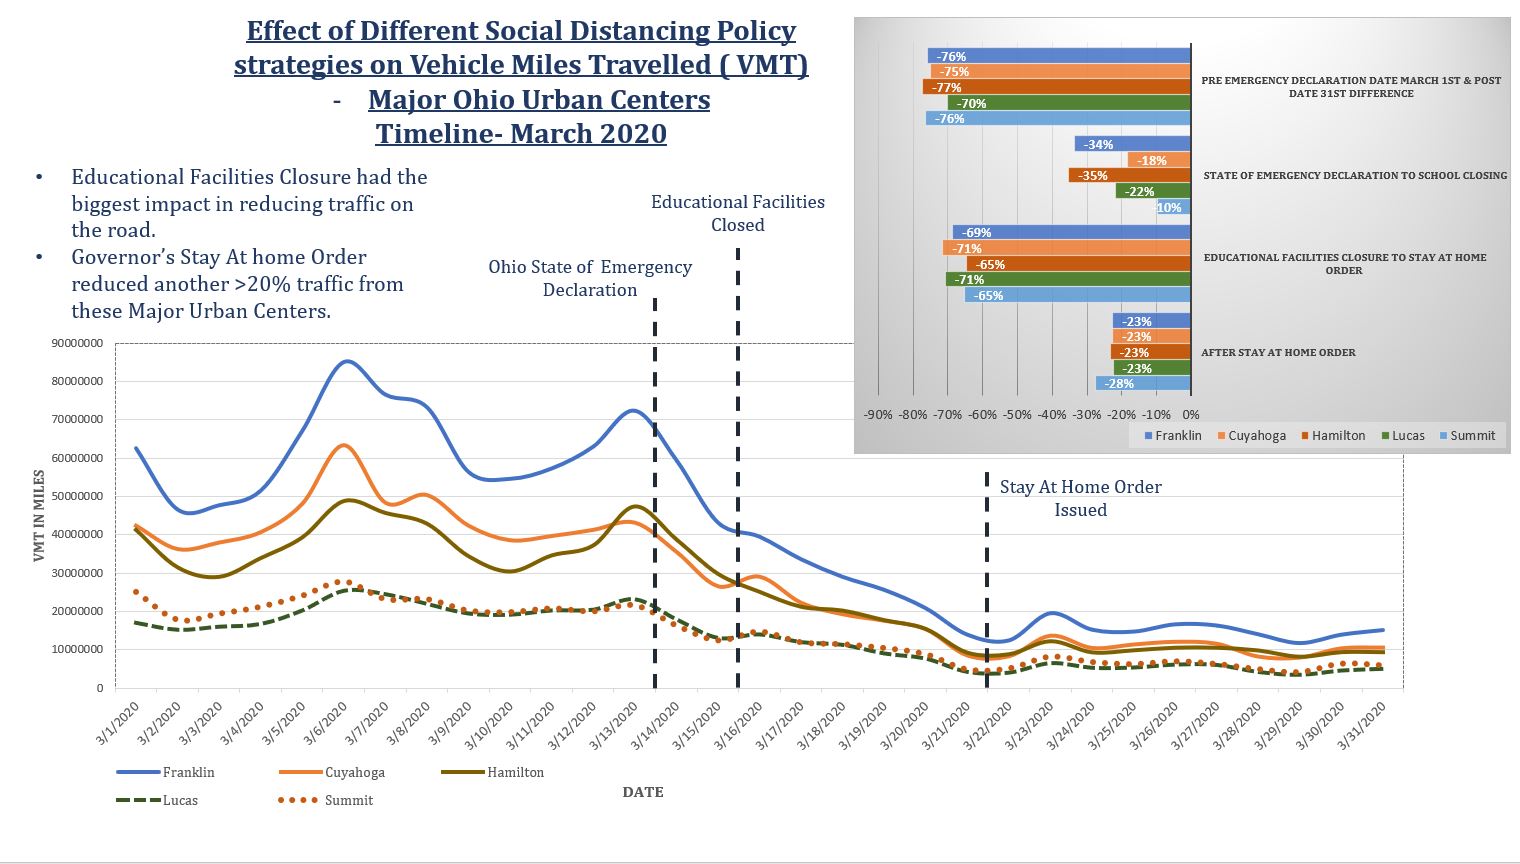
Figure 5: The largest reduction in travel occurred in major Ohio urban centers.
Educational facility closures played the biggest impact in reducing traffic on Ohio roads. Initially, the emergency declaration order resulted in a greater VMT reduction in Franklin and Hamilton counties, home to the state’s two largest universities (Ohio State and Cincinnati). Other areas experienced similar VMT reductions as all other educational facilities across the state began to close.
But in rural areas, travel didn’t decrease nearly as much. The analysis pointed to several potential causes:
- Major employers in the region include healthcare, manufacturing, government, construction, and warehousing — all deemed essential businesses. Unlike the large metropolitan areas (population greater than 200,000), overall BHJ employment growth in the retail, food-service, hotel accommodation, and other service industries has been static over the last seven to eight years.
- The majority (92%) of the trips of this region are traditionally single-occupancy vehicles. The region sees minimal transit use and no ride-hailing services, so travel did not shift to those modes.
- The low population density and secluded lifestyle in the region created a sense of safety from the COVID 19.
- Senior citizens make up 20% of the total population of the region. Stay-home orders for this demographic have the largest impact on trips to Sunday religious services.
- Lack of strong enforcement for stay-home orders.
This longitudinal study of 2019-2020 helped explain the overall decreasing VMT trend of this region. But because of the availability of jobs and better economy of the country as a whole in the beginning of 2020, the region actually saw an increase in the number of trips from the beginning of January through mid-March 2020, before the state of emergency declaration.
VMT for the first half of March 2020 was 32% more than that of 2019. Although a significant gain over 2019, the overall trend is ultimately less significant than many of the major metropolitan areas of both Ohio and West Virginia.
Panini Chowdhury is a transportation engineer at the Brooke Hancock Jefferson Metropolitan Planning Commission.