
How Big Data Can Help Combat Climate Change

Earth Day invites us to reflect on our responsibilities on this planet, and the role(s) that individuals and businesses can play to help confront one of the greatest challenges of our time — climate change. At StreetLight Data, we know that Big Data can immeasurably enhance planning and policy for managing transportation-related greenhouse gas (GHG) emissions. In fact, it is baked right into our company mission, “to help reduce greenhouse gas emissions and petroleum use in vehicles, especially by reducing miles driven through the pioneering use of massive mobile data analytics.”
According to the Intergovernmental Panel on Climate Change (IPCC), in order to minimize increasing impacts such as extreme heat, drought, and heavy precipitation, additional warming of our planet must be limited to 1.5°C. In order to meet this threshold, we must make rapid and far-reaching changes in energy, land, and infrastructure use (including transport and buildings), with deep emissions reductions in all sectors.
Some studies suggest that about 20% of these emission reductions must come from trips avoided or trips shifted — for example, from cars to trains, buses and bikes. Given that estimated greenhouse gas (GHG) emissions from the U.S. transportation sector accounted for 27% of total U.S. GHG emissions in 2010, there is still plenty of work ahead.
In addition to managing the impact of our own business operations, StreetLight provides transportation professionals with the best metrics and tools to confront the challenge. Two ways we accomplish this are by developing data-driven processes to help evaluate and manage vehicle miles traveled (VMT) emissions, and developing data analysis and visualization tools to help clients better plan for electric vehicle charger deployment and automated vehicles.
Evaluating Vehicle Miles Traveled (VMT) with Big Data
VMT — a measure of the amount of travel for all vehicles in an area over a given period of time — is widely recognized as a critical factor for understanding (and thus managing) a variety of negative transportation impacts. VMT creates wear and tear on roads and is directly related to greenhouse gas emissions (GHG), air pollution, and petroleum use. VMT is increasingly important in modern transportation regulation at both the Federal and state level, such as California’s SB 375 and SB 743, which use VMT as an indicator of regional achievement of greenhouse gas reduction and other goals.

Measuring the length of trips over time can be a better measure for transportation performance than the number of trips alone, depending upon which impact you are trying to measure. This is because for certain concerns, like greenhouse gases, the length of the trip is more important than the number of trips. For example, a ten mile trip has twice as much impact from a GHG perspective as a five-mile trip.
Using a combination of StreetLight Insight® tools including Zone Analysis, Origin-Destination, Segment Analysis, and AADT, transportation planners can estimate VMT for entire regions or for individual road segments. This data can provide quick answers to important planning and policy-related questions such as:
- How does regional VMT change over time?
- How does a particular area, land use, or development contribute to regional VMT?
- How do short trips (personal and commercial) contribute to VMT?
- How much of a region’s VMT is contributed by internal trips vs. vehicles from the surrounding region?
Using Big Data to Plan for Electric Vehicle Charger Deployment
As transportation infrastructure planners, we recognize that most vehicle charging will be done at home. But we will need convenient, cost-effective out-of-home charging to drive maximum adoption levels for EVs. Transportation analytics derived from Big Data can support better planning for deployment of EV charging infrastructure including:
- Site selection, macro: Scan an entire city to find the best places for EV charging.
- Site selection, micro: Analyze and validate individual potential sites.
- Education and awareness: Select highly visible “activity centers” for chargers to maximize public exposure.
- Right-sizing: Improve estimates of grid load and electrical cost (and V2G or other ancillary grid service applications).
Figure 1 below provides an example of a site selection macro analysis. Using analytics derived from Big Data, StreetLight can scan an entire city or region to find the best spots for EV chargers. Big Data’s flexibility allows us to define “best” in different ways, and easily run multiple scans at very low marginal cost and effort.
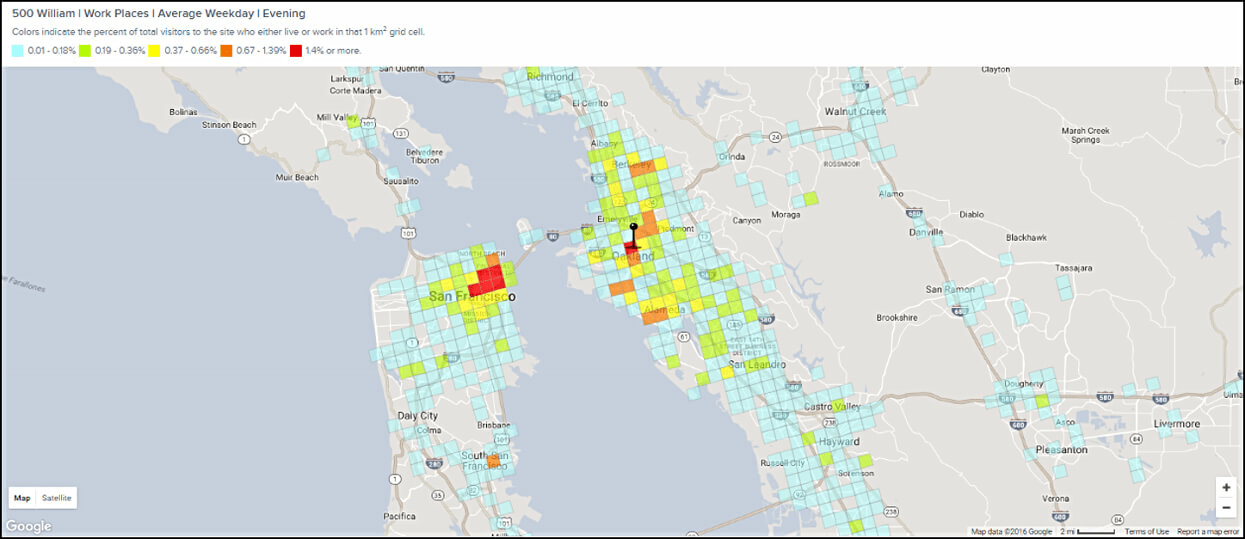
Figure 1: A scan of the San Francisco Bay area highlights the work neighborhoods of people who drive more than 40 miles per day, and currently live in high-hybrid adoption areas.
In addition to the out-of-the-box functionality of StreetLight Insight, custom apps and dashboards can be developed using LBS and GPS data, combined with maps of high hybrid penetration data, existing EV charging station data, and preferred utility charging locations.
These are just a few examples of how StreetLight is using Big Data to do our part. We know there is much more work to be done – and are always happy to discuss new opportunities to collaborate, and ways that we can use Big Data to improve transportation and help make the planet healthier.