
Exploring Sample Size with a Daily Trip Sample Ratio for Commercial Vehicles Across the U.S.

Sample size is not a simple concept when it comes to Massive Mobile Data Analytics. In this post, we’re analyzing our commercial vehicle data’s sample size across the U.S., updating a 2016 study we performed, based on a Daily Trip Sample Ratio. In short, our archival data captures ~18% of commercial vehicle trips that took place across the 881 permanent counters to which we compared our data.
Daily Trip Sample Size
For this analysis, we chose the Daily Trip Sample Ratio as the unit of sample analysis because “trips” are the active unit for most of our clients’ projects. Therefore, we consider it a “useful” measure of sample (compared to pings, for example).
First, we collected truck data from the Federal Highway Administration (FHWA). We used a high-quality sample of 881 permanent counters across the United States with robust counts, representing over 25,000 hourly observations per month across 2019 (see Figures 1 and 2 below). This data set gave us the estimated Heavy Duty and Medium Duty truck trips that pass each location each day. For each day available, we counted the trips captured by StreetLight Data, and divided them by the permanent counter’s observation, for both Heavy Duty and Medium Duty vehicles.

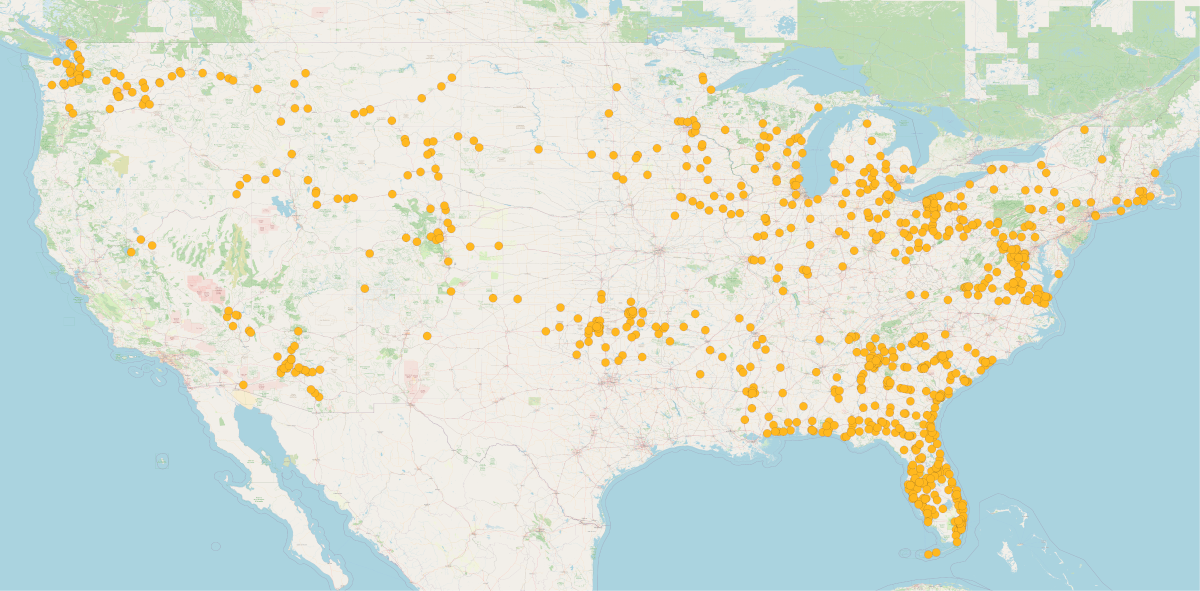
Figure 1: Permanent count locations from FHWA’s Weigh-in-Motion (WIM) stations data set.
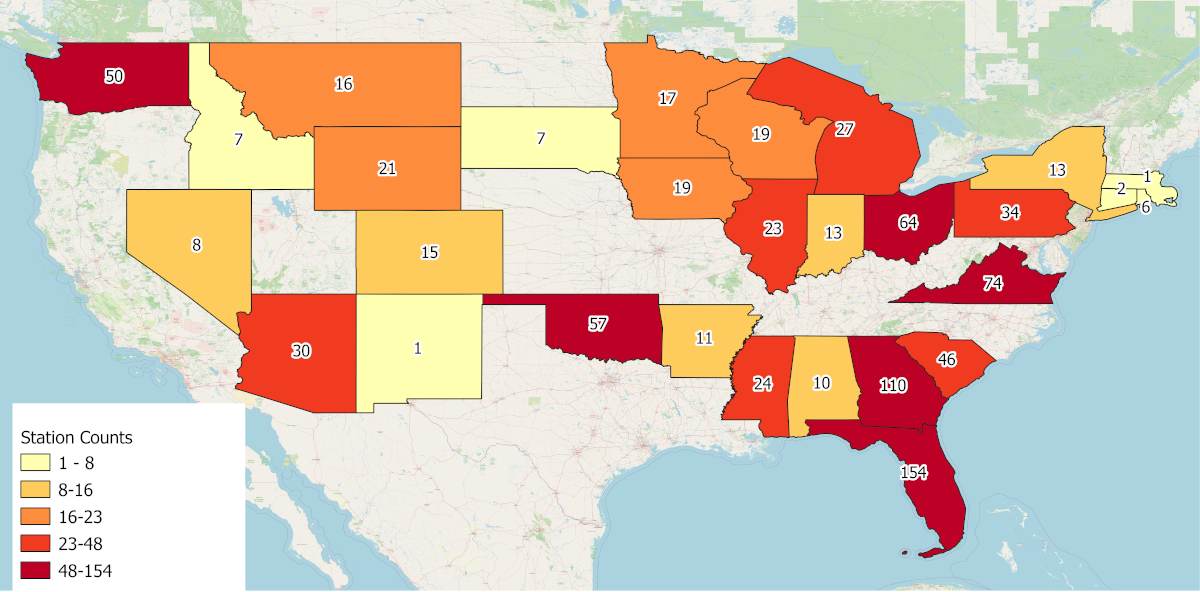
Figure 2: FHWA comparison counter sample size by state.
On average, StreetLight’s sample size represents 18% of the trips made across these stations. This was higher for Medium Duty trucks (31% of trips captured), and lower for Heavy Duty trucks (11%). StreetLight’s trip count also correlated extremely well with the permanent counters with an R2 of .91, with similar values for both Heavy and Medium Duty trucks. We consider this a very strong result.
Rural vs. Urban Regions
It’s important to know whether the Daily Trip Sample Ratio was consistent across rural and urban regions, or between state jurisdictions. We classified regions as low, medium, and high density depending on the population per square kilometer.
The results held up quite consistently, with Daily Trip Sample Ratios from 15% (low-density regions) to 22% (high-density regions). Figure 3 (below) is a map of the commercial truck penetration rate across the U.S. – it is good to see a consistent rate across geographies. Looking at this by state, results ranged from a penetration rate of 10% to 30%.
Of course, this is just one approach, and there are several other approaches that we could look at in the future. For example, we could also explore how sample size holds up hourly – this could be important when looking to measure rush hour, congestion, speed reductions during heavy traffic hours, and more.
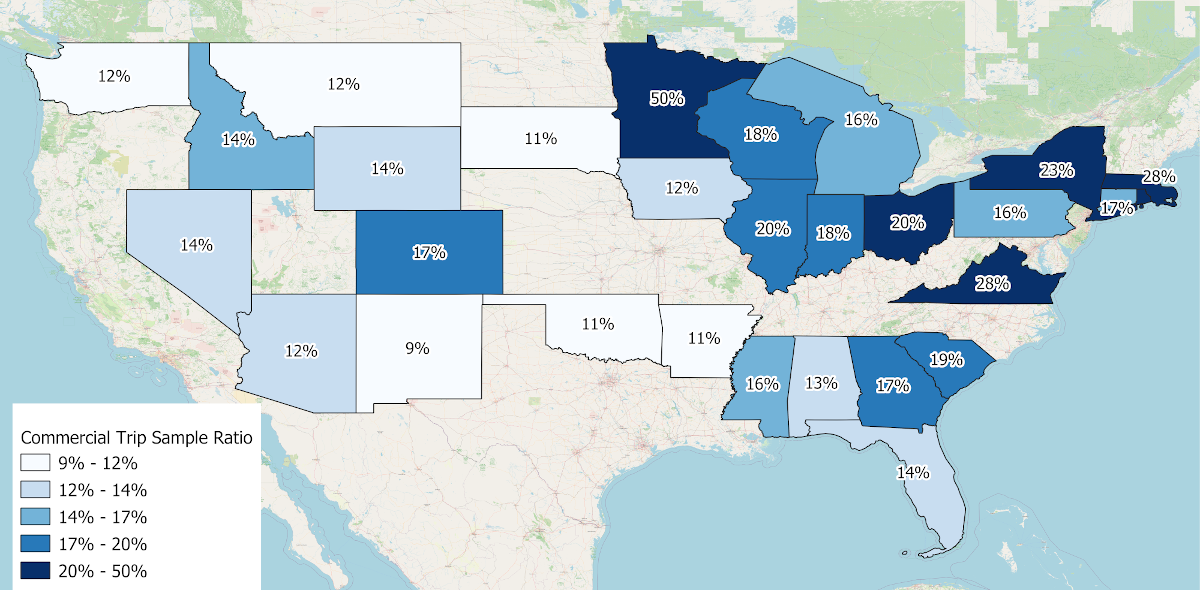
Figure 3: StreetLight Data commercial truck penetration rate across the U.S.
Check back on the blog for upcoming posts about personal vehicle sample, other techniques to measure sample size, and much more! Let us know in the comments if there’s a specific topic you’re interested in.
StreetLight InSight Analysis of Income of Bridge Travelers
I was one of those voters when I realized I have access to all the data I need. I set up a Project in StreetLight InSight to get an income breakdown for all of 2017 for travelers across the eight Bay Area bridges that will be affected by the toll increases. I included the Golden Gate Bridge too (although it is not included in the measure) because I was curious.
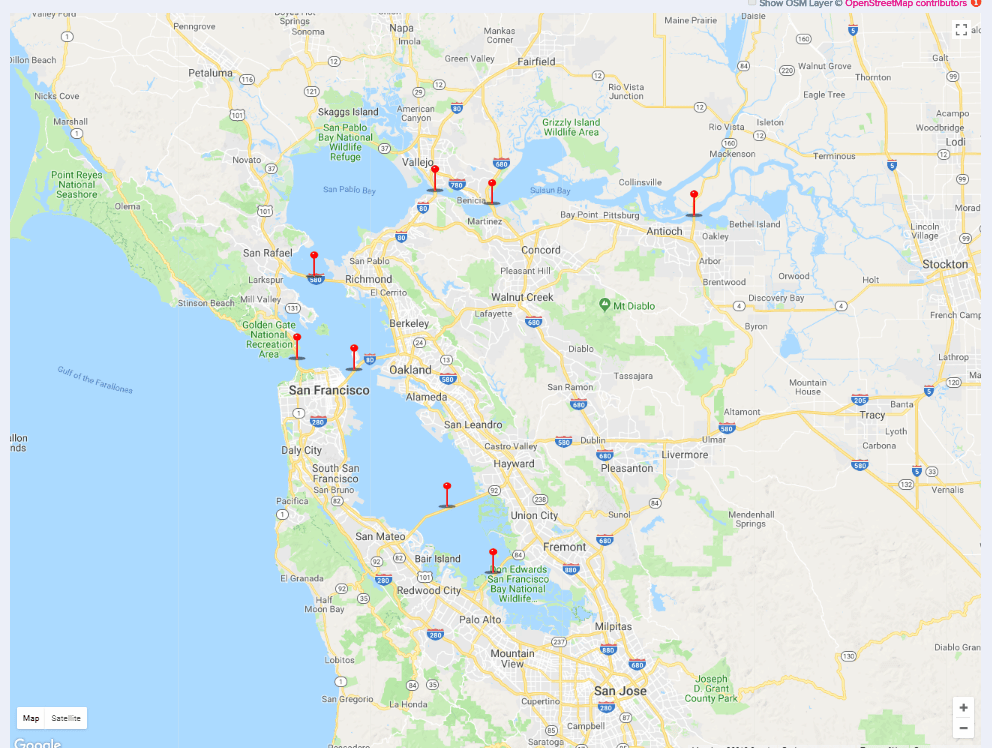
Map of the 9 bridges analyzed for this comparison.
First, we compared the average income of bridge users during weekdays, weekends, and also compared that to average county incomes. The chart below shows the results. As you can see, there is a significant difference in the income of different bridge users. For examples, users of the Dumbarton Bridge on average make over 20% more than users of the Carquinez Bridge. Weekends are much more equitable in terms of bridge income than weekdays.
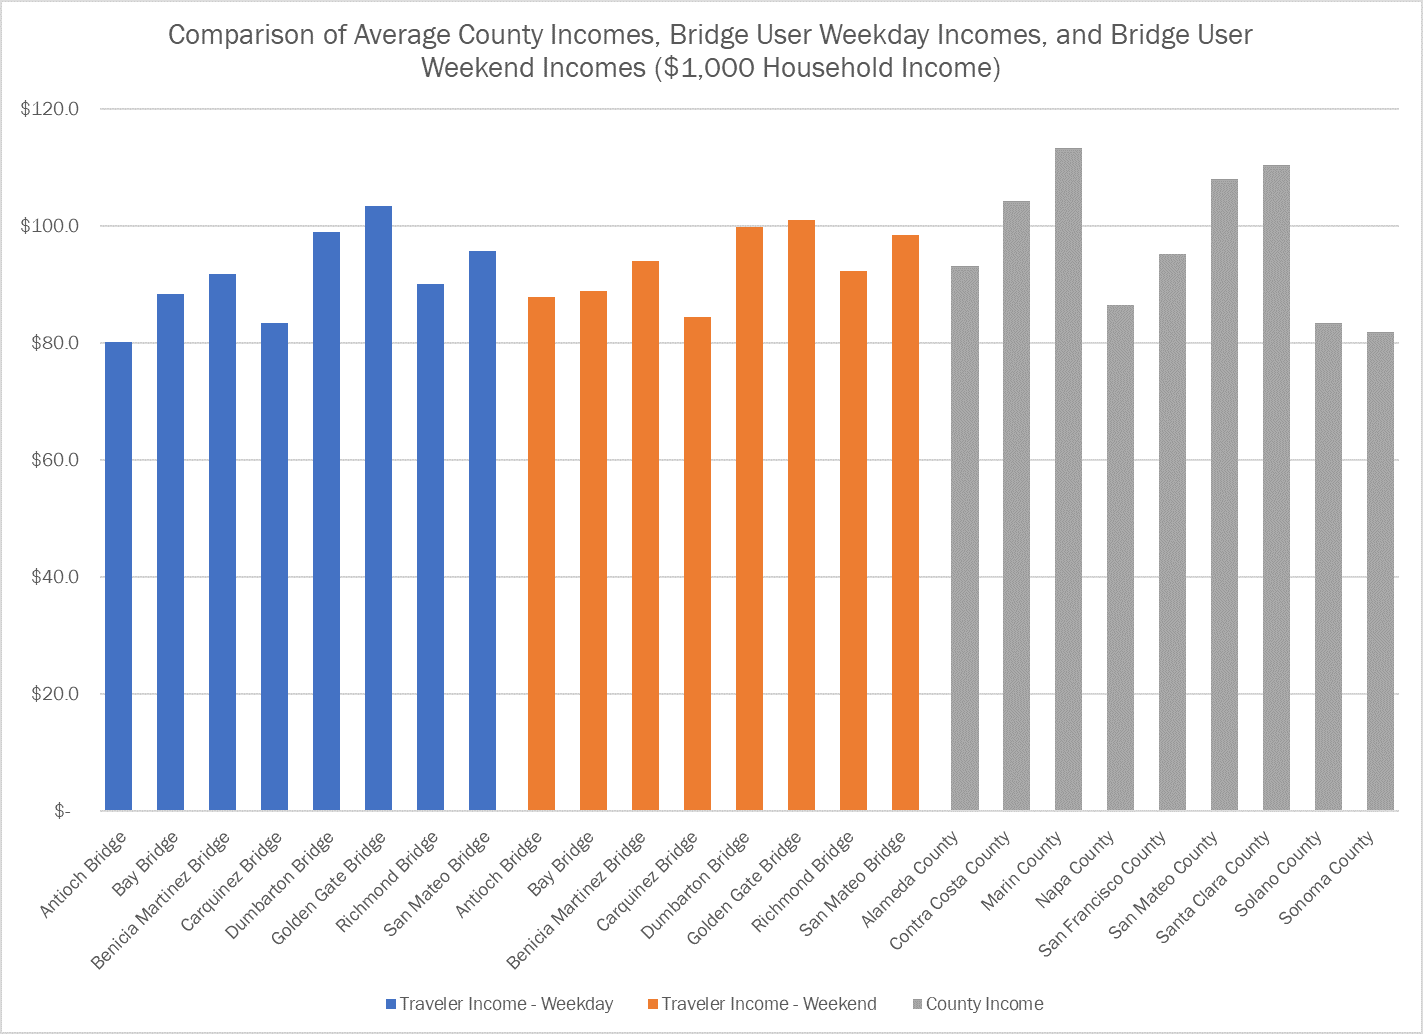
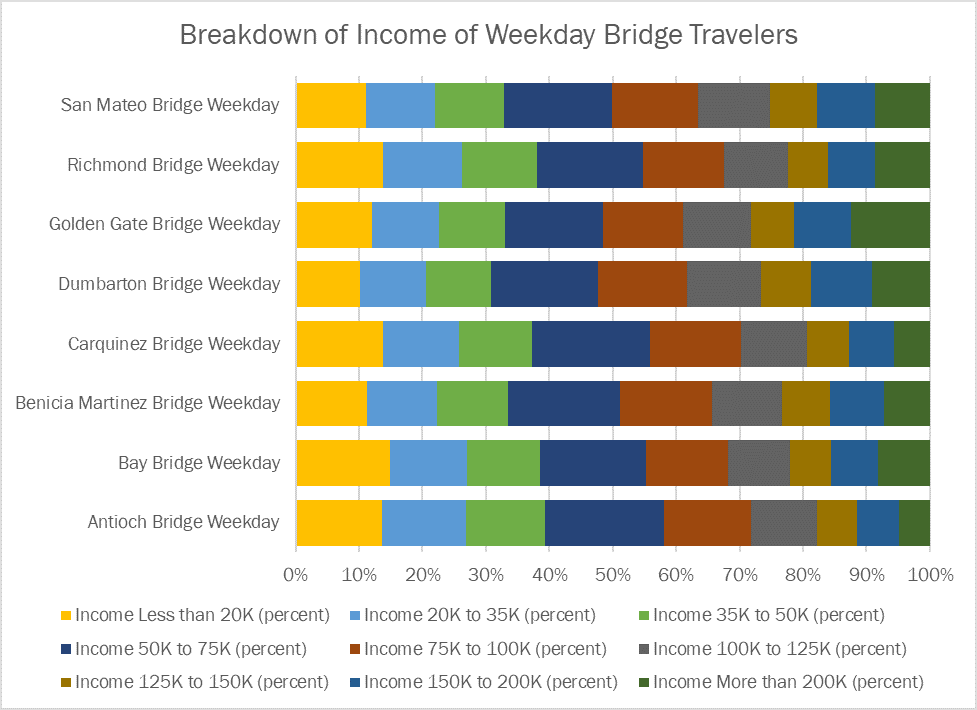
Because averages can sometimes be misleading, we also created charts showing the breakdown of income classes for bridge users, and the counties. All this just took a few clicks in StreetLight InSight.
This type of data should be considered when distributing resources that will help mitigate the impact of the toll increases on the users of the bridge. For example, the measure could allow for moving up the schedule to relieve lower income bridges with new transit and carpool lane options sooner.