
Studying Salem’s Halloween Transportation Nightmare

On the first weekend in October I flew across the country to Salem, Massachusetts — America’s hub for all things Halloween. Salem is the home of America’s witch trials in the 17th century, and rather than cloud themselves with this unfortunate history, the city dedicates much of their downtown to honoring the folks who suffered persecution.
Due to the nature of my job in the transportation industry, I couldn’t help but notice and wonder about the congestion I saw in downtown Salem. Was this transportation problem normal? Who was causing it, and how? Could it be mitigated? When I got home, I immediately hopped on StreetLight InSight® to run some analyses.
Studying Scary Congestion Issues
First, I wanted to know if Salem’s transportation problem was seasonal. Downtown Salem is a tourist destination all year round, but on my trip I learned that over 500,000 folks visit the town every October, so I assumed this traffic was not normal.
Then, I wanted to learn more details about how much worse October congestion was, and who was causing it. For this, I ran two analyses in StreetLight InSight: a Zone Activity analysis with Home and Work Locations and also a Segment analysis. With these two analyses, I was able to understand where visitors to downtown Salem were coming from, and also quantify several details about the increase in October.

Ghostly Visitor Details Come Into View
Using the Home and Work Locations analysis, I learned that travelers from all over the country visit Salem on an average weekend day in October (including myself, from San Francisco). This shows that Salem is not just a regional weekend activity, but rather a national attraction!
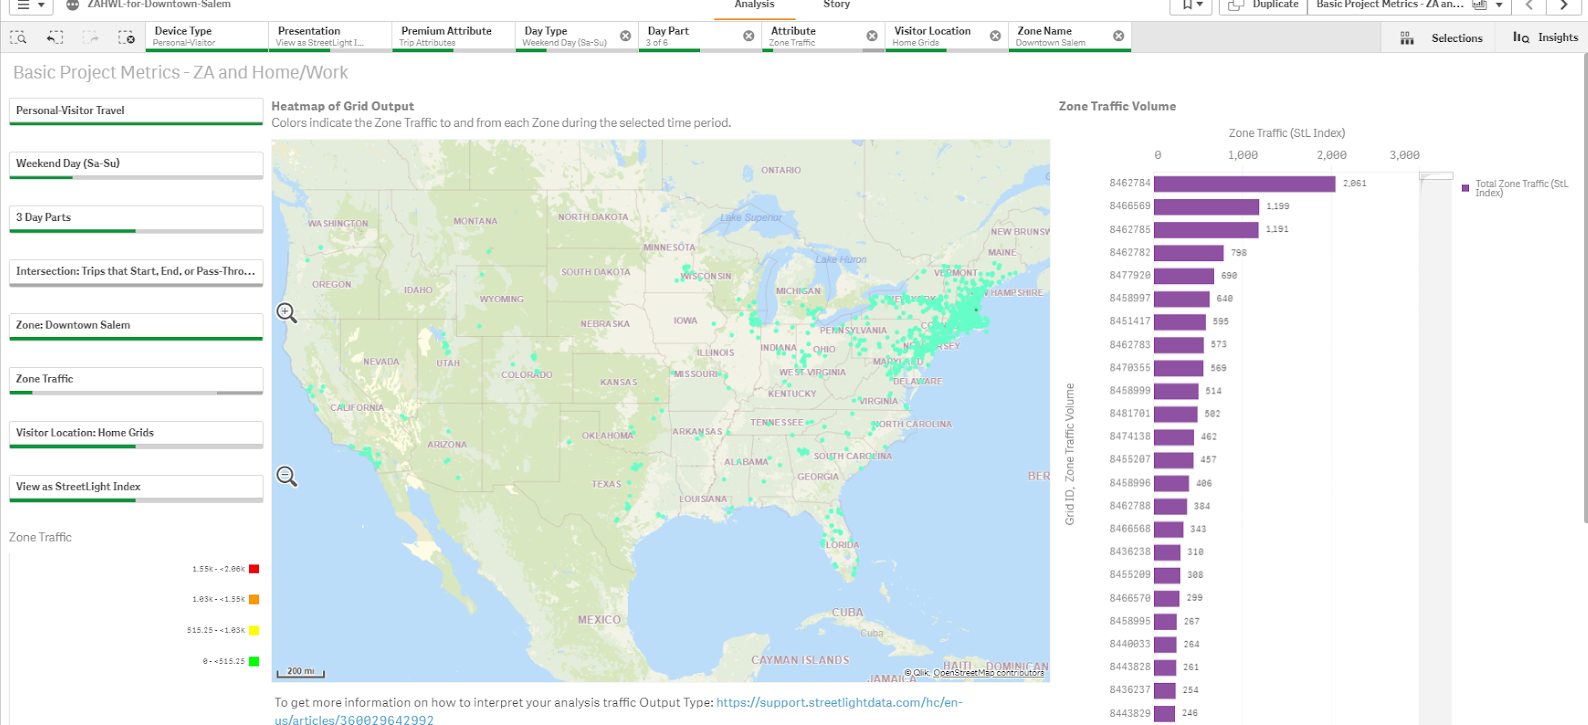
Heat map of home locations for visitors to Salem in October.
Zooming into Massachusetts, specifically, the analysis pinpoints that the highest percentage of trips come from areas around Salem, indicating that most visitors are probably driving in for the weekend. This regional transportation causes a lot more congestion and parking issues rather than people flying in and staying within walking distance to downtown.
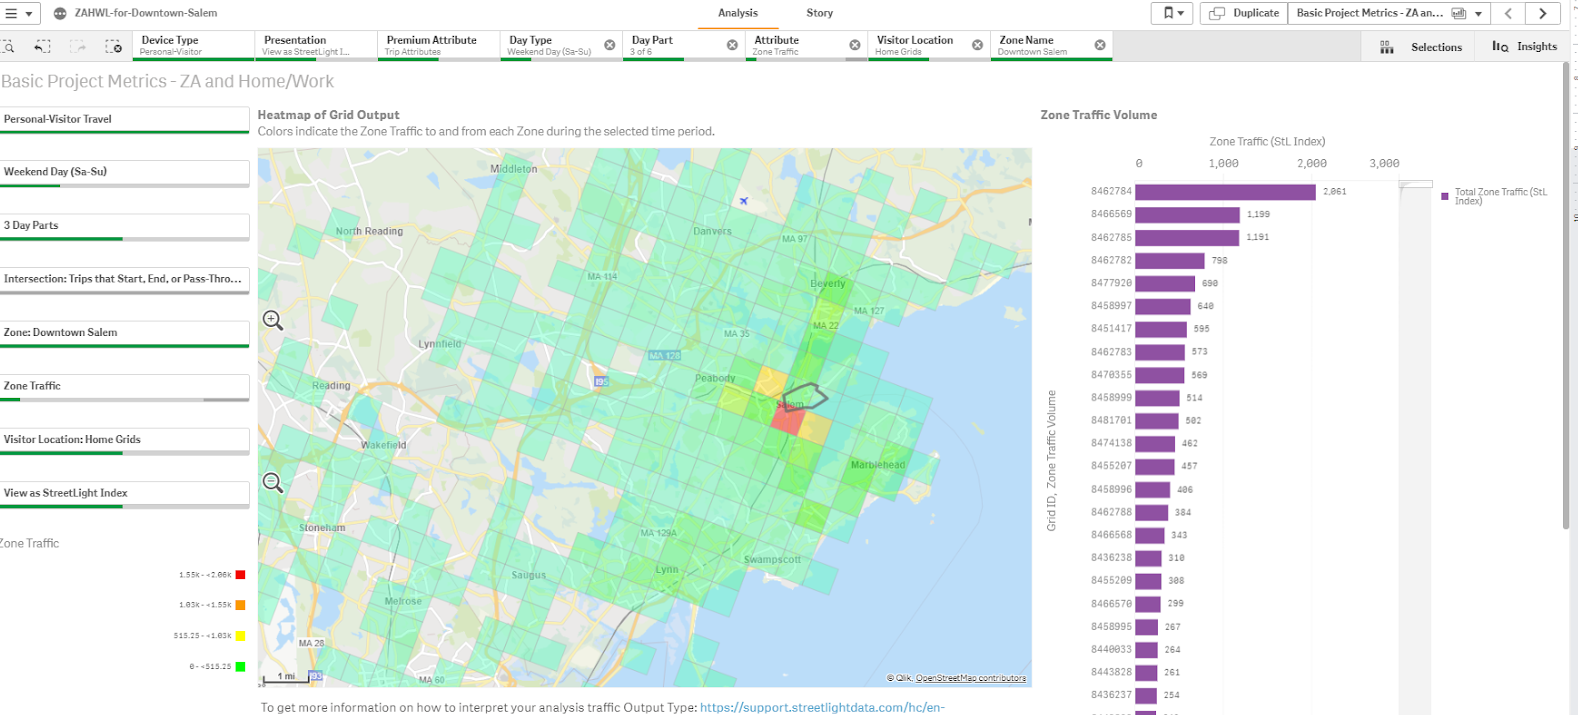
A closer look at the heatmap for regional visitorship to Salem. More visitors travel from red and yellow blocks than green.
Trip attributes showed that most of Salem’s regional transportation is coming from 2-20 miles away, indicating that folks weren’t traveling too far. But the duration of the trips was anywhere from 20-60 minutes. The time/distance ratio indicates that there are some local trips taking a long time, more likely resulting from congestion than distance traveled.
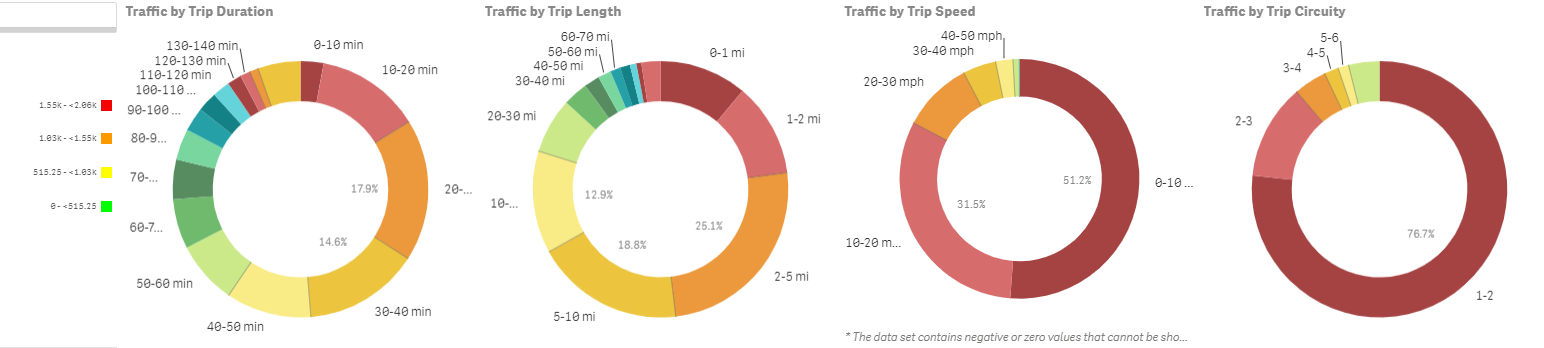
Trip details show high circuity and low speeds for Salem’s short trips downtown.
Traffic Speeds Die a Slow Death
While on my trip, I saw cars waiting in traffic to get as close to downtown as possible or struggling to find parking. I used our Segment analysis to look into average segment speeds for this downtown congestion in March versus October.
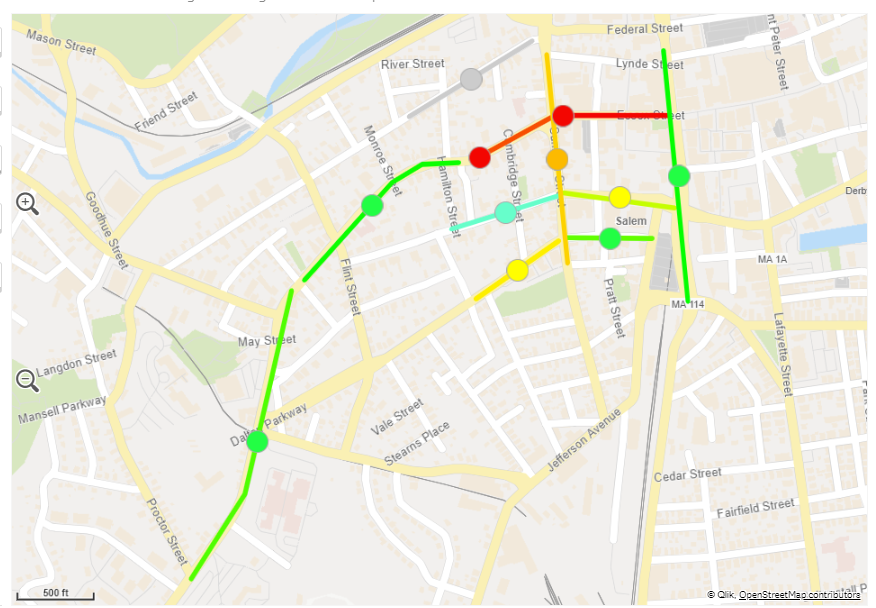
Heat map shows slower speed travel downtown in red.
I created a zone set for the downtown roads and the main road into Salem. The average speed in March 2018 seemed pretty normal in the peak a.m., at about 22.6 mph on selected downtown roads. Without a lot of congestion, this makes sense for normal Salem transportation — the roads are narrow and there is a lot of pedestrian traffic.
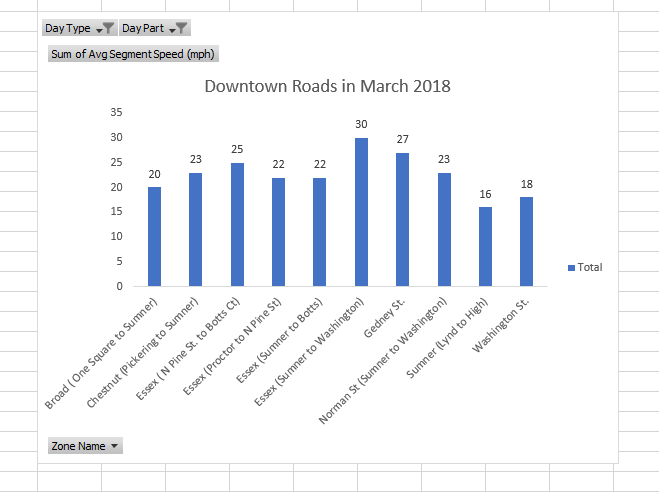
A closer look at specific speeds on individual streets for an average March day.
When comparing these roads to the same weekend peak a.m. time frame in October 2018, the analysis shows a dramatic difference in average speeds. The average mph for every road fell, with the overall average speed dropping from 22.6 mph to 16.1 mph. The biggest drop was on Chestnut St., with traffic moving almost 20 mph slower!
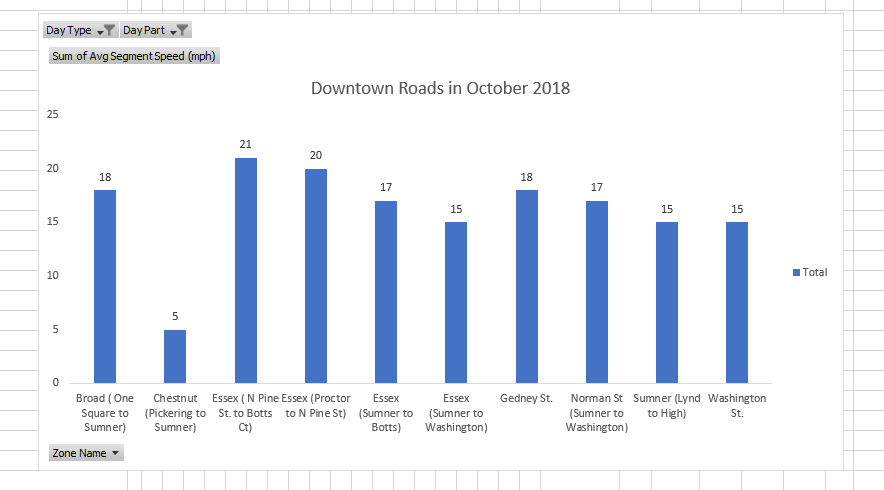
October traffic is notably slower than March on Salem’s downtown streets.
Salem’s Transportation Can Rise From the Dead
The data quantified what my gut-feel suspected: Salem’s transportation issues get pretty scary in October. My analysis also revealed helpful details about who contributes to the increase, and how it affects travel through downtown.
While these results might seem spooky and daunting to Salem drivers, there is clearly room to fix the problem. Maybe there’s an opportunity to offer shuttles from the most popular home locations identified in the first analysis. I also noticed scooters in the area, so perhaps Salem could add more transportation mobility share in areas further from downtown to keep folks from driving in the area.
Salem is a gorgeous, funky, and historical town. With this powerful information from Big Data, future visitors to Salem could be scared by the haunted buildings and ghost tours, not by congestion.