
How Shared Automated Electric Vehicles Can Streamline Future Mobility

There is growing consensus that to stabilize the climate, we will need to rapidly shift our transportation system to electric vehicles (EVs). Meanwhile, the increased use of automated vehicles and ride-sourcing services like Uber and Lyft could revolutionize our transportation system, but also threaten to increase vehicle travel.
The culmination of these trends is the shared automated electric vehicle (SAEV), which could combine the safety and convenience of self-driving cars, the efficiency of shared mobility, and the sustainability of EVs. But there are many uncertainties about how a SAEV service might operate. How many vehicles would be needed? How much battery range will the vehicles need, and how many charging stations? And how will these fleets impact carbon emissions and the U.S. electricity grid?
What If All Cars Were EVs?
Our research team from LBNL, UC Davis, UC Berkeley, Emerging Futures, Marain, and the ICCT recently published an article in Environmental Science & Technology analyzing a hypothetical future scenario where 100% of personal vehicle mobility in the United States is provided either by private EVs or by SAEVs. We explored how such a fleet might work in practice, and assessed the impacts on carbon emissions, transportation cost, and the electric grid.
Previous studies had looked at SAEV fleets serving a small fraction of trips in a major metro area, but if SAEVs prove as cheap and convenient as anticipated, they could come to dominate the transportation sector, serving significant portions of all trips in areas ranging from urban cores to small towns and rural areas. Analyzing such a radical transition requires data at a similarly massive scale.
Large-Scale Impact Analysis
Working with StreetLight Data, we compiled data for nine combined statistical areas across the U.S. including trip volumes, distances, durations and speeds between traffic analysis zones in each area. We selected these regions to represent a wide range of geographies, densities, and urban forms. We then input this data into an agent-based simulation framework (Routing and Infrastructure for Shared Electric vehicles, or RISE) that routes vehicles to serve trips and to charge over the course of an average day, while ensuring that demand is met efficiently.
One of the main uncertainties in the impact of SAEVs is how many empty miles vehicles will travel for every mile with a passenger ( known as the “deadheading ratio”). Currently, many fleets operate with deadheading ratios of around 40%, meaning that vehicles are driving without a passenger almost half of the time.
But through our simulations with StreetLight Data, we found that this ratio depends on the density of trips in a given area – the more trips there are, the more likely each one will be served by a vehicle that is already close by. In turn, this means that in the future, if the majority of trips currently done in private vehicles are replaced by SAEVs, deadheading could fall to less than 15% in most areas.

Figure 1. Ratio of empty miles to total vehicle miles (deadheading ratio) in each simulated region versus square kilometers per trip, a measure of trip density. Multiple points for each region represent scenarios with different levels of trip volumes. The dotted line shows a square root regression fit.
We then input these results into an optimization model (Grid-integrated Electric Mobility or GEM) that determines the least-cost combination of vehicles and chargers. The model also takes into account the different cost and carbon emissions associated with charging at different times of day, and identifies the optimal way to schedule charging while still keeping travelers satisfied. Each of these steps involves complex trade-offs; for example, charging is both cheap and clean in the middle of the day when solar generation is high, but many vehicles are needed to serve trips during that time.
One Automated EV = 11 Personal Vehicles
Through this analysis, we found that SAEVs could dramatically reduce both the cost and environmental impact of personal mobility. Due to the lower deadheading rates, we found that each SAEV could replace an average of 11 private vehicles. While rural regions would require longer-range battery capacities than urban regions, we found that only 4% of the SAEV fleet would need a range of 225 miles to satisfy all trips in these areas, and SAEVs in urban regions would be able to serve all trips with a mixture of 75- and 150-mi. range vehicles, and virtually no longer-range vehicles.
In turn, these efficiencies could reduce cost by over half, saving $570 billion per year nationwide. Decreased vehicle manufacturing would reduce carbon emissions by almost half compared to private EVs, and 70% compared to gasoline vehicles, or 800 million tons of CO₂ per year. Because the fleet would charge at the cheapest times, peak electricity demand from transportation could be reduced by almost half, almost as much as optimizing the charging schedule of each individual private EV.
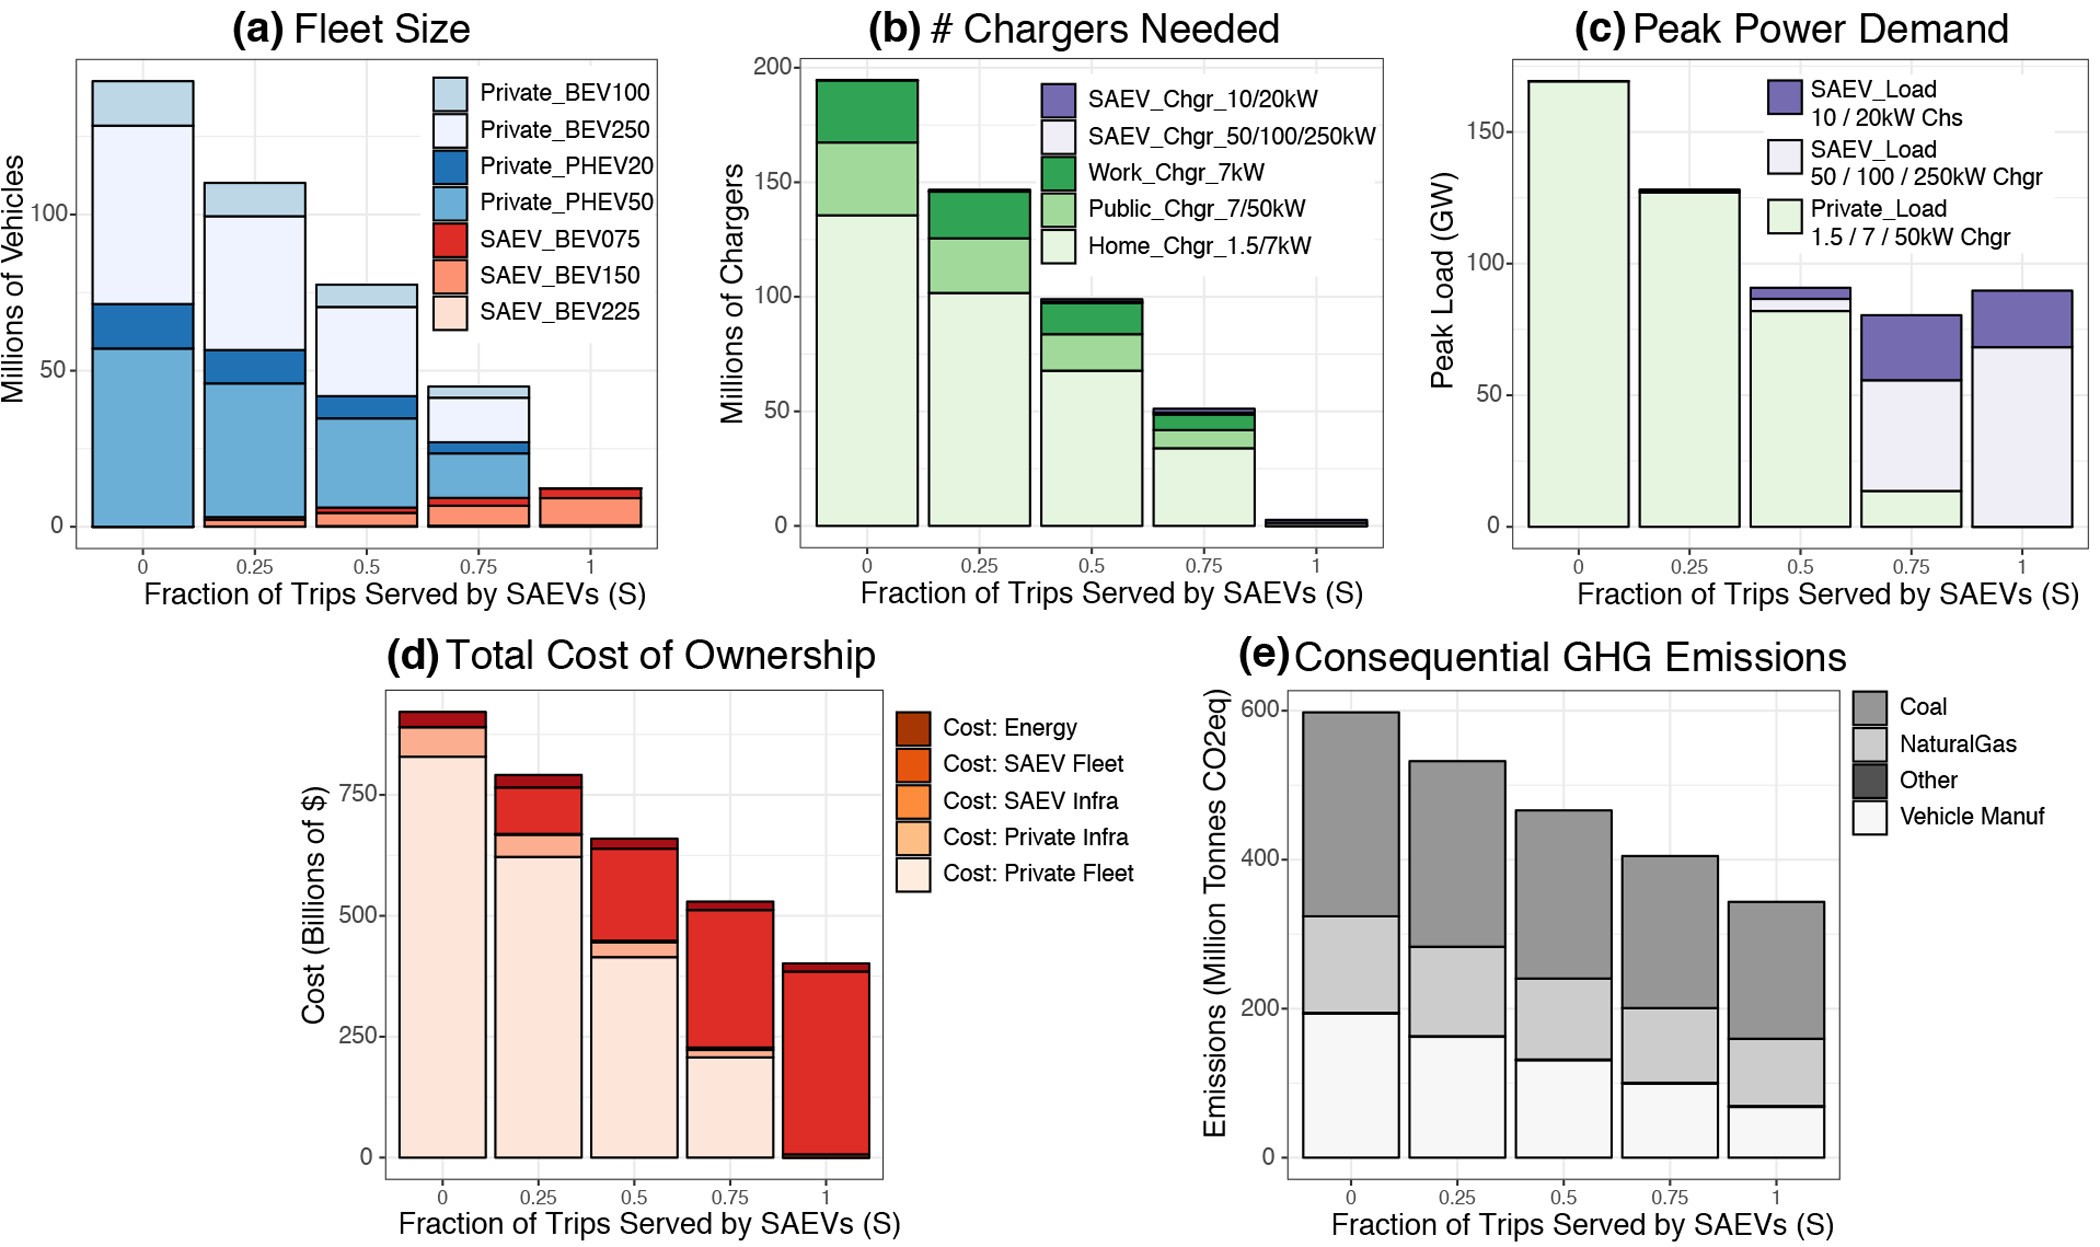
Figure 2. (a) Fleet size, (b) numbers of chargers, (c) peak power demand, (d) total cost of ownership, and (e) consequential GHG emissions versus fraction of trips served by SAEVs.
There are many uncertainties as to how or when this future might come to be, including the safety of automated vehicles, implications for labor, and consumer preferences for shared versus private transportation. But through large-scale modeling facilitated by big data, this study shows how these technologies might operate if adopted at a national scale and provides some insight into the potential for large economic and environmental benefits.Summarized from “Private Versus Shared, Automated Electric Vehicles for U.S. Personal Mobility: Energy Use, Greenhouse Gas Emissions, Grid Integration, and Cost Impact” by Colin J. R. Sheppard, Alan T. Jenn, Jeffery B. Greenblatt, Gordon S. Bauer, and Brian F. Gerke, Environmental Science & Technology 55, no. 5 (March 2, 2021): 3229–39.