
Special Events Analysis: Golden State Warriors Game Attendance

When the Warriors ended their 2018-19 season — so close to repeating their 2017 NBA victory! — they also ended their stint at Oracle Arena. In 2019, the Warriors will play in Chase Stadium in San Francisco’s Mission Bay area. Warriors fans like me will face new traffic patterns for game day attendance.
I was excited enough during the playoffs this year to use a few of our analytics tools to gather metrics on Warriors game attendance. I wanted to see what the stadium move might mean for fans like me on game days. StreetLight’s metrics turned up some interesting insights about how to analyze attendance for Warriors games, or any special event.
Set the Shot Clock with Data Period Analyses
With StreetLight InSight®, users can fine-tune the data period for analyses. “Data period” refers to the specific time period to analyze, down to exact dates and hours.
This feature is incredibly useful in understanding travel patterns for specific days or sets of days, whether it’s a game day, a holiday, or a natural disaster. Our metrics offer precise analytics for that time period in just a few minutes, and it’s really easy.
I began by isolating five Warriors home games for attendance in early 2019 for this study. These games took place in the lead up to the playoffs. I ran two studies with this custom data period.
- Home and Work Locations. This add-on provides aggregate home and work locations, Census demographics, and the relative volume of Warriors attendance at Oracle Arena.
- Origin-Destination to Pre-Set Geography. This analysis provides the origin and destination TAZs of vehicle trips to and from the Oracle Arena.

Determining ‘Home or Away’ Attendance
When looking at the Home and Work Locations results, one of the first insights I gathered was that a lot of the Warriors attendance during January and February 2019 was from the East Bay, closer to Oakland. However, attendance was geographically distributed around the Bay Area, to south, north, and far East Bay, and relatively faraway towns like Modesto and Stockton. While there was some San Francisco attendance traveling across the East Bay, I was surprised that we didn’t see higher numbers.
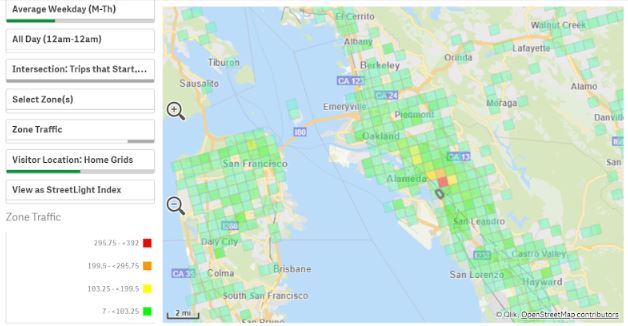
Figure 1: Distances of home and work locations for Warriors attendance at Oracle Arena on game days.
When I aggregated the top 10 zip codes for game attendance, they all are located in Alameda County (Oakland, Alameda, Hayward, San Leandro, Union City). Oakland alone contributes 18.5% of Warriors attendance.
When I zoomed out the map even further in the platform, I saw that about 1% of Warriors attendance came from even further afield locations – towns in Arizona, Florida, and Las Vegas.
To see how these results compared to a typical arena (non-game) event day, I ran a second Home and Work Locations analysis for early 2019. As you can see in Figure 2, the profile is different in a few key ways. First, the geographic reach is not as large as on game days. Lower Warriors attendance comes from the north, south, and far East Bay. Second, attendance was more concentrated in the Oakland area close to the stadium.
Another interesting insight is that 65% of early 2019 game attendance lived or worked 10+ miles from the stadium. What this means is that attendees were usually traveling long distances to attend Warriors games. For the most part, these long-distance travelers were probably driving or taking BART (the regional transit provider) to the games. With the recent location change of the stadium, we would want to consider how those travel patterns will change.
As shown below, typical 2019 general attendance at Oracle Arena (not just on game days) was closer in geography. Just under 60% of attendance came from more than ten miles from the inferred home or work location, compared to 75% of Warriors game attendance.
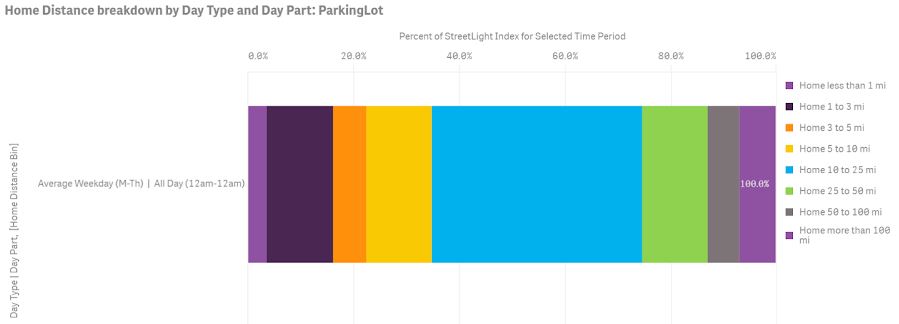
Figure 2: Distances of the inferred home and work locations for Warriors attendance to the Oracle Arena on game days in 2019. As you can see, more than 65% of attendance traveled over 10 miles to Oracle Arena.
Next, I decided to drill down on income levels. Not only was 2019 Warriors attendance geographically diverse, but also economically diverse. Now that the games have changed locations, will this change as well? Will there be different income levels for attendance at games at Chase Stadium? One factor to consider is that while income levels for Warriors attendance skewed slightly higher than for general stadium attendance, the overall distribution was fairly similar.
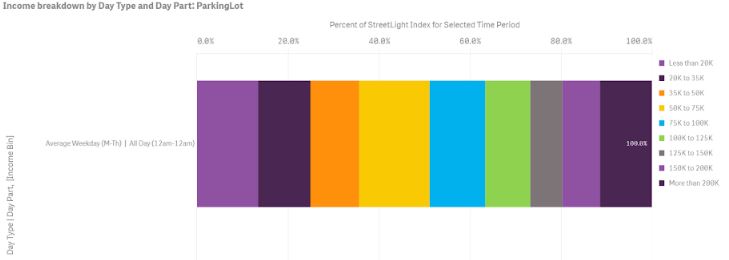
Figure 3: This shows the percentage of Warriors attendance in each income bracket. It shows that there is a broad range of income levels among attendees.
Origin-Destination Assists
I wanted to drill deeper into geographic data about Warriors attendance at the old stadium, so I decided to run an O-D to Pre-Set Geography.
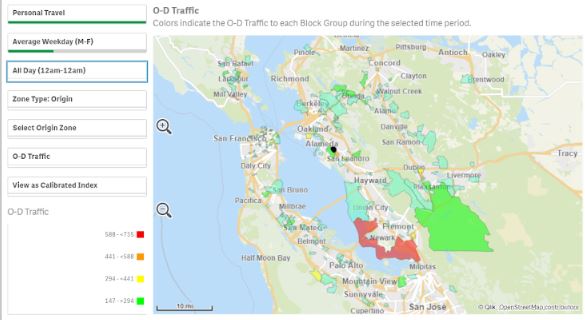
Figure 4: The heat map above shows the origins of vehicle trips to Oracle Arena on Warriors home game days in Jan/Feb 2019. While there are plenty of vehicle trips that make sense, a significant volume of vehicle trips are originating in areas with good transit options.
Some of the vehicle trips I found made a lot of sense. Warriors attendance was originating from far away places that lacked transit options – for example, it would be very time-consuming if not impossible to get to the stadium on transit from the Turlock area. However, there were also a lot of trips originating in places with great transit access (see Figure 6).
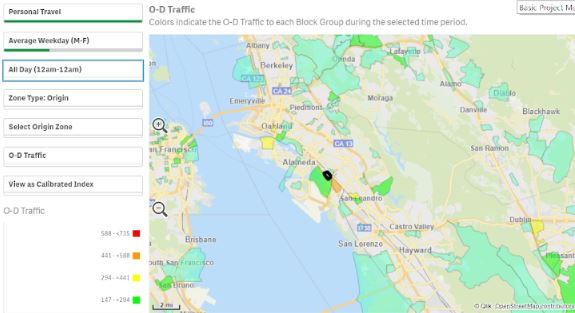
Figure 5: This is a zoomed in version of the heatmap in Figure 5. It shows the highest volume TAZs for vehicle trips to the Oracle Arena on game days. There are actually good transit options, including BART, in each of the red TAZs that light up for vehicle trips to the stadium.
I was surprised to see some areas that are on transit light up darker red. For example, San Francisco downtown had excellent transit to previous Warriors games, but it still lights up bright red. There are also parts of the E. Bay with good transit options that light up orange or red.
This was clearly a missed opportunity to shift those vehicle trips to the arena over to BART or other transit options. Could BART focus efforts on shifting Chase Stadium visitors to public transit? A highly targeted marketing effort could have a good chance of displacing at least some vehicle trips.
Final Score
As you can see, Home and Work Locations combined with the ability to customize the data period in StreetLight InSight is really helpful for studying attendance for any special event. I completed the entire process of setting up these analyses and running several studies in about 30 minutes. The results provided a ton of useful insights for identifying areas for further research in preparation for the Golden State Warriors’ first season in Chase Stadium.