


Much has been made of the environmental-impact “silver lining” of the COVID-19 pandemic stay-home orders. Plummeting traffic volume has created lower carbon output and greenhouse gas emissions, with previously congested and smog-choked cities reporting cleaner air and more abundant wildlife.
The tradeoff, of course, isn’t worth it. But what if this incredible environmental win didn’t cost us our health and economic security?
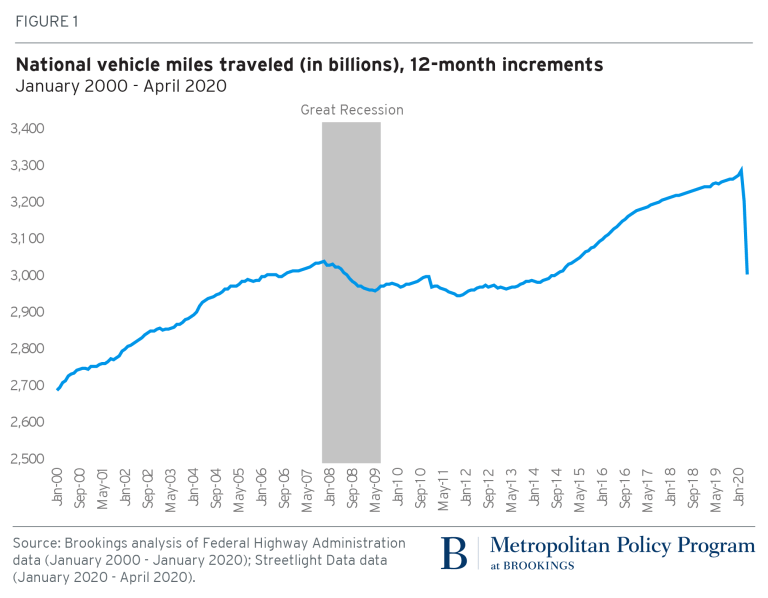
We’ve been tracking reduced vehicle miles traveled (VMT) totals across the country since March. And as the Brookings Institution recently found when analyzing our data, VMT hasn’t been this low since 1998.
As the country slowly recovers from COVID-19, forward-thinking transportation professionals are looking for ways to preserve some part of its environmental benefit. How can we encourage reduced vehicle miles traveled VMT in individual localities? What is a realistic percentage drop to aim for? Are there effective and budget-friendly ways to test? How do we analyze those options?
For answers, we turned to our 2020 U.S. Transportation Climate Impact Index. Ranking the top 100 major metro areas on a handful of emissions factors, the Climate Impact Index identifies metros with the most and least environmentally friendly transportation. Since VMT is the most heavily weighted factor on our list, updating that value makes a major difference in how these metro areas rank.
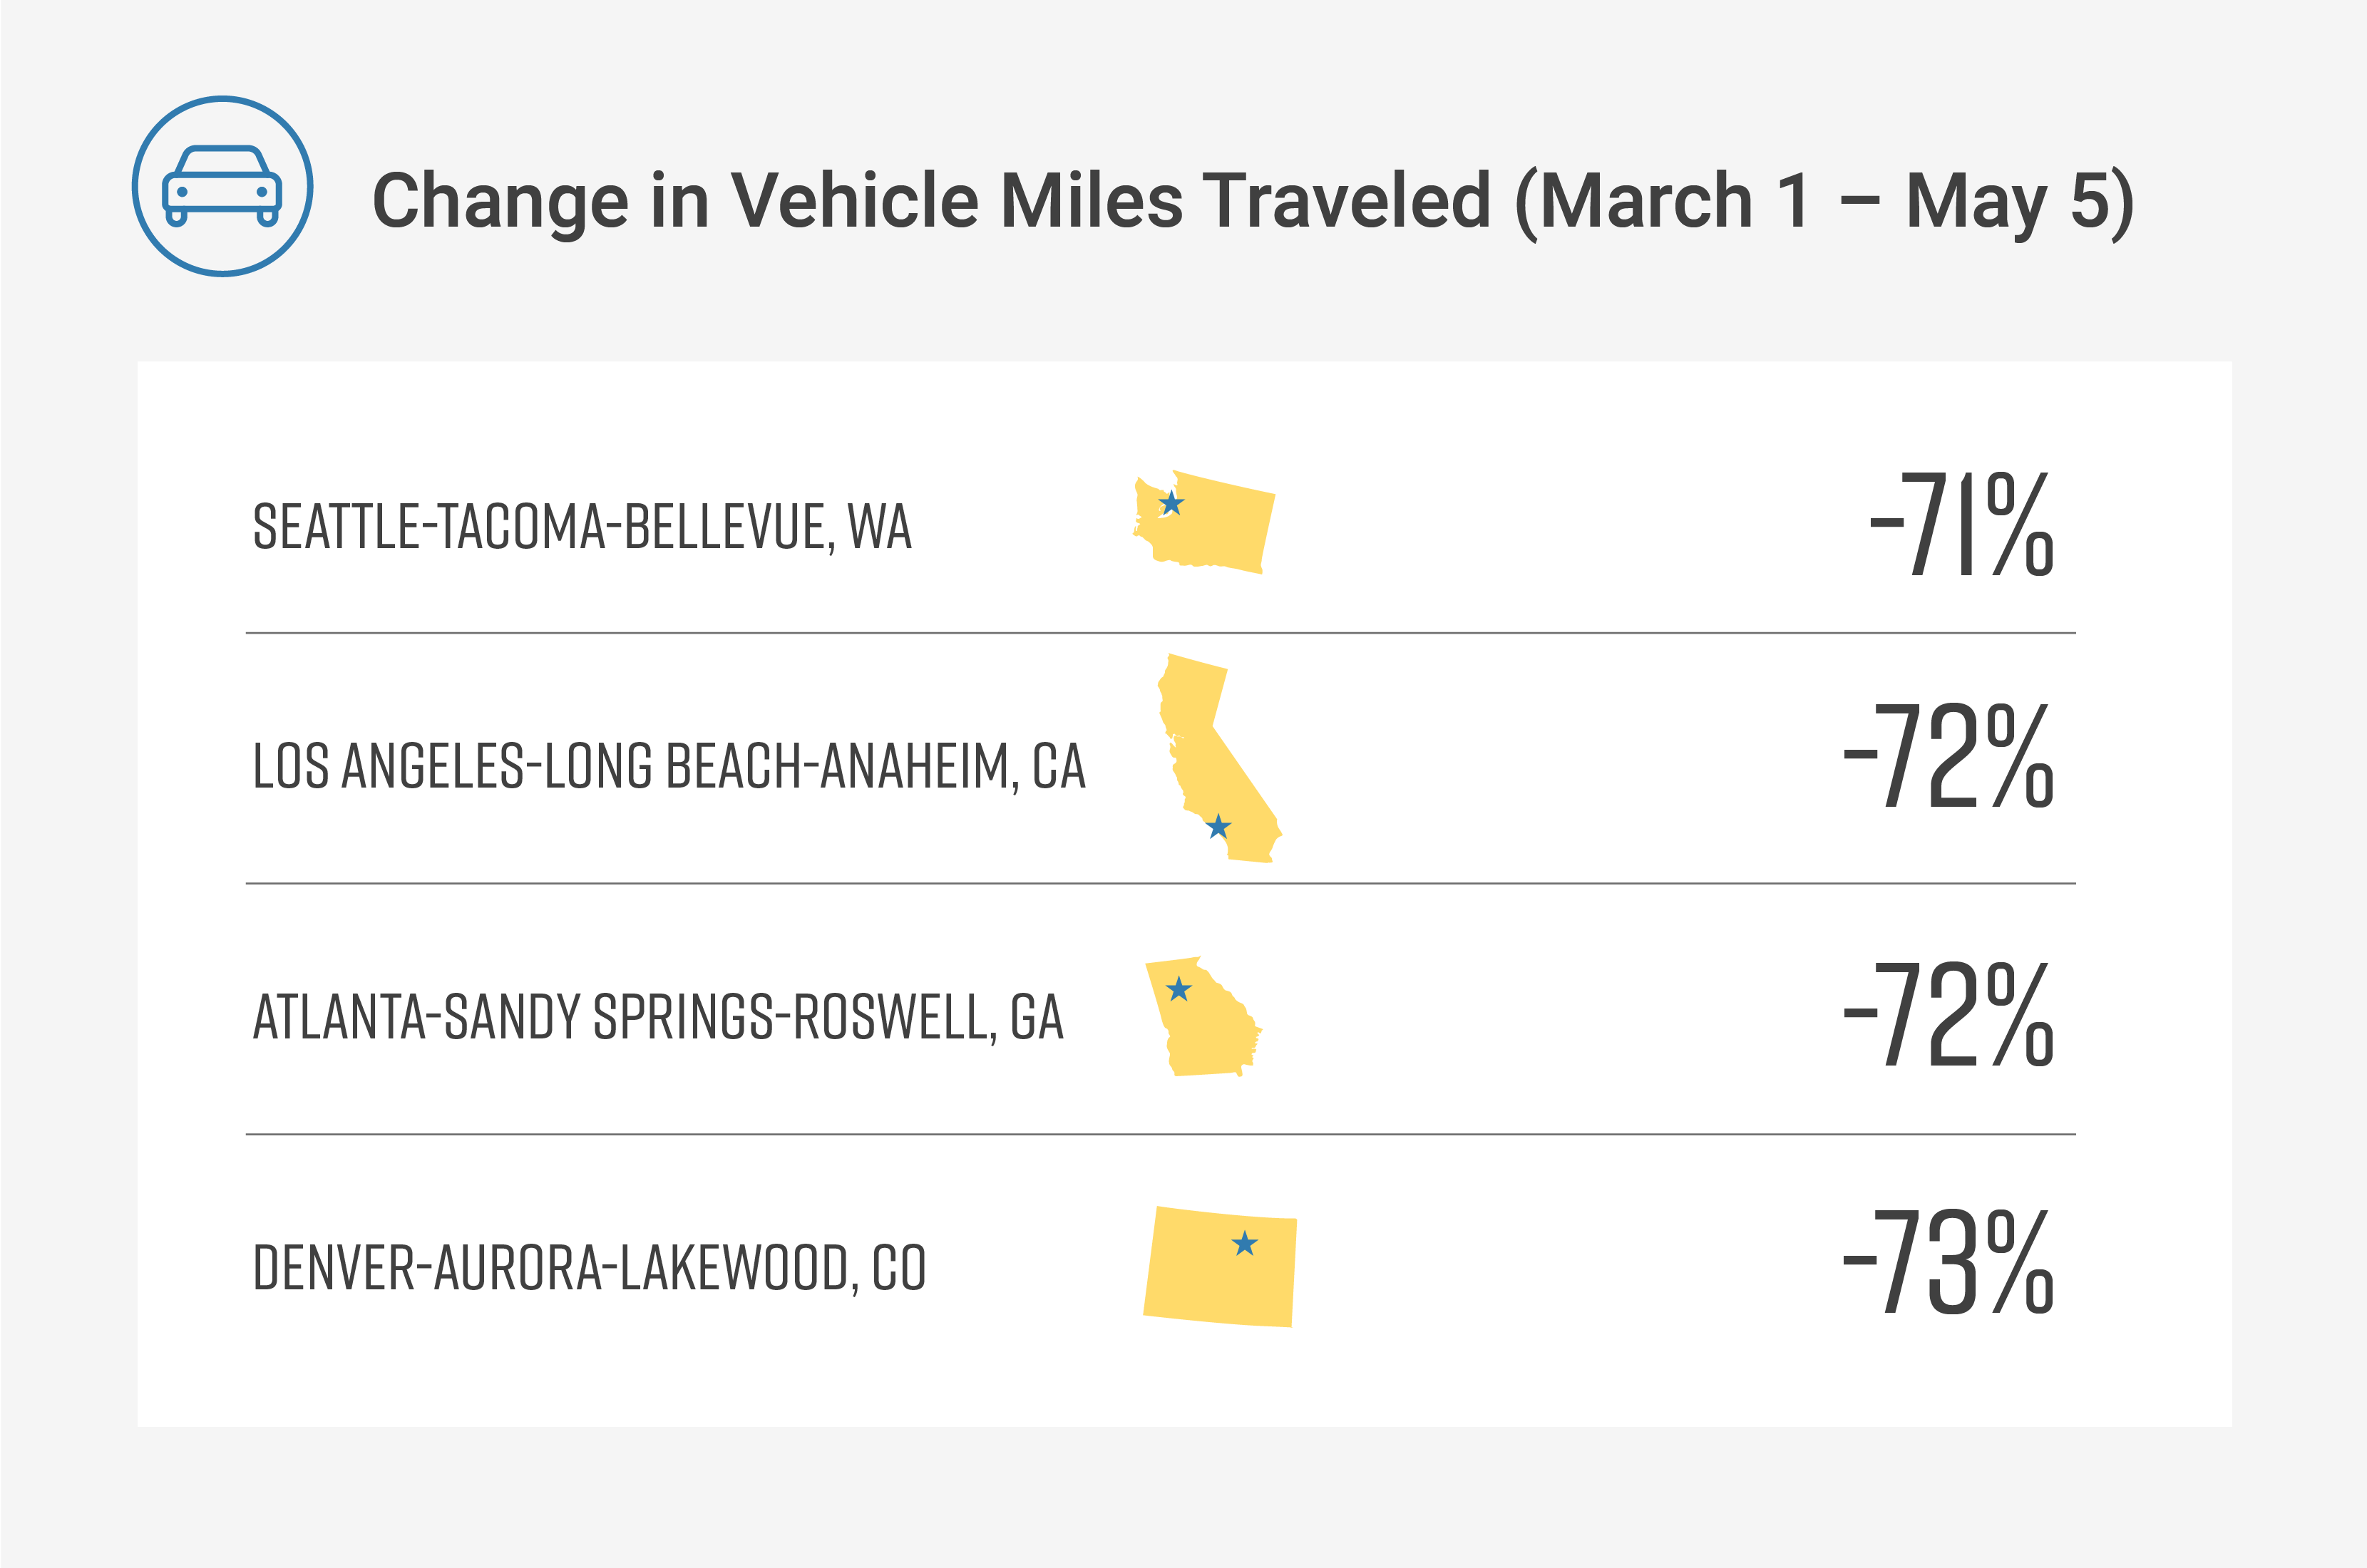
Although driving in most major metro areas fell by over 50% after March 1, that drop is probably not sustainable during post-pandemic recovery. We decided to start with 10%, which feels like an achievable target for a dedicated locality with a solid plan. Here’s how that goal could play out for four metros aiming to permanently lower VMT, if all other cities returned to their pre-pandemic levels.
Los Angeles: Reducing VMT for New Projects
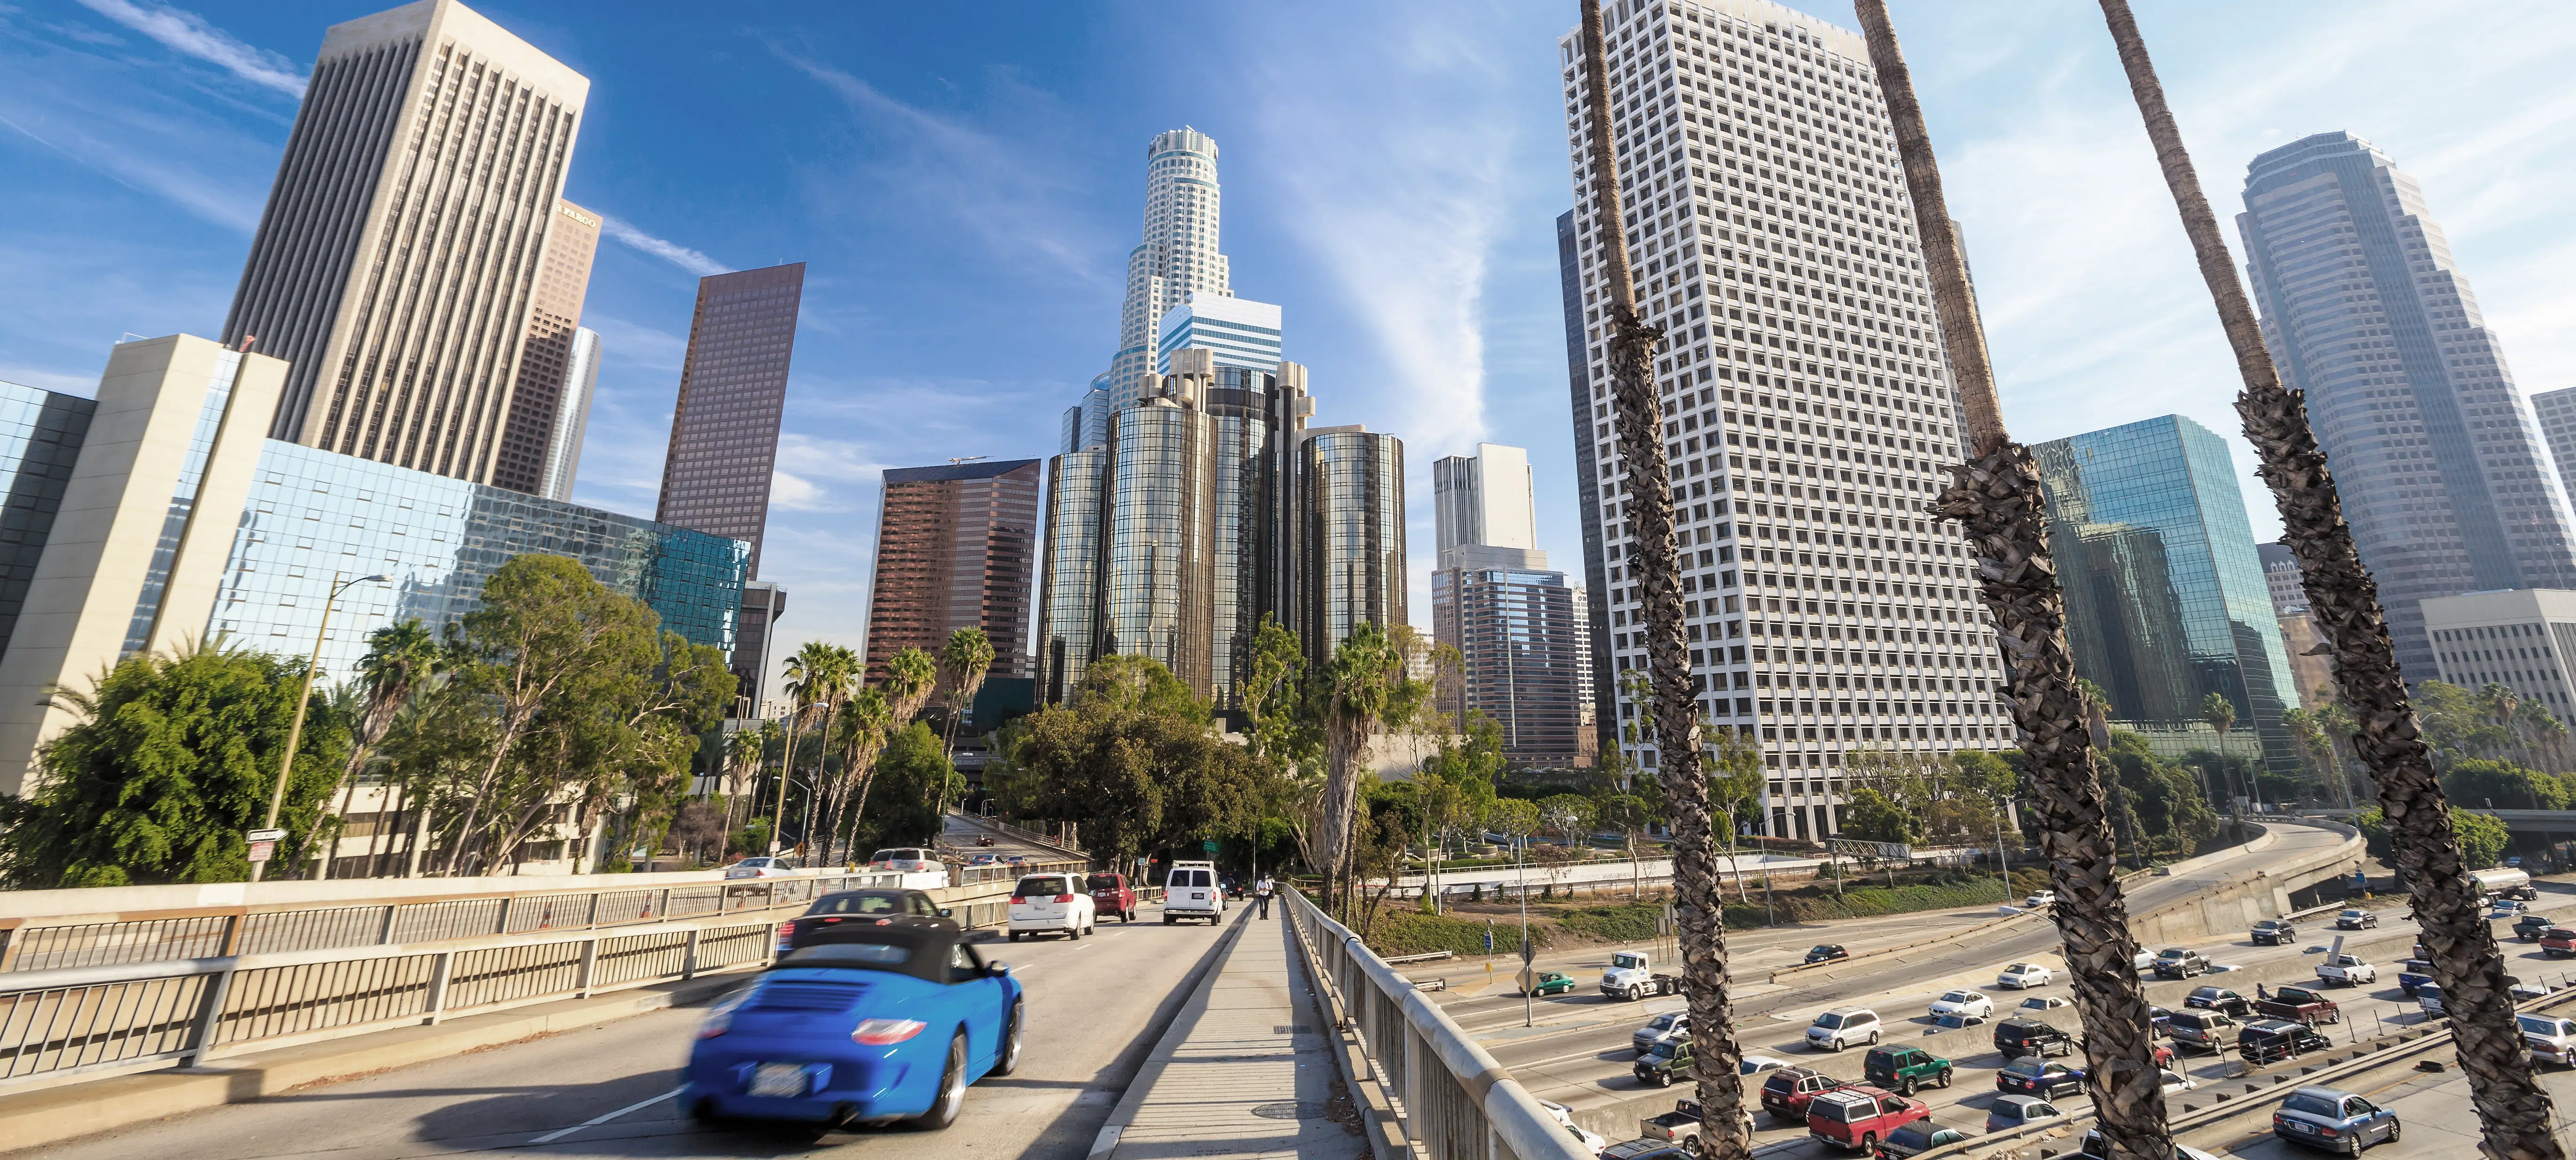

The highest-ranking metro area on our recast list could improve their ranking even more with California State Bill 743. This bill prioritizes VMT impact as a way to evaluate new building projects.
Planners previously measured impact by level of service (LOS), evaluating whether or not the nearby roads could handle the projected traffic increase. But lawmakers expect that limiting new construction to equal or reduced VMT instead will prevent traffic increases and encourage denser development. We expect the combination of VMT limits and increased density to improve emissions in Los Angeles, and the rest of California.
JOIN OUR LA WEBINAR for insights on measuring emissions impact of transportation projects >
Denver: Closing Streets to Cars
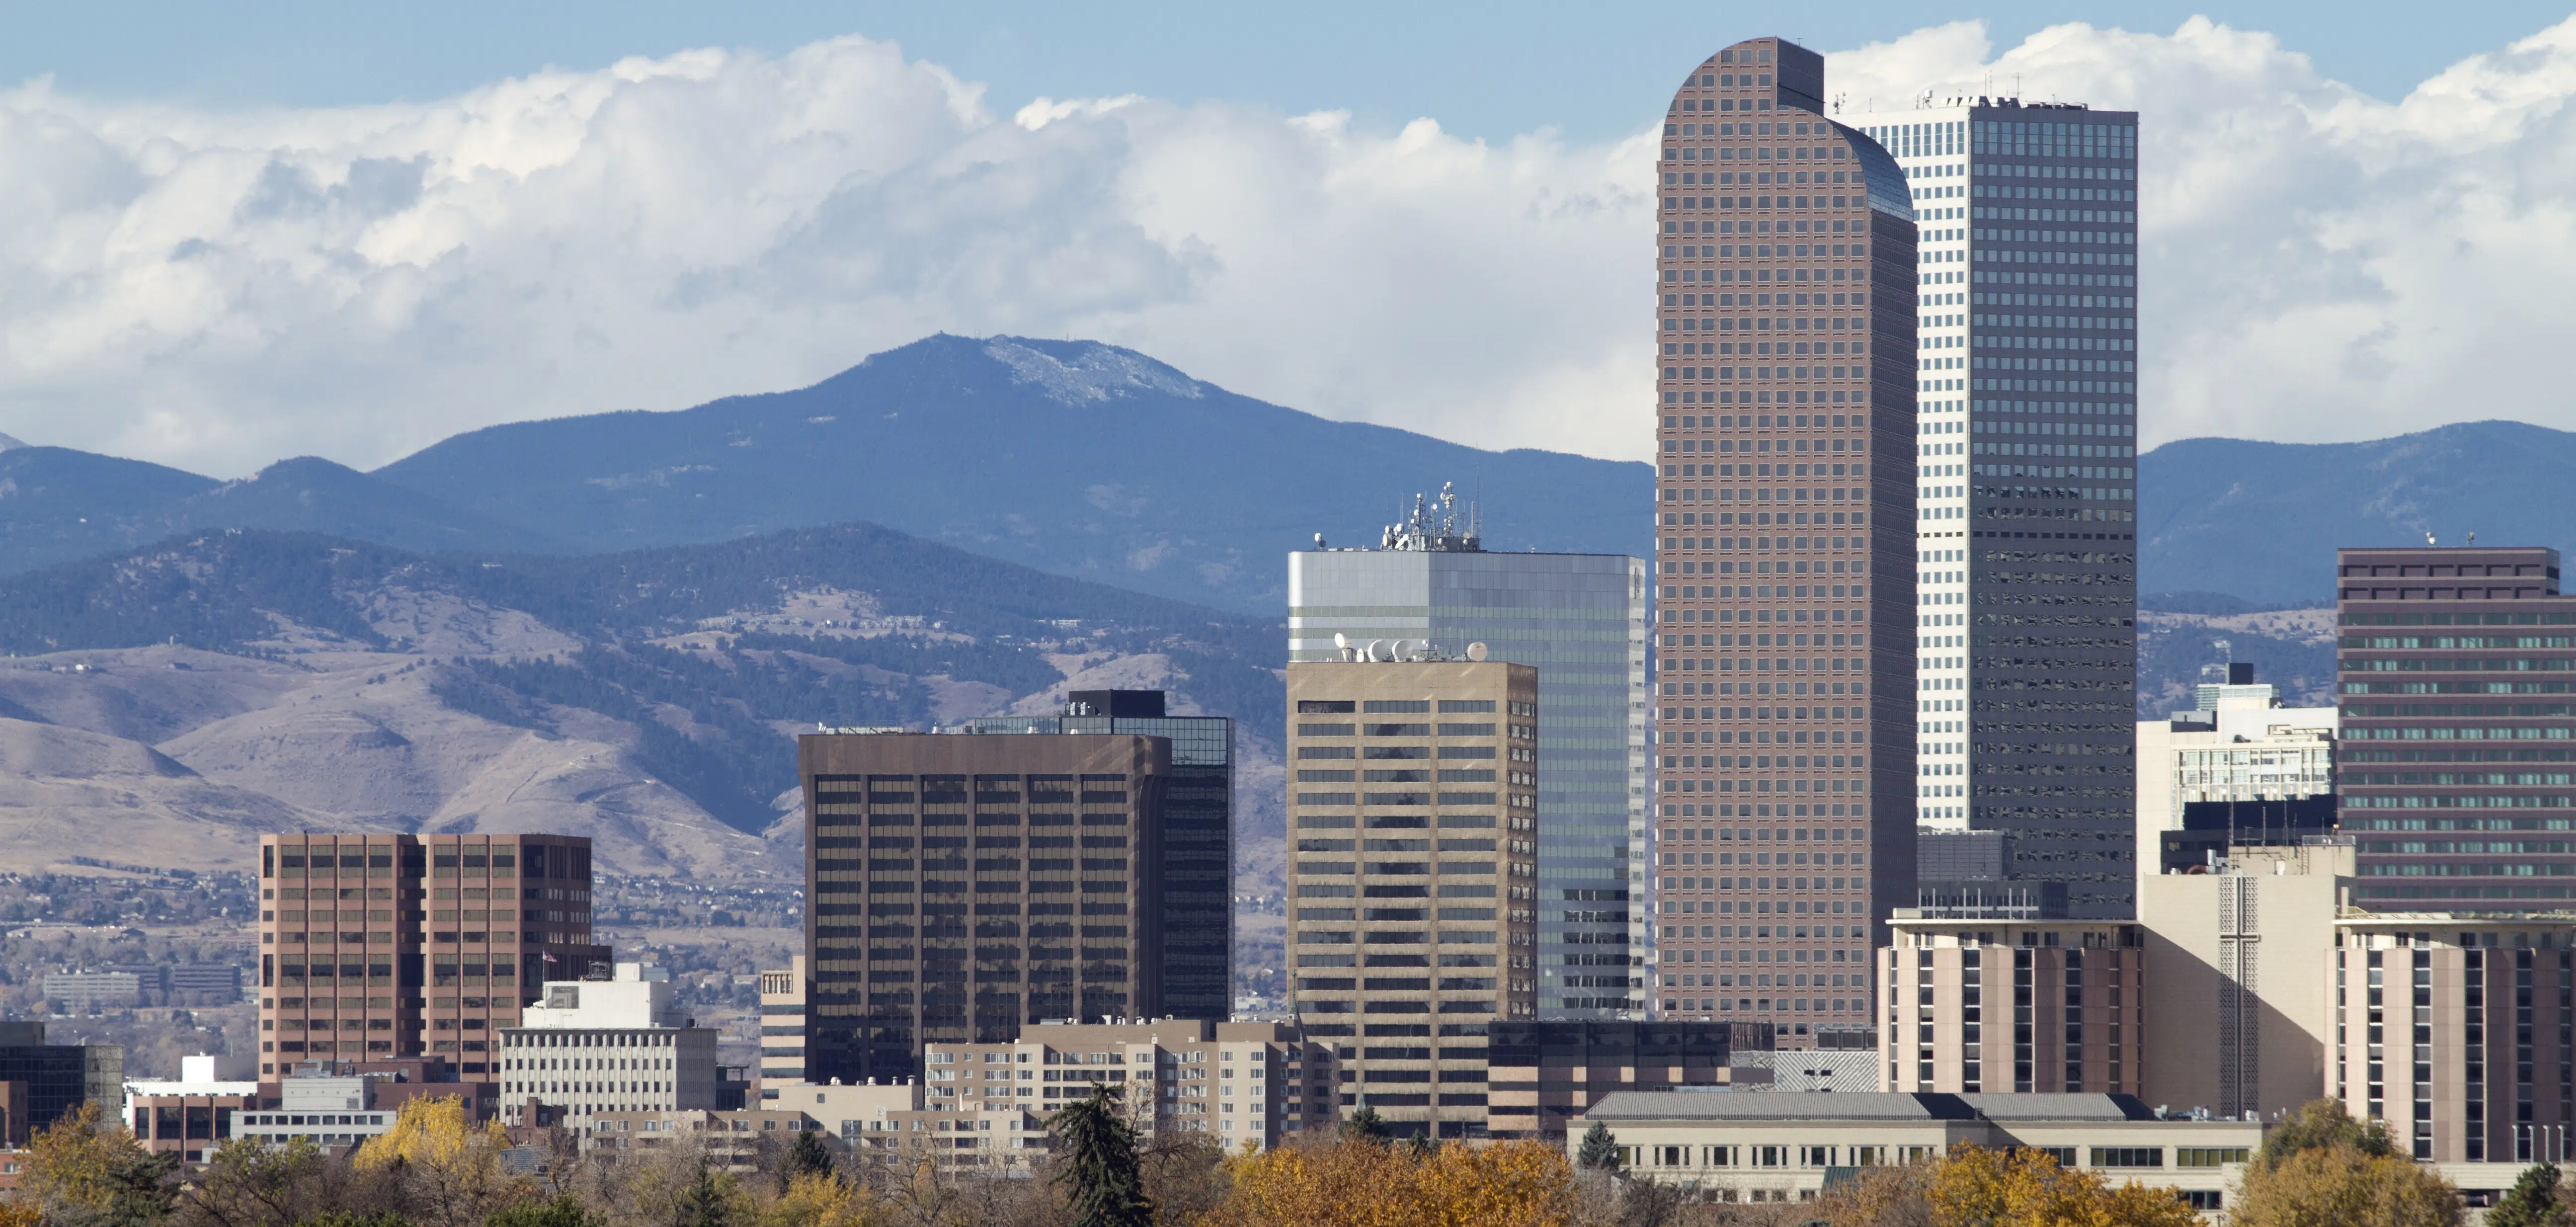

The Open Streets Project has taken hold in numerous cities during stay-at-home orders, with New York City and Oakland closing downtown streets to vehicles. Those cities are already at #1 and #2 on our Climate Impact Index, but Denver — which has also closed numerous streets — has room for improvement.
Limiting vehicle travel in congested cities lowers not only VMT, but improves safety by minimizing potential contact between cars, pedestrians, and cyclists. And it can increase transit use when commuters don’t have the option to drive into the city. If Denver can keep enough streets closed (of course combined with other measures such as broader telework policies, more widespread of active transit and more) to reduce VMT by 10%, that would boost the mile-high city to 35 on our Climate Impact Index.
JOIN OUR DENVER WEBINAR for metrics to help analyze options for closings streets to cars >
Seattle: Working From Home


Seattle has a reputation as an environmentally conscious city, but it was in the bottom third of our Climate Impact Index ranking. With just a 10% decrease in VMT, Seattle has the potential to shift from the bottom third to the top third.
During shelter-at-home orders, many companies (including StreetLight) shifted quickly and smoothly in March to a work-from-home business model. Seattle could incentivize its larger employers, including Amazon, Microsoft, Starbucks, and T-Mobile, to extend work-at-home options. Home offices aren’t an option for all sectors of the economy, but high-tech businesses fit it well. And when those businesses are in cities with a high cost of living, where workers tend to live in the more affordable outskirts, limiting commuting can heavily reduce VMT.
JOIN OUR SEATTLE WEBINAR for how to analyze emissions impact of work-from-home policy >
Atlanta: Supporting Bikes and Transit

With 22 miles of multi-use urban trails, Atlanta’s BeltLine is a model for prioritizing car-free travel amid legendary congestion and sprawl. Many elements of the project remain in progress, but if Atlanta can tighten it up, the BeltLine could help pull this metro area higher in the rankings.
The multi-pronged BeltLine project connects affordable housing and commercial areas via cycling, walking, and light rail transit. The trails encircle Atlanta’s busiest urban areas, with a plan for six streetcar routes to criss-cross it.
JOIN OUR ATLANTA WEBINAR for metrics used to boost bike, pet and transit travel >
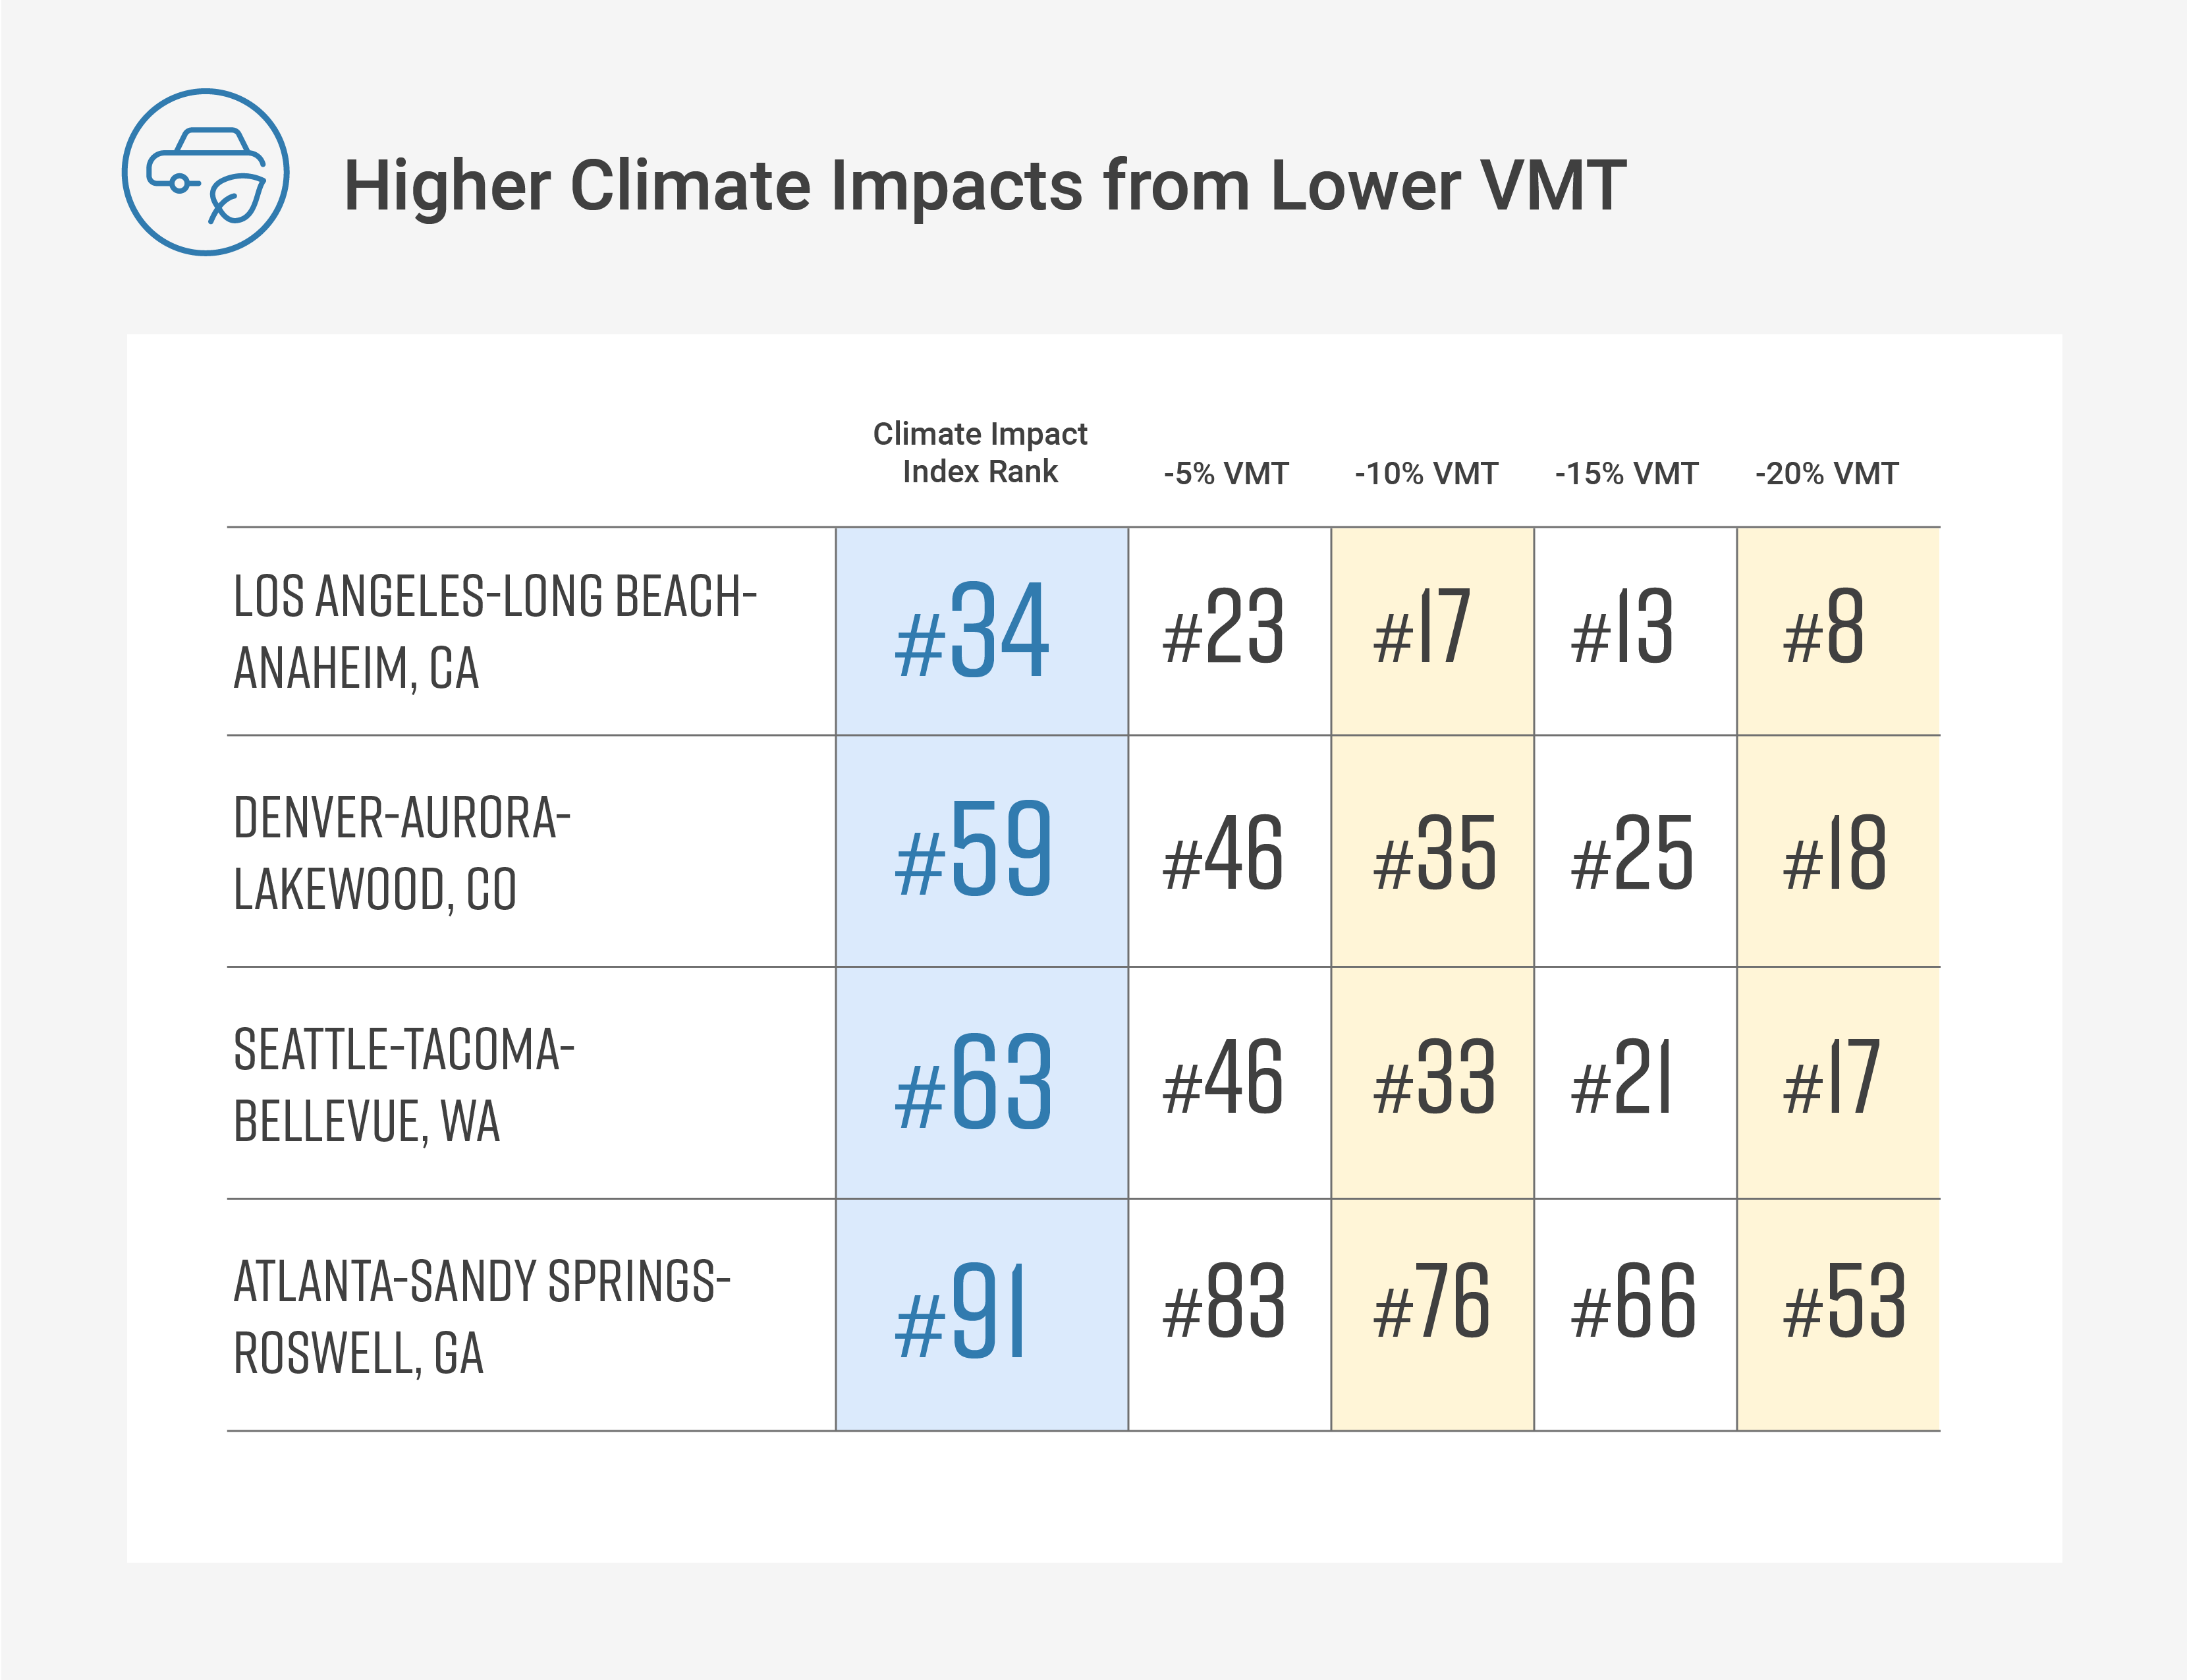
We analyzed each of these cities and noted how even a 5% VMT reduction would make a big improvement in their transportation emissions ratings. And with robust plans for closed roads, less commuting, more transit and bicycling, some cities are poised to maintain even greater decreases in VMT while rebuilding their economy.
Check our map to adjust VMT levels for your locality to see what’s possible.