
Vehicle Miles Traveled (VMT) data for U.S. cities and counties
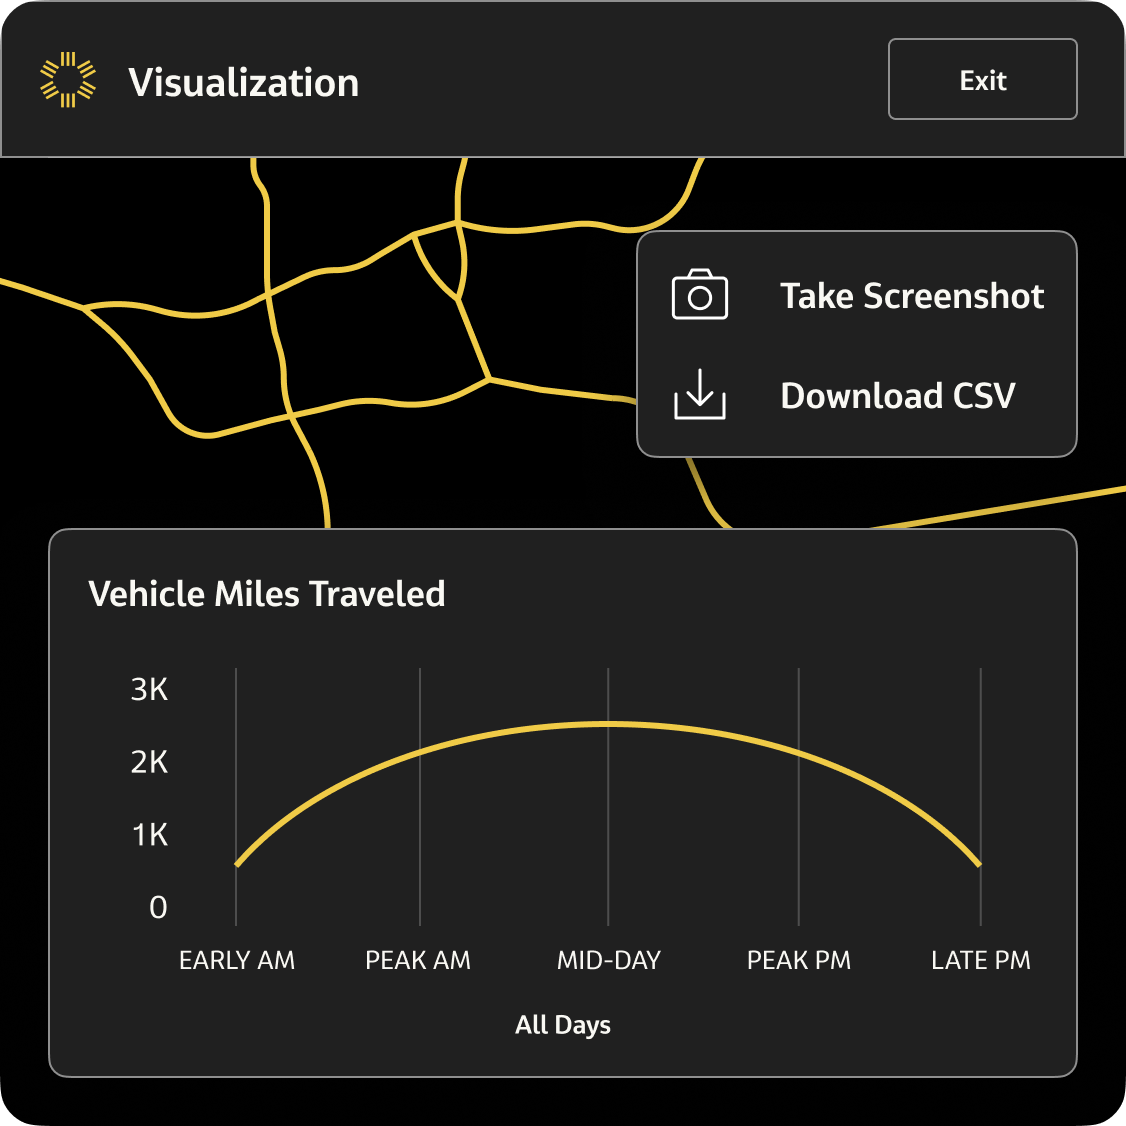
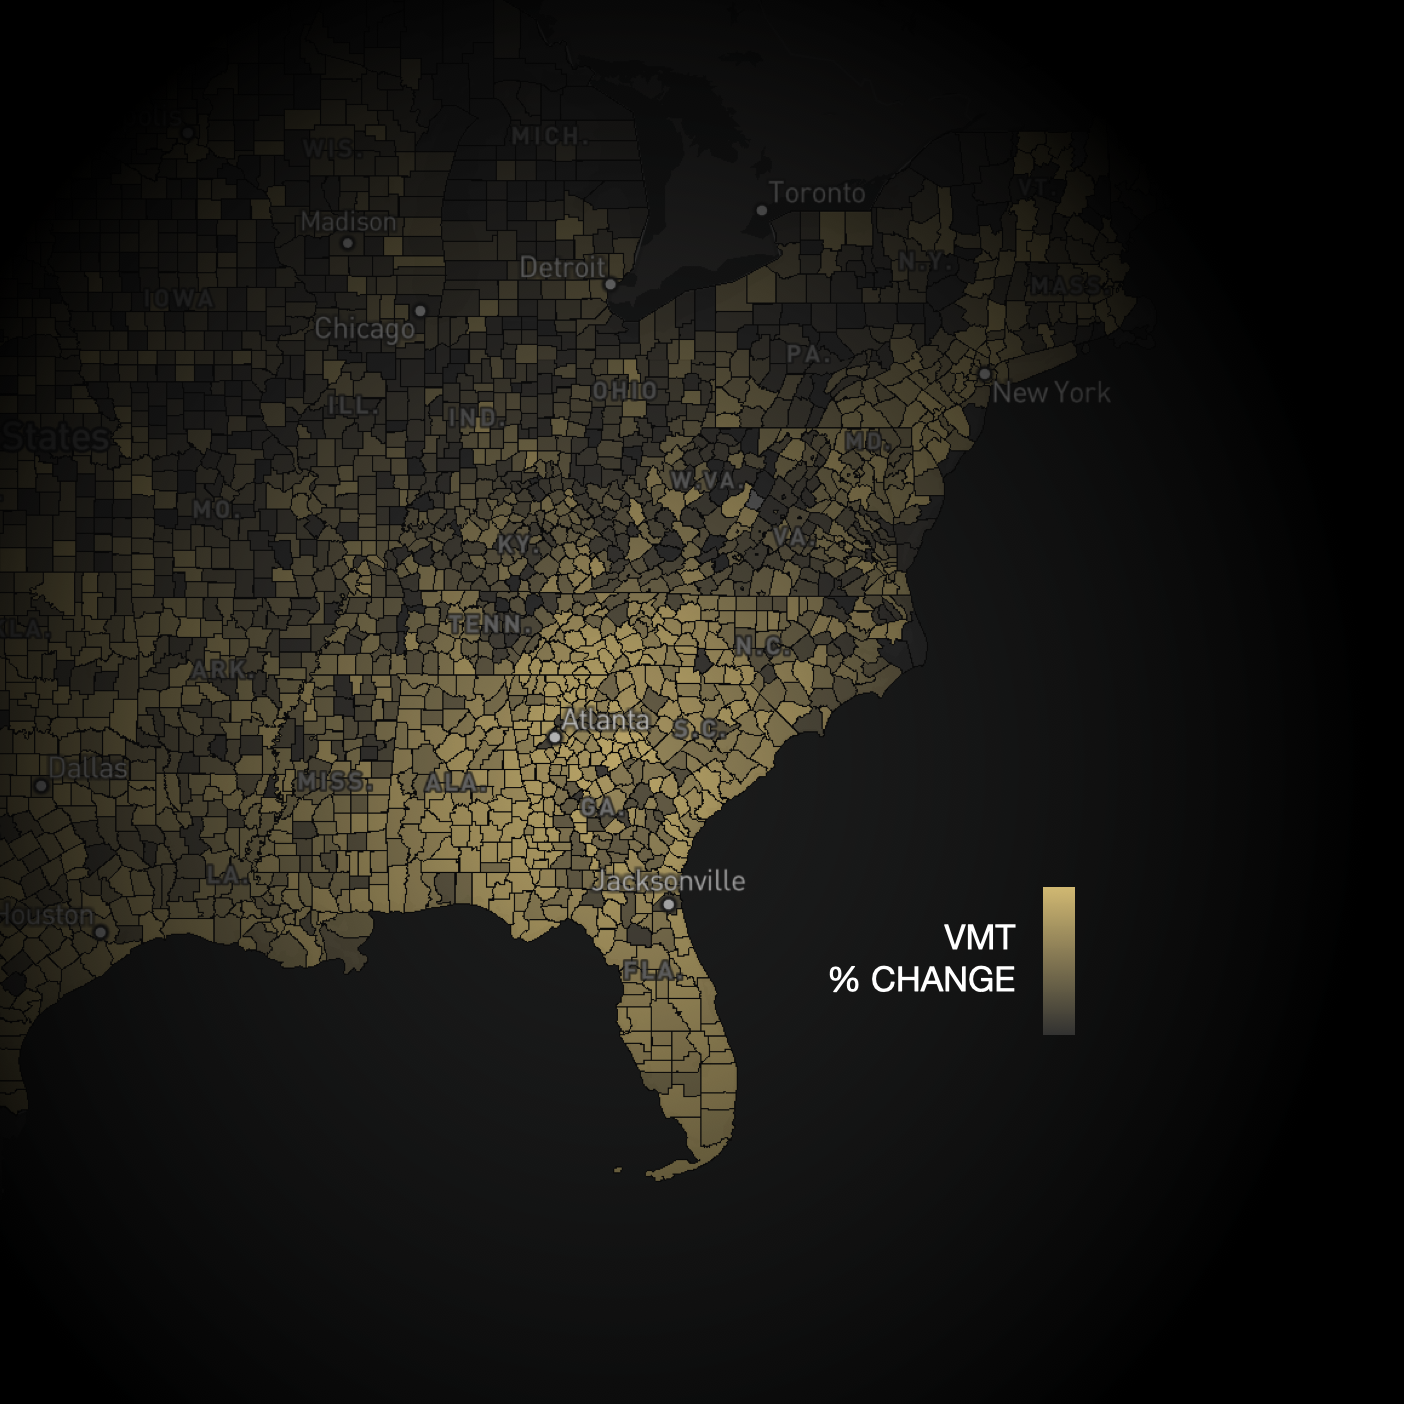
Volatility of vehicle travel has increased since the pandemic. How are changes in vehicle miles traveled (VMT) affecting your planning? Get the facts to inform your estimations for gas tax shortfalls, pollution changes, and more. Our VMT metrics for states, counties, cities or roadways are available nationwide.


StreetLight VMT at a glance
Our VMT metrics are used by transportation agencies and their partners at the local, state, and federal level for improving congestion and reducing vehicle traffic on behalf of safety, equity, public health, climate, or economic goals.


Travel demand forecasts, congestion planning, regional and corridor traffic studies, traffic mitigation, analysis of greenhouse gas emissions, gas taxes, and more.

Get VMT on any road statewide, countywide, or citywide with StreetLight’sVMT metrics.

Use VMT metrics from StreetLight to comply with California's SB 743
Watch webinarCalifornia has shifted from vehicle Level of Service (LOS) to Vehicle Miles Traveled (VMT) for transportation impact analyses under the California Environmental Quality Act (CEQA). Granular up-to-date data is optimal, rather than relying on modeled data.
StreetLight’s VMT metrics are an easy and affordable way to get VMT data anywhere in the state to satisfy SB 743. Watch this webinar to learn about StreetLight’s methodology behind the VMT metrics, Fehr & Peers’ independent validation study of the metrics, and real-life examples from Sacramento, using big-data VMT in SB 743 implementation.
This webinar features Ron Milam, Director of Technology at Fehr & Peers, and Laura Schewel, CEO of StreetLight.

Access VMT through a self-serve product or custom delivery
Corridor Studies
Access VMT and other mobility data on-demand, to evaluate corridor conditions, anticipate future usage, and communicate investments to stakeholders.
Solve bottlenecks with quick access to VMT and other multi-year traffic insights for all of your roads in one easy-to-use, self-serve platform.
Let our data science team do the work. Get VMT for any road or region, across time, enriched with other metrics your project may require.
Do you need data to inform your next project?
Talk to StreetLight about your needs, and join us in shaping a more efficient, sustainable world.
Here are some resources to help you go a step further: