
Where Did People Relocate During 2020’s Pandemic?

As we mark one whole year of living through the COVID pandemic, much has changed in our daily lives. There is significant interest in understanding changes to many of our regular behaviors, including how we work, learn, and shop. What will become permanent, and what will “return to normal”?
For example, much has been made about an “urban exodus” during the pandemic – people leaving cities for the more relaxed countryside. But is this true? If so, what does it mean for transportation?
At StreetLight Data, we use our transportation Metrics to answer questions like this every day. So I dug into our data repository to build a custom study for analyzing where people relocated during the pandemic’s peak.
Taking Transportation Data to the Next Level
Using StreetLight InSight®, our customers have the ability to determine whether trips to and from a particular geography are made by inferred “residents,” “workers,” or “visitors.” This data is available via a Home-Work Location add-on to a Zone Activity analysis.
Having said that, an in-depth relocation analysis like this isn’t programmed into our platform as a “ready” study that customers can do. But as a senior data engineer, I help customers with special projects every day. I know that our extensive database can reveal all kinds of insights if it’s queried in the right way.
This custom project was a unique opportunity for me to explore some of the outer reaches of what our transportation analytics platform can do.
Which Origin-Destination Pairs Showed the Biggest Change in 2020
First I wanted to understand where people relocated during the spring of 2020. I analyzed home location data for the top 10 most-populated metropolitan statistical areas (MSAs) to see where people moved when they left their original MSA.
The list below shows the Top 25 movement patterns in the spring of 2020 for people who lived in one of the 10 largest MSAs in the U.S. Note that this list shows the city pairs that took in a larger proportion of movers compared to 2019. It also excludes any intra-MSA movements. The Census Current Population Survey estimates that approximately 60% of all moves in a given year are within the same county.
For example, the most moves were from Los Angeles to San Bernardino during the pandemic. But Los Angeles residents are pretty continually moving to San Bernardino (it was the top relocation pair for 2019 as well). This list shows pairs that changed the most from 2019.
The top relocation pair of Miami to Orlando had the largest increase in move volume from 2019 to 2020. City O-D Pairs with Largest Increase in Relocations in 2020 compared to 2019*
- Miami-Fort Lauderdale-Pompano Beach, FL to Orlando-Kissimmee-Sanford, FL
- Phoenix-Mesa-Glendale, AZ to Chicago-Joliet-Naperville, IL-IN-WI
- New York-Northern New Jersey-Long Island, NY-NJ-PA to Miami-Fort Lauderdale-Pompano Beach, FL
- New York-Northern New Jersey-Long Island, NY-NJ-PA to East Stroudsburg, PA
- Los Angeles-Long Beach-Santa Ana, CA to Phoenix-Mesa-Glendale, AZ
- New York-Northern New Jersey-Long Island, NY-NJ-PA to Bridgeport-Stamford-Norwalk, CT
- New York-Northern New Jersey-Long Island, NY-NJ-PA to Poughkeepsie-Newburgh-Middletown, NY
- New York-Northern New Jersey-Long Island, NY-NJ-PA to Atlanta-Sandy Springs-Marietta, GA
- Miami-Fort Lauderdale-Pompano Beach, FL to Cape Coral-Fort Myers, FL
- Los Angeles-Long Beach-Santa Ana, CA to Bakersfield-Delano, CA
- New York-Northern New Jersey-Long Island, NY-NJ-PA to Dallas-Fort Worth-Arlington, TX
- Dallas-Fort Worth-Arlington, TX to San Antonio-New Braunfels, TX
- Atlanta-Sandy Springs-Marietta, GA to Jacksonville, FL
- Atlanta-Sandy Springs-Marietta, GA to Gainesville, GA
- New York-Northern New Jersey-Long Island, NY-NJ-PA to New Haven-Milford, CT
- Houston-Sugar Land-Baytown, TX to Huntsville, TX
- New York-Northern New Jersey-Long Island, NY-NJ-PA to Pittsburgh, PA
- Washington-Arlington-Alexandria, DC-VA-MD-WV to Hagerstown-Martinsburg, MD-WV
- New York-Northern New Jersey-Long Island, NY-NJ-PA to Boston-Cambridge-Quincy, MA-NH
- Philadelphia-Camden-Wilmington, PA-NJ-DE-MD to Ocean City, NJ
- Washington-Arlington-Alexandria, DC-VA-MD-WV to Miami-Fort Lauderdale-Pompano Beach, FL
- Los Angeles-Long Beach-Santa Ana, CA to Miami-Fort Lauderdale-Pompano Beach, FL
- Washington-Arlington-Alexandria, DC-VA-MD-WV to Tampa-St. Petersburg-Clearwater, FL
- Atlanta-Sandy Springs-Marietta, GA to Tampa-St. Petersburg-Clearwater, FL
- Miami-Fort Lauderdale-Pompano Beach, FL to Atlanta-Sandy Springs-Marietta, GA
*MSA ranked by highest increase in relocations in 2020 as compared to 2019
Density Loses Ground
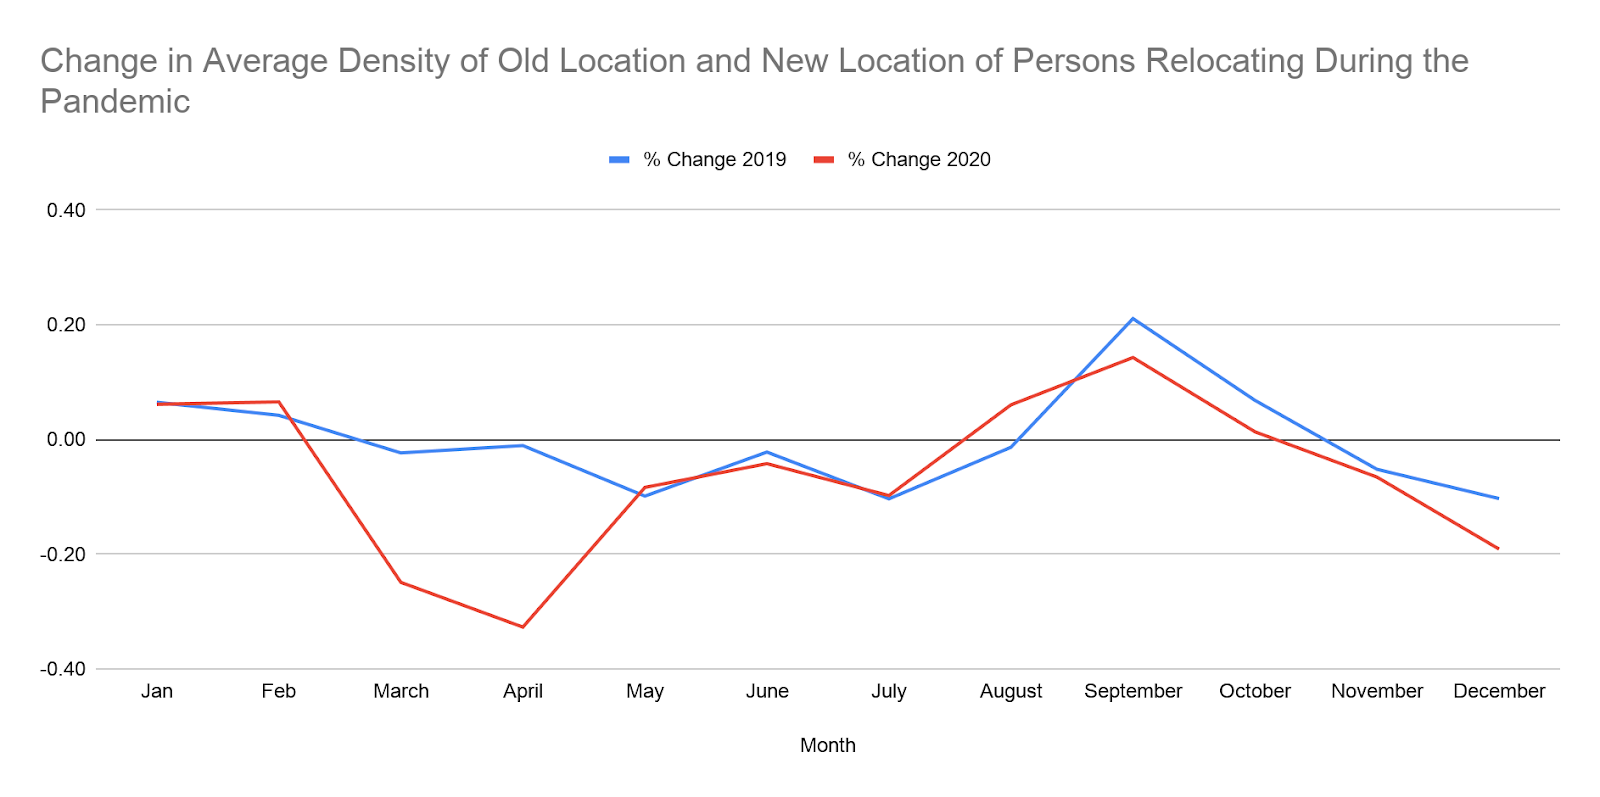
Digging into an analysis of Census Block Groups showed me that, on average, when people moved from a given home area in March or April of 2020, they were much more likely than their 2019 counterparts to move to a less-dense area. Specifically, people who relocated during March and April of 2020 moved to areas that were from 22% to 33% less dense than their former residence. This is a stark contrast to the areas people moved to in March and April of 2019, which were just 1% and 2% less dense, respectively.
This finding is interesting because of the role population density plays in transportation’s impact on greenhouse gas emissions. Generally, the denser a city, the more efficiently its inhabitants can move around. People relocating to less-dense living areas can, for example, boost vehicle miles traveled in that area, and put more stress on the existing transportation network.
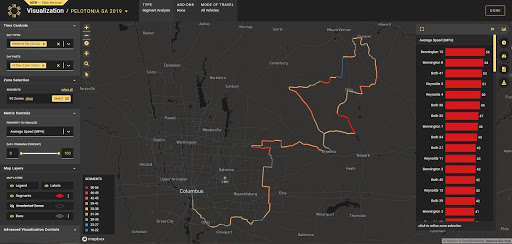
Figure 1: People relocating in 2020 were much more likely than those in 2019 to move to a less-dense area.
Moving Moves Back to Normal
The data both confirms and refutes those “urban exodus” reports. Yes, people did flee densely populated cities for less-dense ones early in the pandemic. That’s understandable when many of us were trying to avoid other humans, or expanding our yards for socially distanced outdoor entertaining.
But that trend ultimately didn’t continue or accelerate at that scale over time. Thus we expect the U.S. to see a modest increase in VMT due to less-dense localities, and are hopeful we will avoid a huge or accelerating spike in VMT when we return to “normal” due to many people moving to more sprawled areas. There are plenty of reasons VMT could spike, of course, we’re just less afraid of this particular reason now.
This is a relief! Of course, as our city pairs show, certain localities will see move-driven VMT increases or even decreases far afield from the national average.
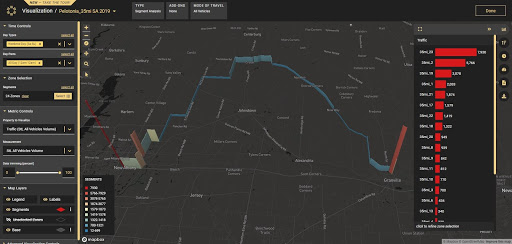
Figure 3: Vehicle volume on the “beginner” 35-mile Pelotonia route.
For beginners, there are two routes that Pelotonia recommends – the 25- and 35-mile routes. I studied these routes to learn more about what vehicle traffic the riders are likely to encounter.
The 25-mile option, although shorter, is the first 25 miles out of Columbus. It therefore shares the road with a higher volume of cars than other routes, but they are traveling at slower speeds.
On the other hand, the 35-miler is a completely different route. The ride utilizes lower-volume roads, and also takes place on a Sunday. A Segment Analysis on this route shows very low weekend traffic and speeds mostly in the 30s and 40s. Pelotonia also mentions that the 35-mile route has less climbing.
Overall, it looks like the 35-mile option may be the safer route for beginning riders uncomfortable with sharing roads with vehicles. Less time on the roads doesn’t always mean less risk for cyclists.