Transportation leaders have a historic opportunity to invest in infrastructure with BIL / IIJA / IRA funding. But first, you must win grants to support your region’s most pressing transportation needs. Quickly access multimodal and demographic data, insights, and visualizations to meet grant deadlines and win funding.
Which grant do you need data for?
Win and implement grant funding with empirical, data-driven insights
Refreshed data
Regularly updated metrics to monitor and measure changing conditions
Multimodal activity
Get bicycle, pedestrian, transit, car, and truck metrics in one place to support safety, climate, and active transportation
Demographic overlays
Aggregate attributes such as race, income, housing type, and disability status to prioritize equity in all grants
Access metrics for key themes in federal grant programs
Historic infrastructure, climate, and equity spending is at stake in recent federal bills, BIL / IIJA / IRA. Whether you’re focused on winning a grant, prioritizing spending allocations, or pursuing ongoing projects, our data can ensure you’re putting resources in places where it will serve the greatest need and earn public support.
Access metrics for key themes in federal grant programs
Historic infrastructure, climate, and equity spending is at stake in recent federal bills, BIL / IIJA / IRA. Whether you’re focused on winning a grant, prioritizing where funding should go, or pursuing ongoing projects focused on building stronger communities, our data can ensure you’re putting resources in places where it will serve the greatest need, return the biggest investment, and earn public support.
Which grant are you applying for?
SAFE STREETS AND ROADS FOR ALL (SS4A)
Make a case using regularly updated multimodal data that can set Safe Streets and Roads for All grant applications apart
Understand biking and walking activity; vehicle speed, volume, and intersection activity at different times of day; and which communities are likely to benefit from investment. Use data-driven insights to involve the community and achieve Vision Zero and Safe Streets goals.
REBUILDING AMERICAN INFRASTRUCTURE WITH SUSTAINABILITY AND EQUITY (RAISE)
Quantify environmental, safety, and equity benefits with on-demand transportation measurement
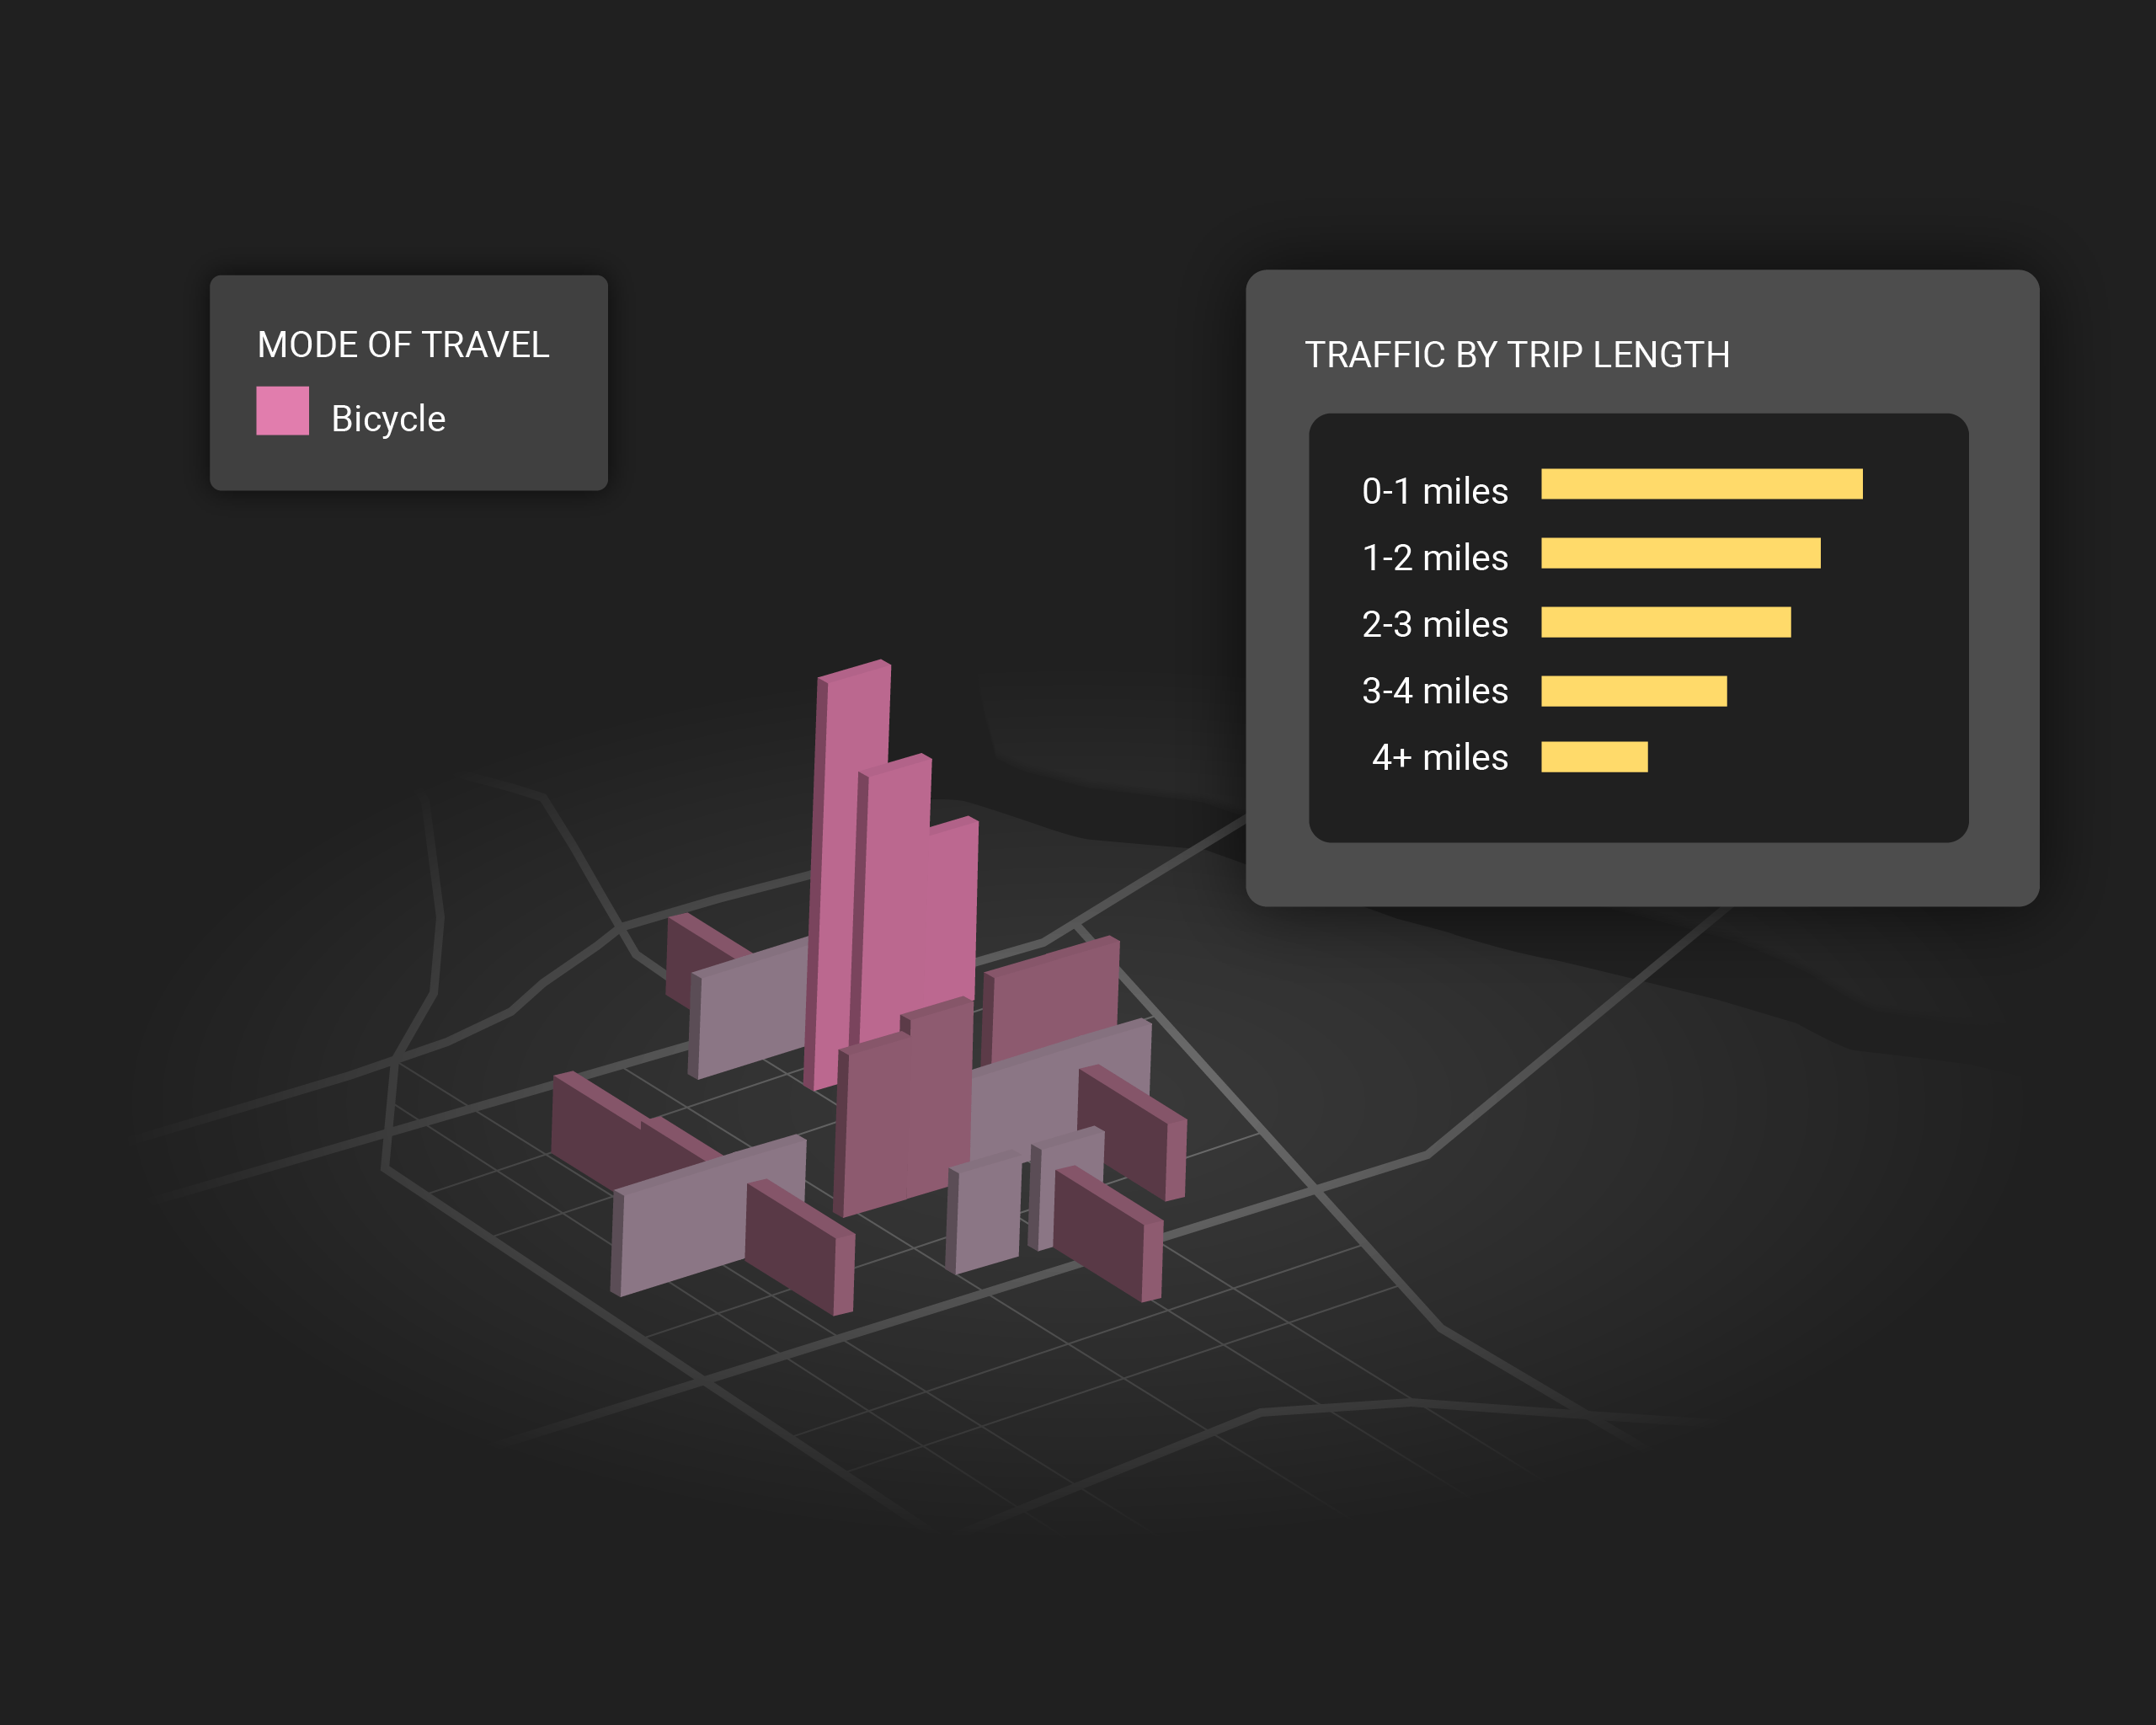
Past RAISE awardees have used a data-driven lens for their benefit-cost analysis to win their grant. Get volume and trip length across modes, as well as vehicle speed data and inferred demographics, to show award reviewers where a shift to transit, cycling, and walking infrastructure can reduce Vehicle Miles Traveled (VMT), improve air quality and safety, and benefit disadvantaged communities.

CLIMATE POLLUTION REDUCTION GRANT
Get mobility data to target pollution reductions at the leading emissions driver, transportation
Transportation is a leading source of pollution, with the worst impacts affecting disadvantaged communities. Access better data on emissions sources and demographics to develop an equity-focused mitigation strategy and monitor progress.

CARBON REDUCTION PROGRAM
Measure carbon emissions more precisely and identify mitigation strategies
Collect baseline emissions inventories with StreetLight metrics, including traffic counts and Vehicle Miles Traveled (VMT). Use validated Origin-Destination (O-D), speed, and truck travel metrics to further pinpoint GHG sources and enable mitigation. Scan your region to gather trip data and analyze routes to prioritize optimal locations for EV charging.

STRENGTHENING MOBILITY AND REVOLUTIONIZING TRANSPORTATION
Prove out your proposed solution with data-driven mobility insights
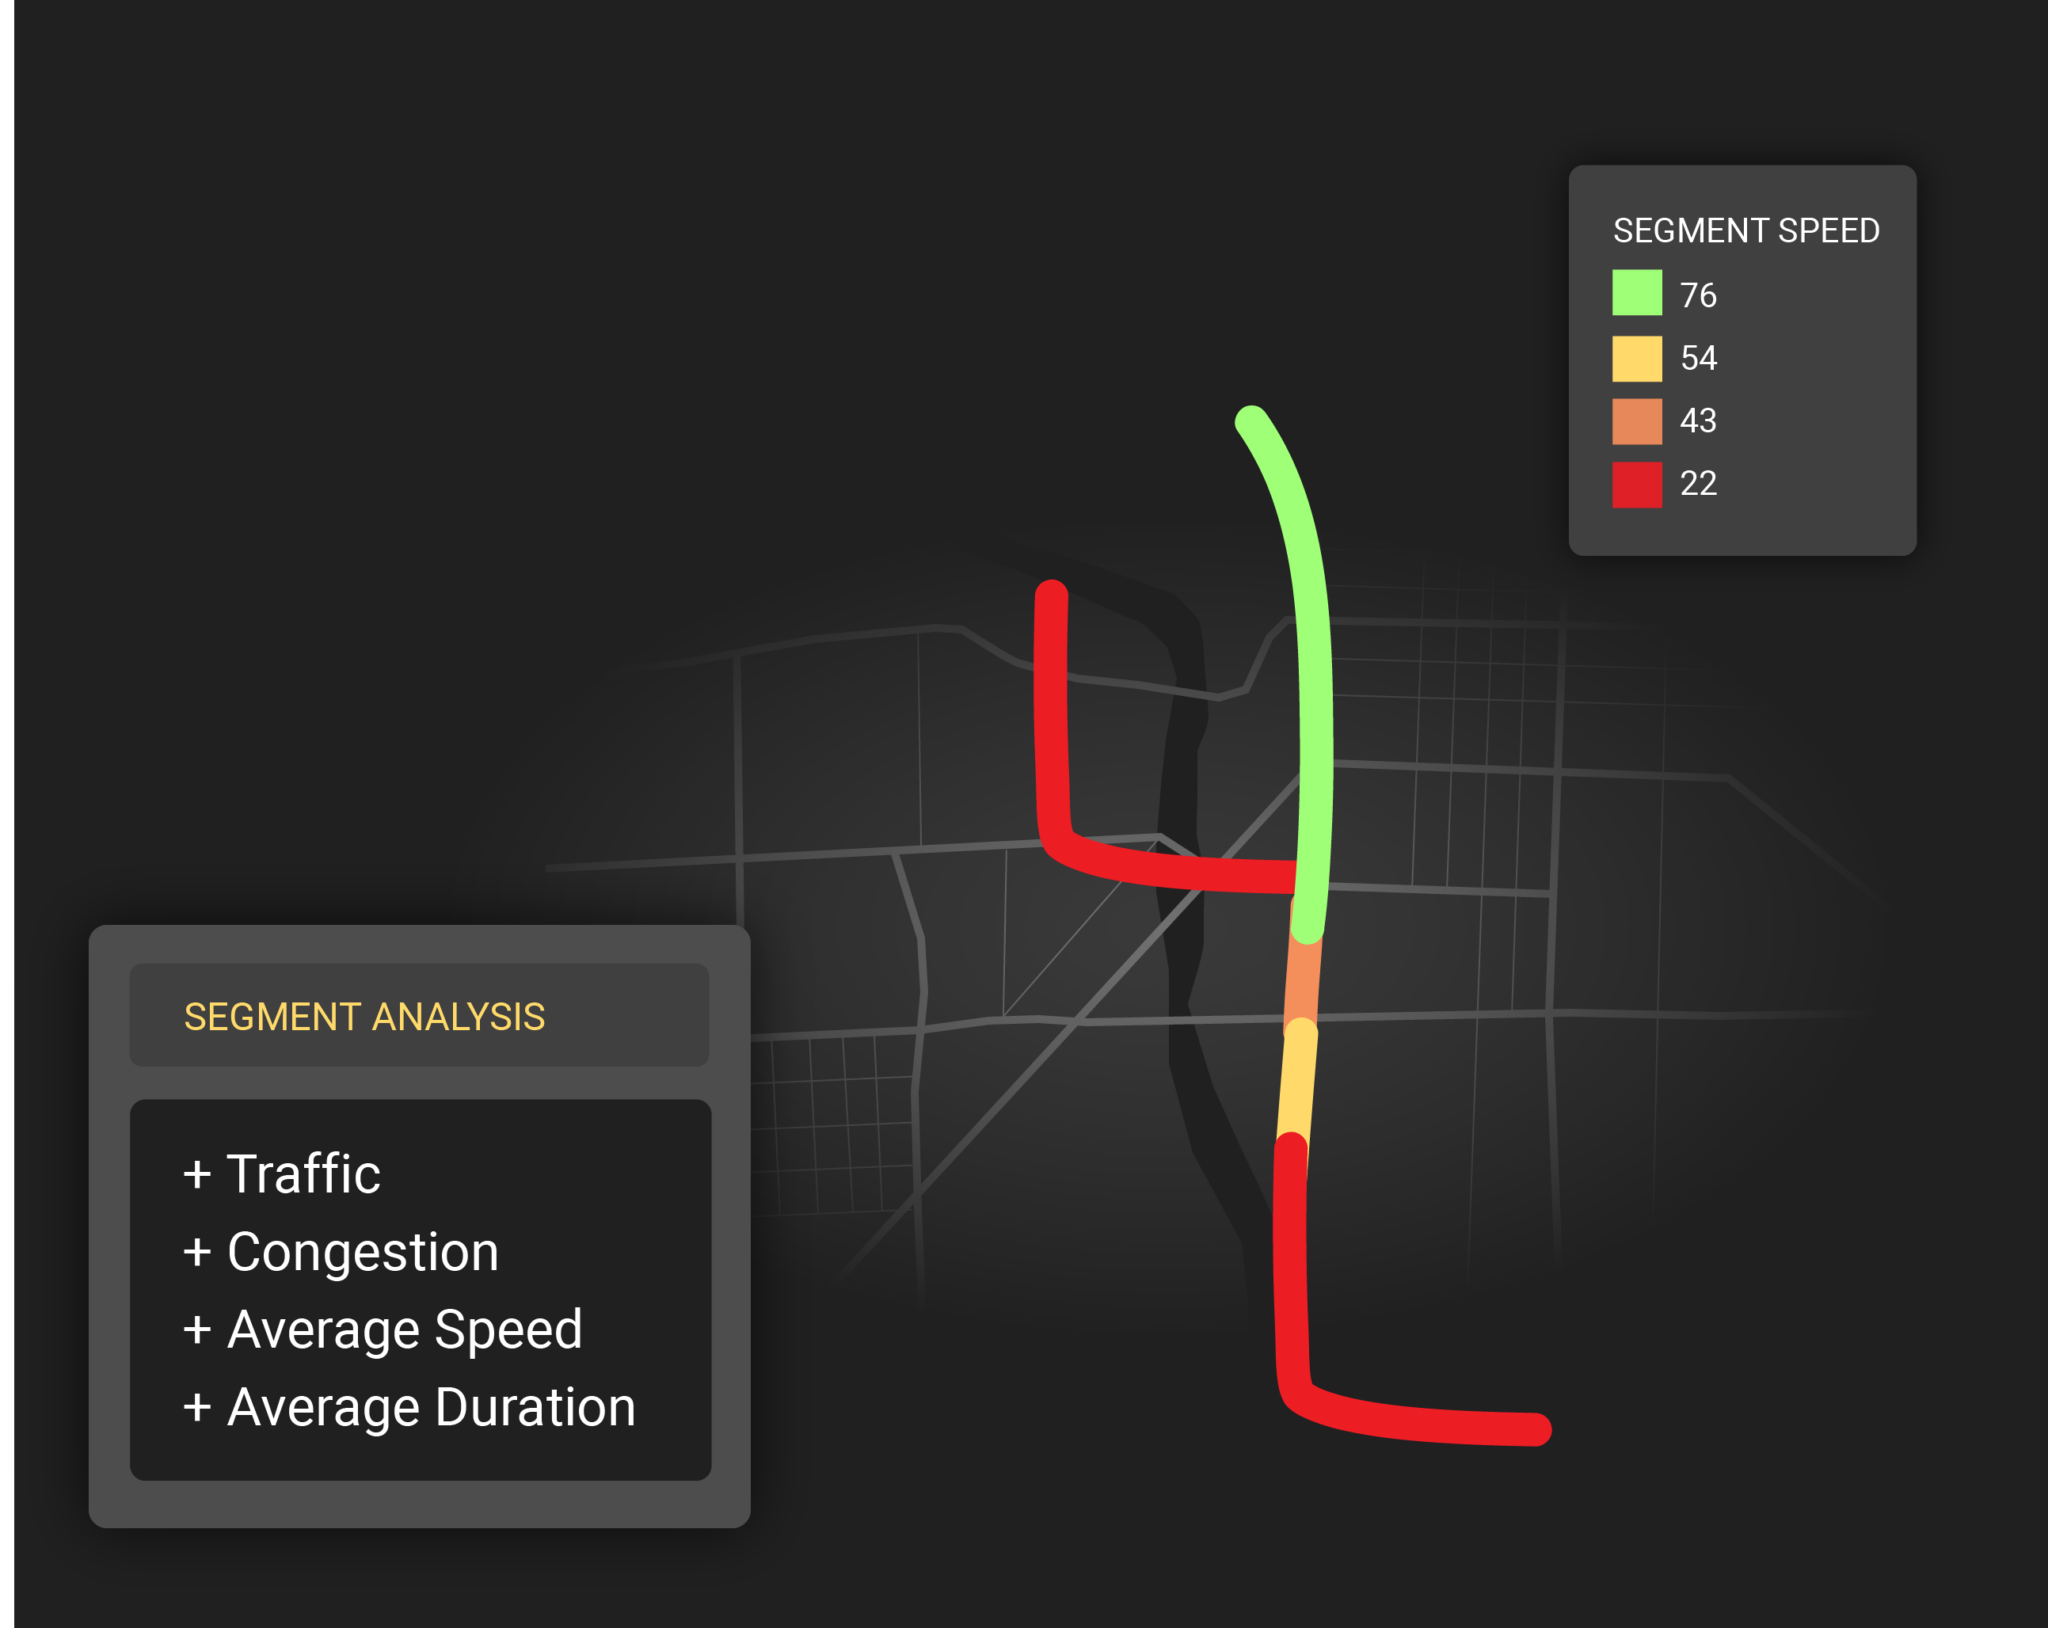
Access multimodal traffic patterns, combined with speed, congestion, and demographic Metrics to measure the performance of your proposed solution. Quantify the impact of your SMART grant project on transportation efficiency, equity, and safety to plan for future implementation.
RECONNECTING COMMUNITIES PILOT PROGRAM
Quantify the impact of transportation facilities on disadvantaged populations’ mobility and connectivity
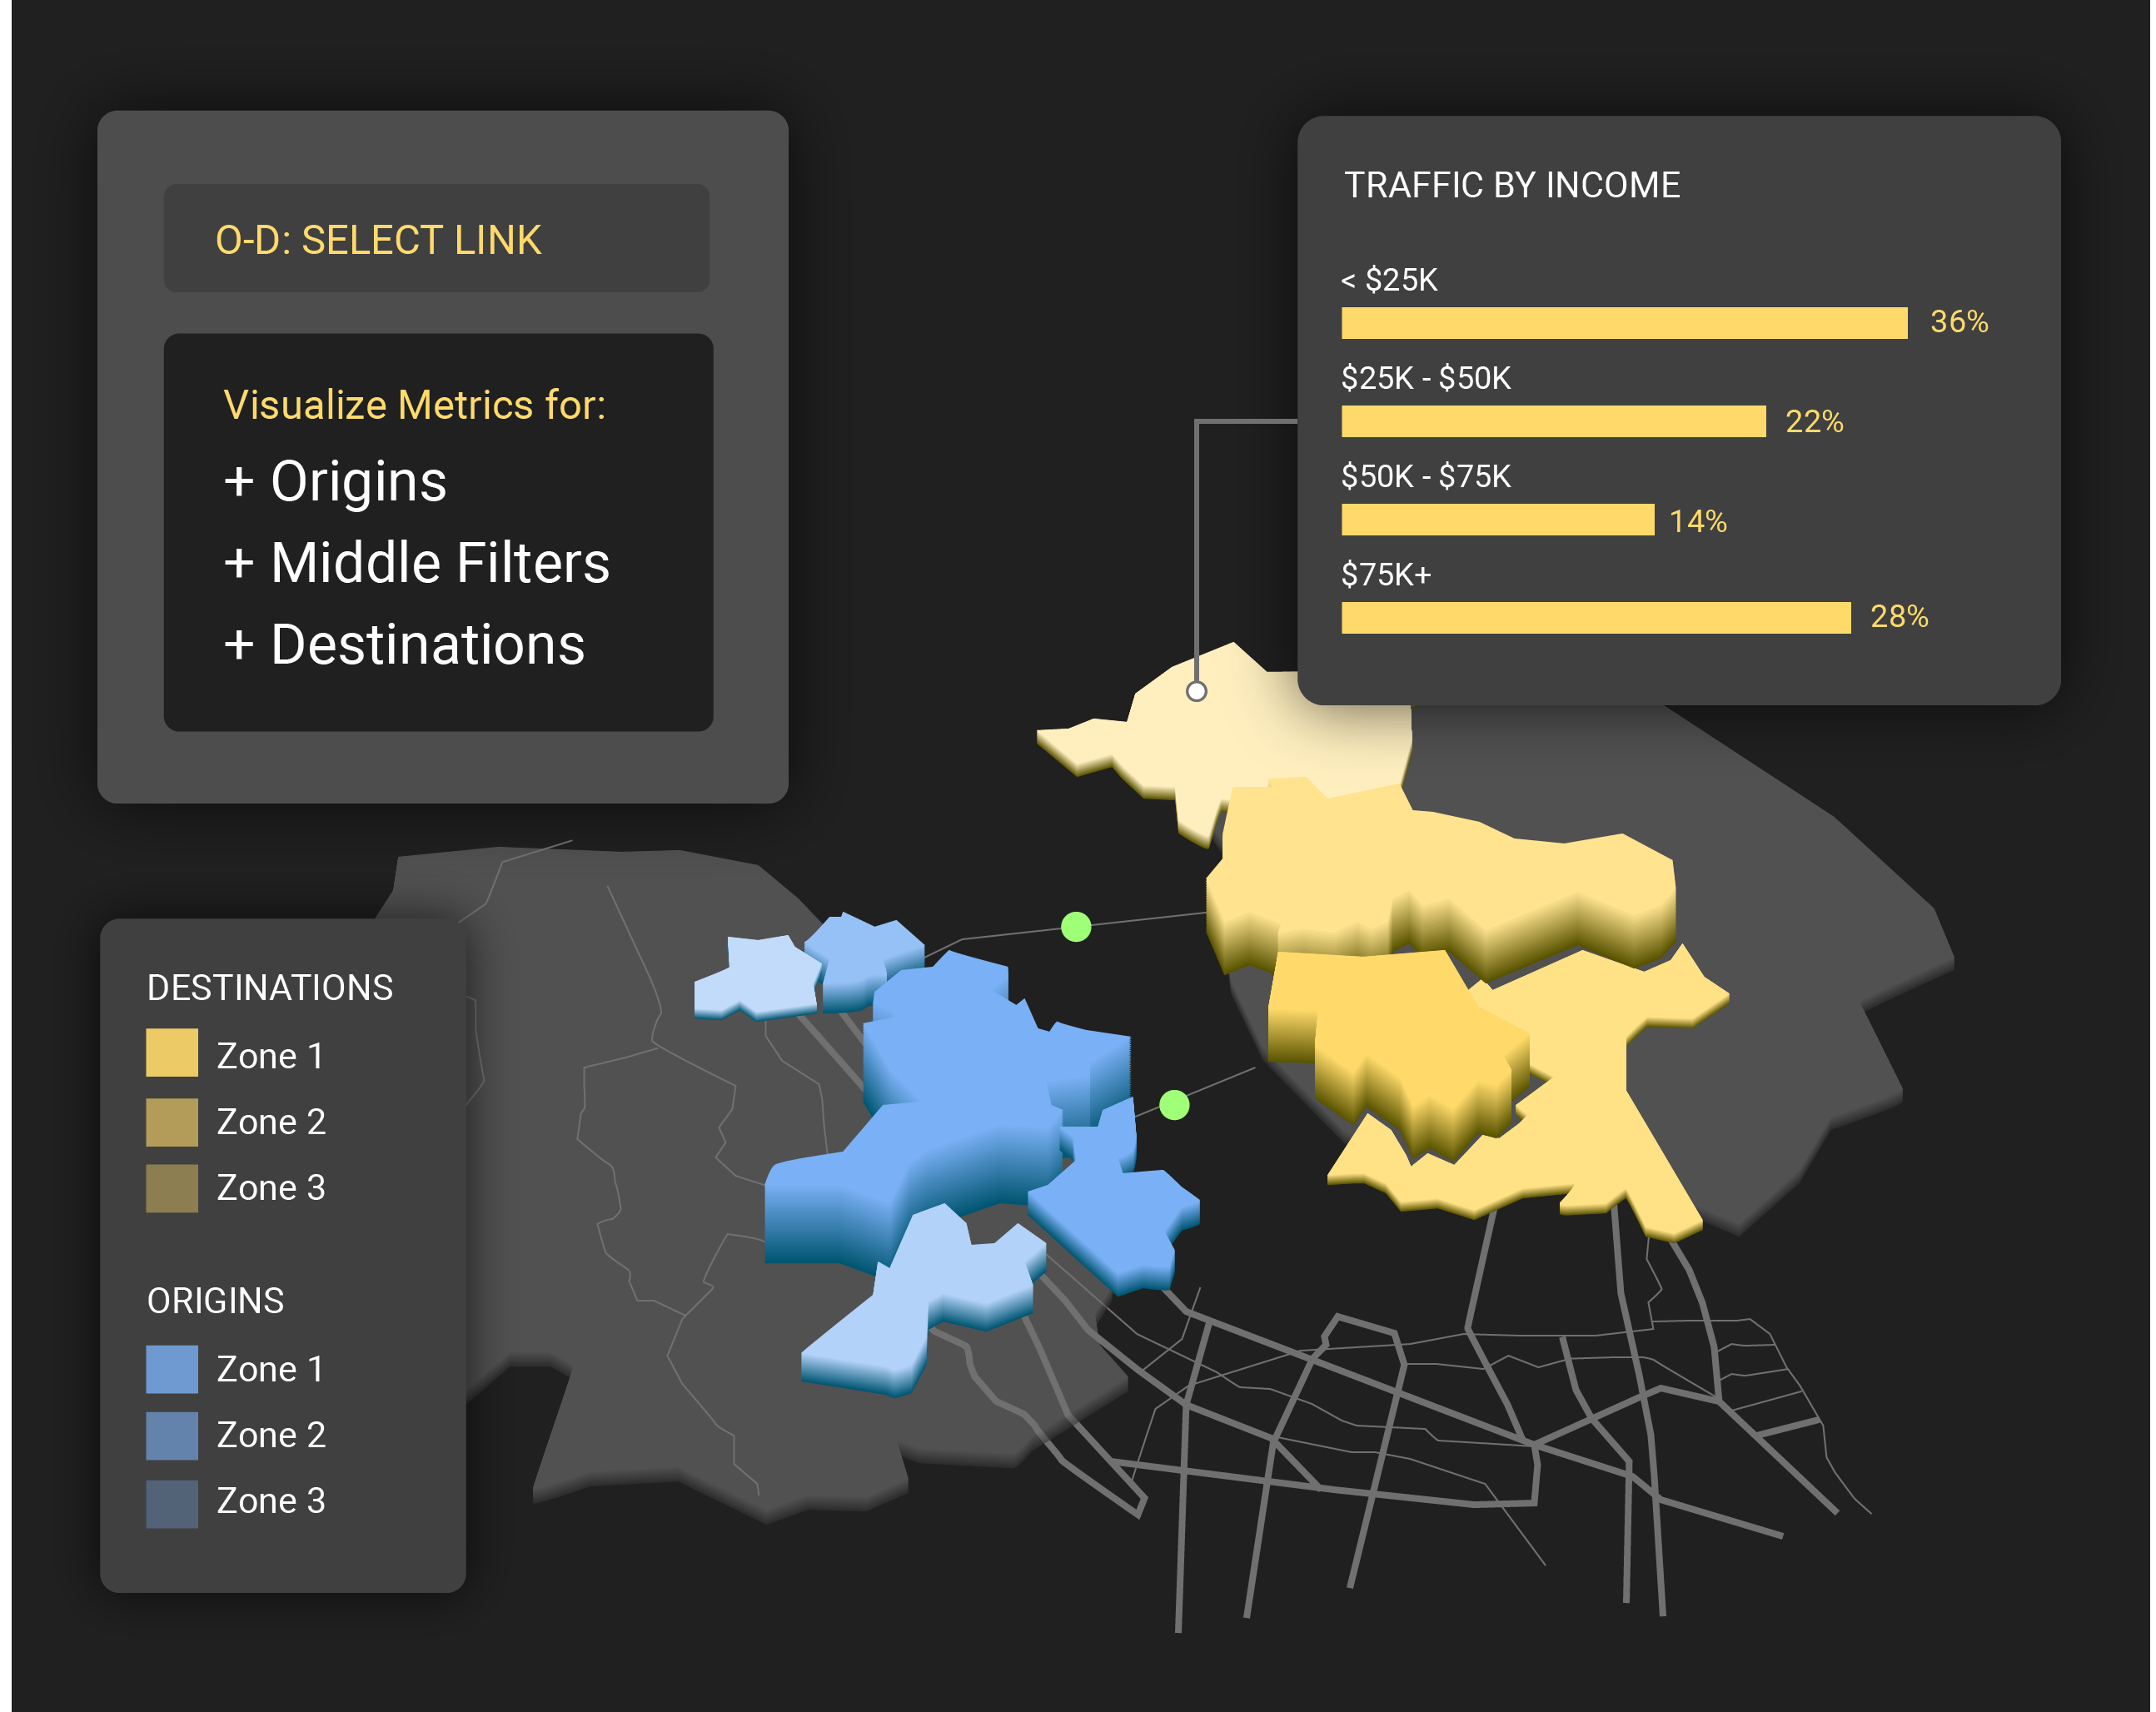
Use inferred demographics tied to travel patterns to prioritize infrastructure that connects disadvantaged communities to essential services and, thus, advances equity. Measure impact to create defensible grant applications and get stakeholder buy-in.
NATIONAL ELECTRIC VEHICLE INFRASTRUCTURE (NEVI)
Metrics for EV site selection to power NEVI grants
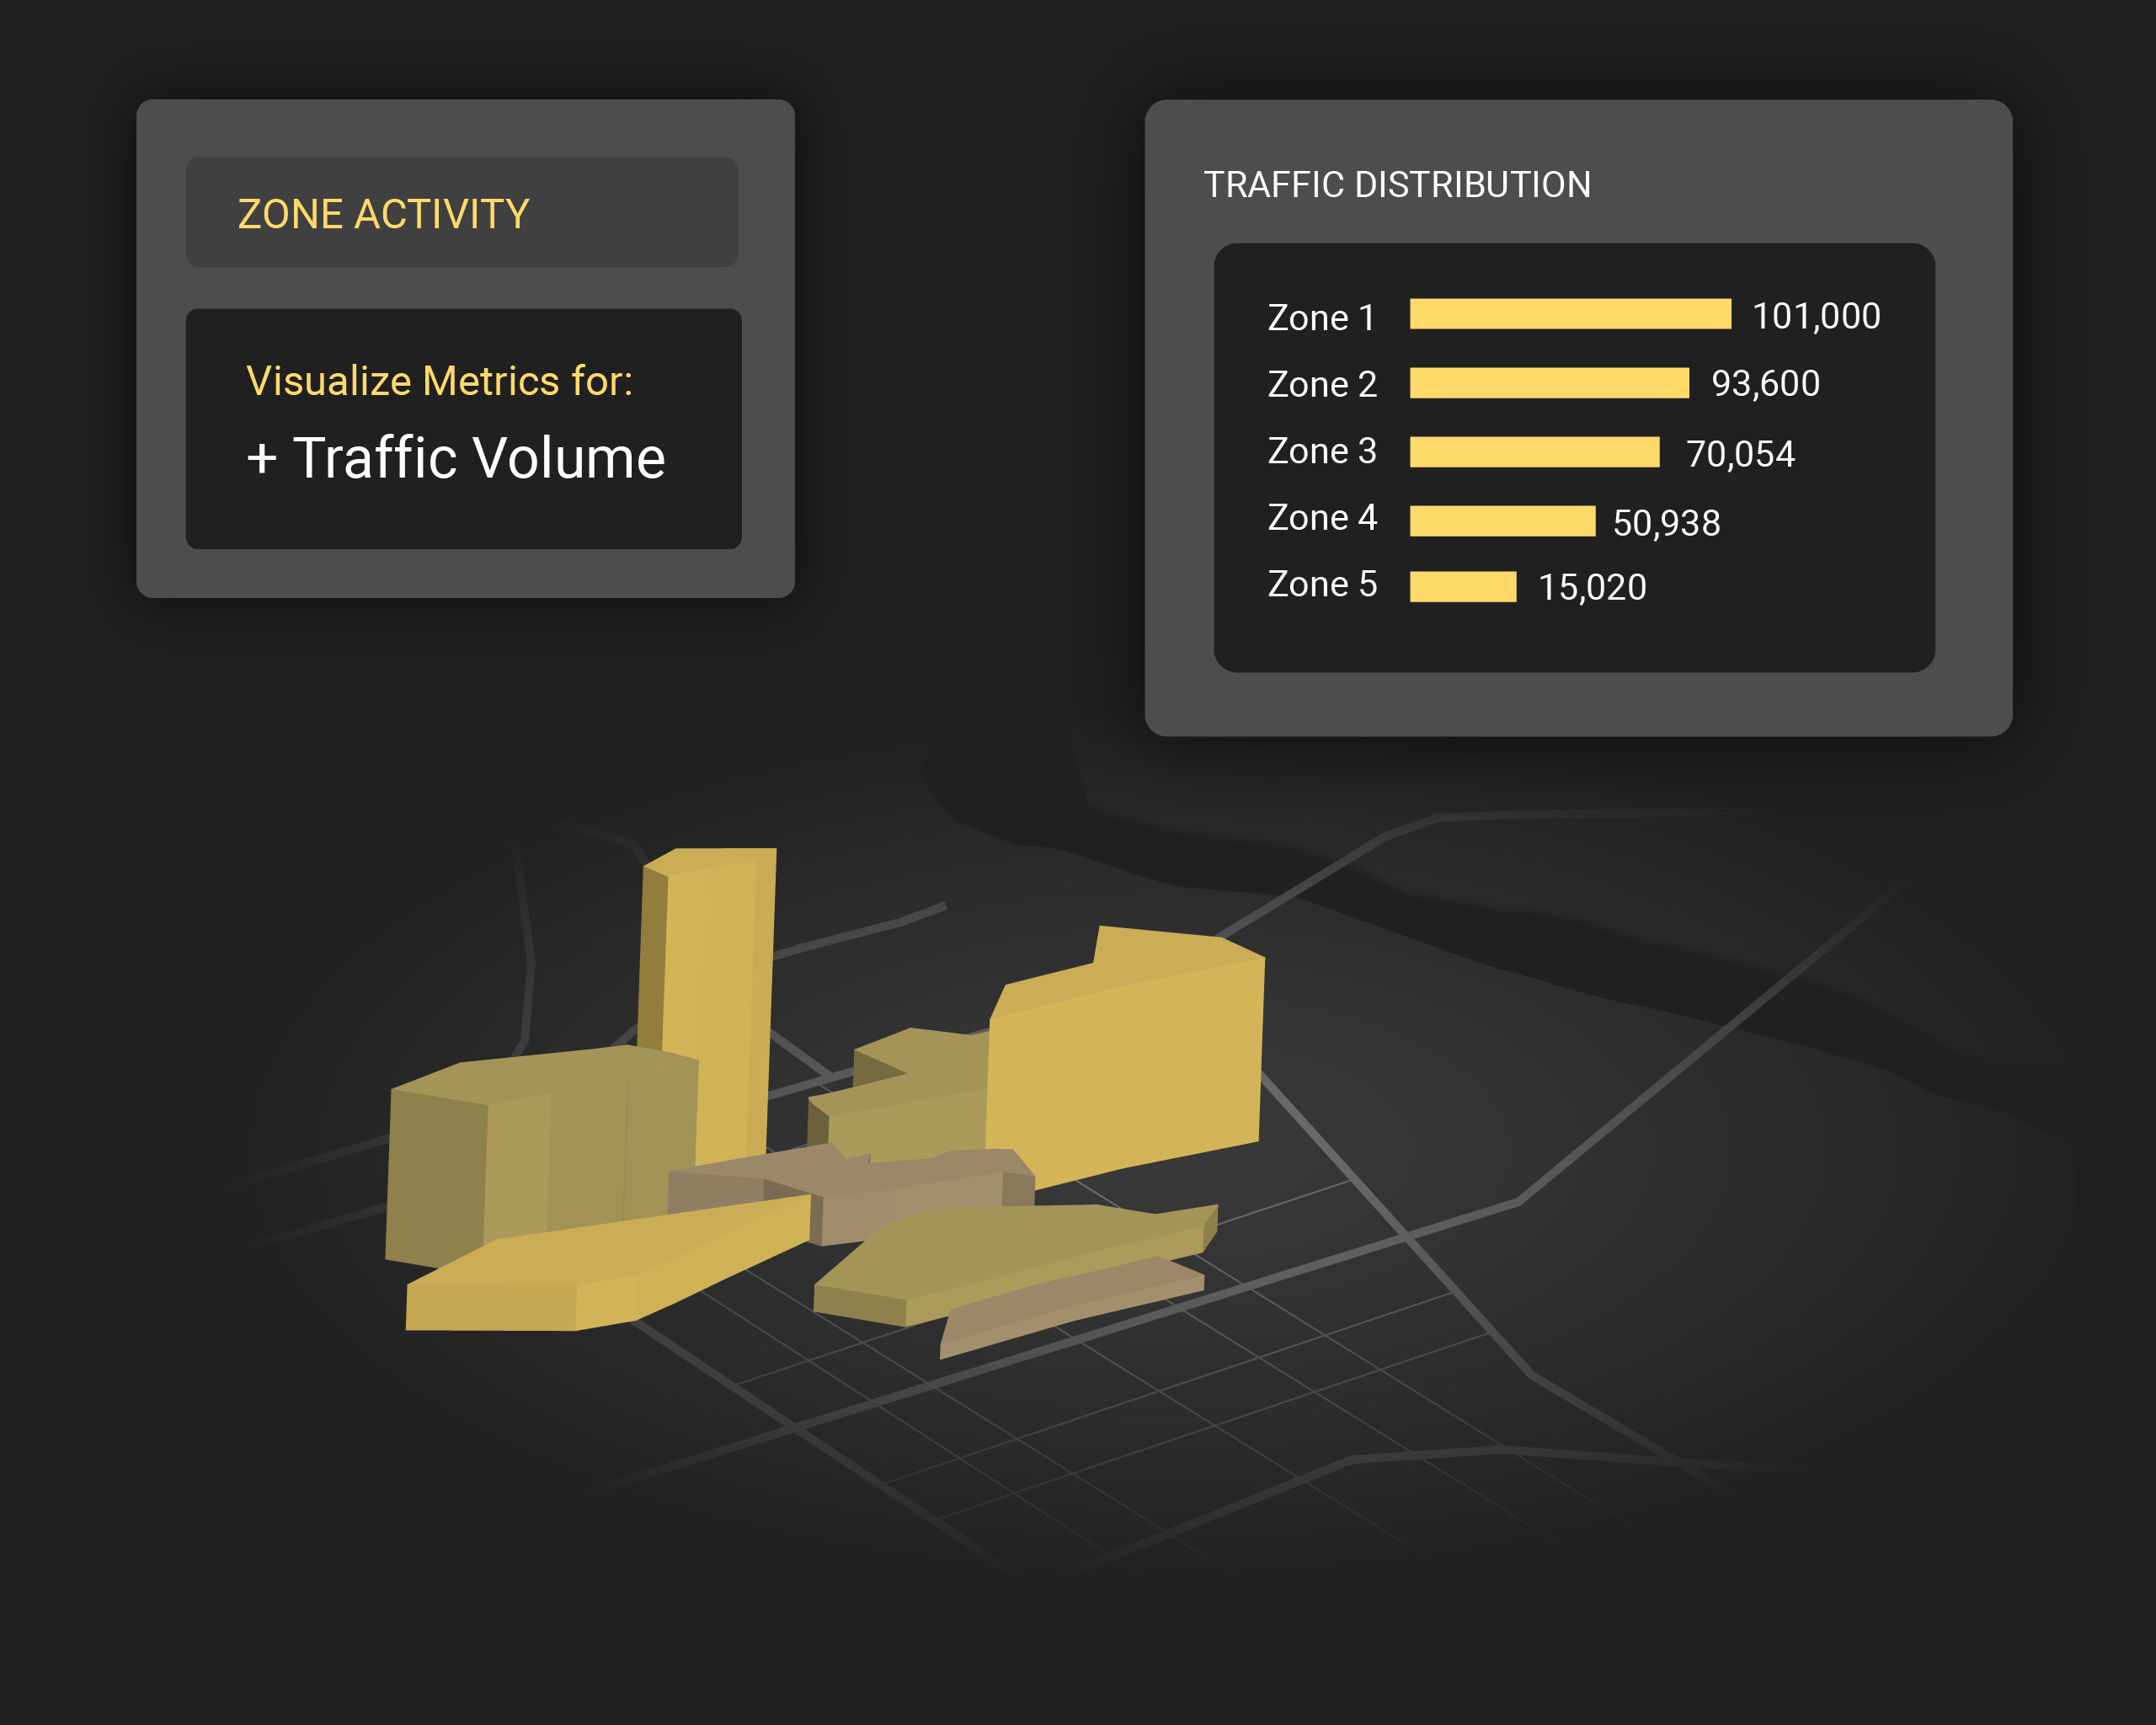
Get insights on the key components of EV site selection, including demand, dwell time, origin-destination patterns, and demographics. Identify charging locations based on your core objectives.
CHARGING AND FUELING INFRASTRUCTURE DISCRETIONARY GRANT PROGRAM (CFI)
Competitive intel to prove how your EV infrastructure will spur adoption and serve disadvantaged communities
Access metrics for data-informed EV planning. Prove the merits of your project to grant administrators and win funds.

Need support for other grants?
See how our analytics and tools can support other grants, including the National Highway Performance grant, Surface Transportation Block Grant Program, Bridge Formula Program, and others at the application and implementation stages.
See how StreetLight
helped other grant winners
Safety
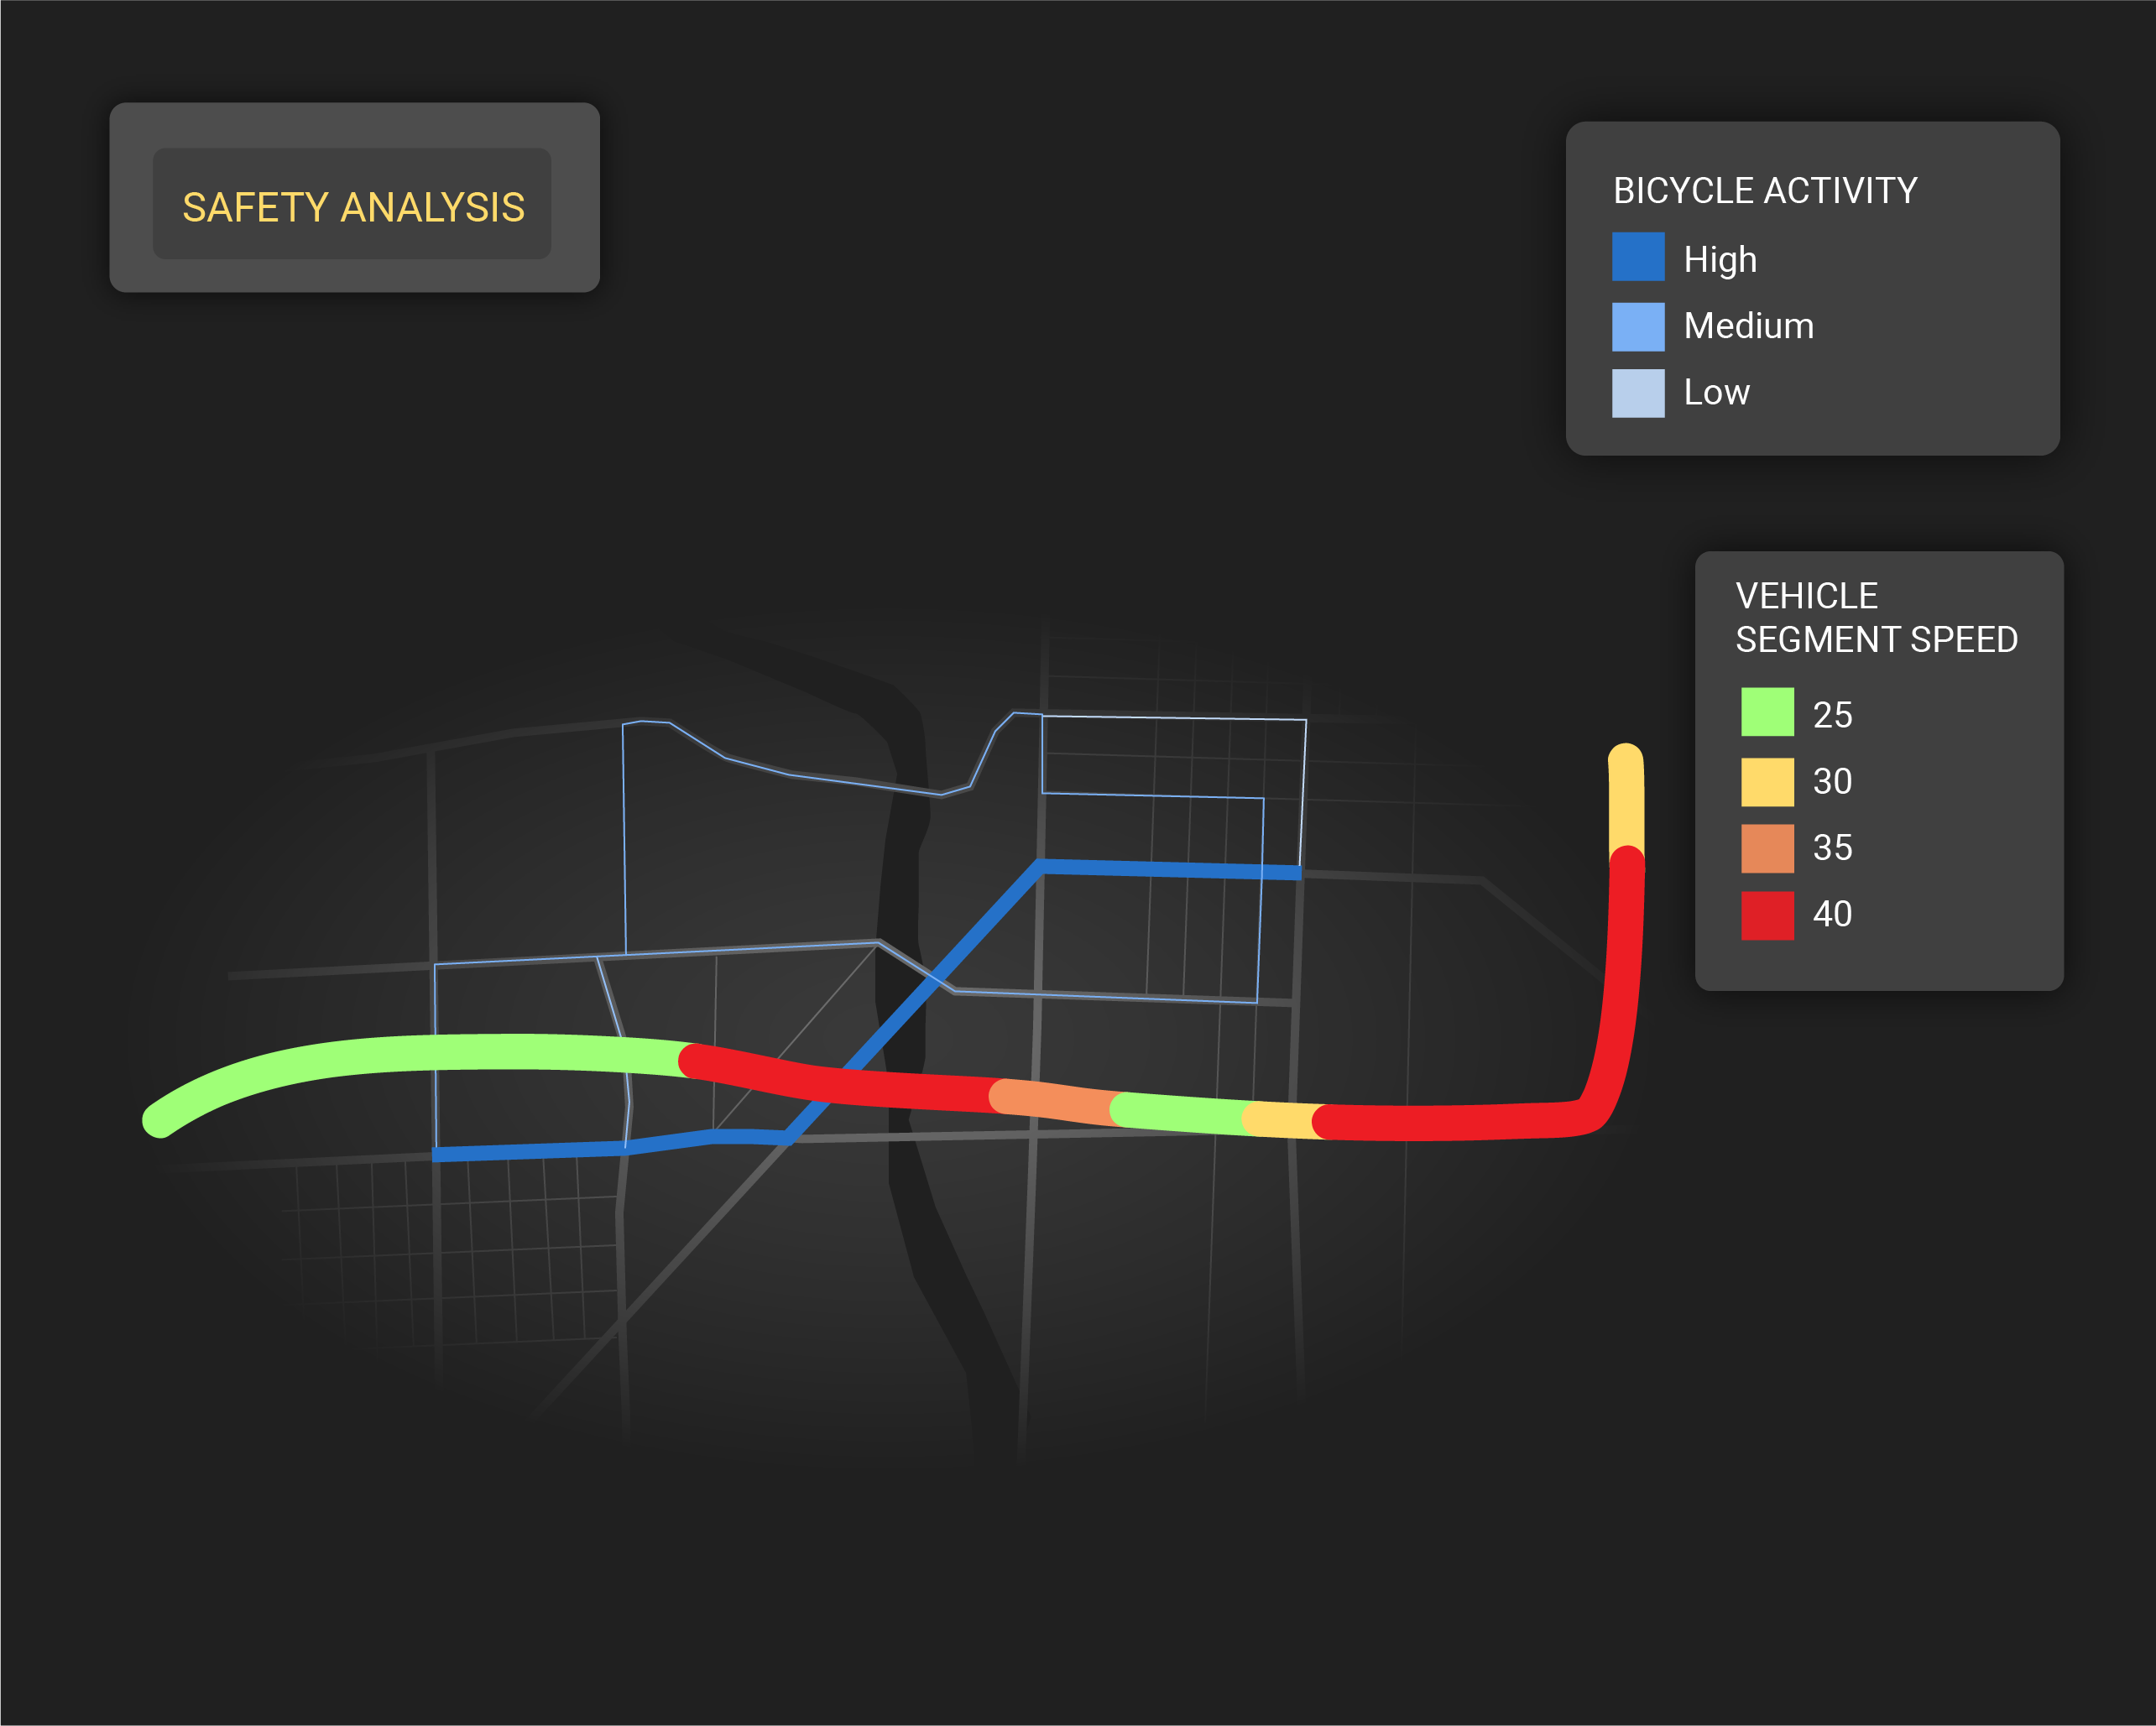
Make your case for how your infrastructure investment supports safe streets.
- Metrics including traffic volumes and speed data can be used to conduct corridor safety assessments.
- Access bike and pedestrian volumes to identify gaps in active transportation infrastructure.
- Layer on demographics to diagnose the social equity impact for safety initiatives.
Equity
Infrastructure that supports disadvantaged communities is a key theme in BIL. Get the metrics to uncover and communicate impact:
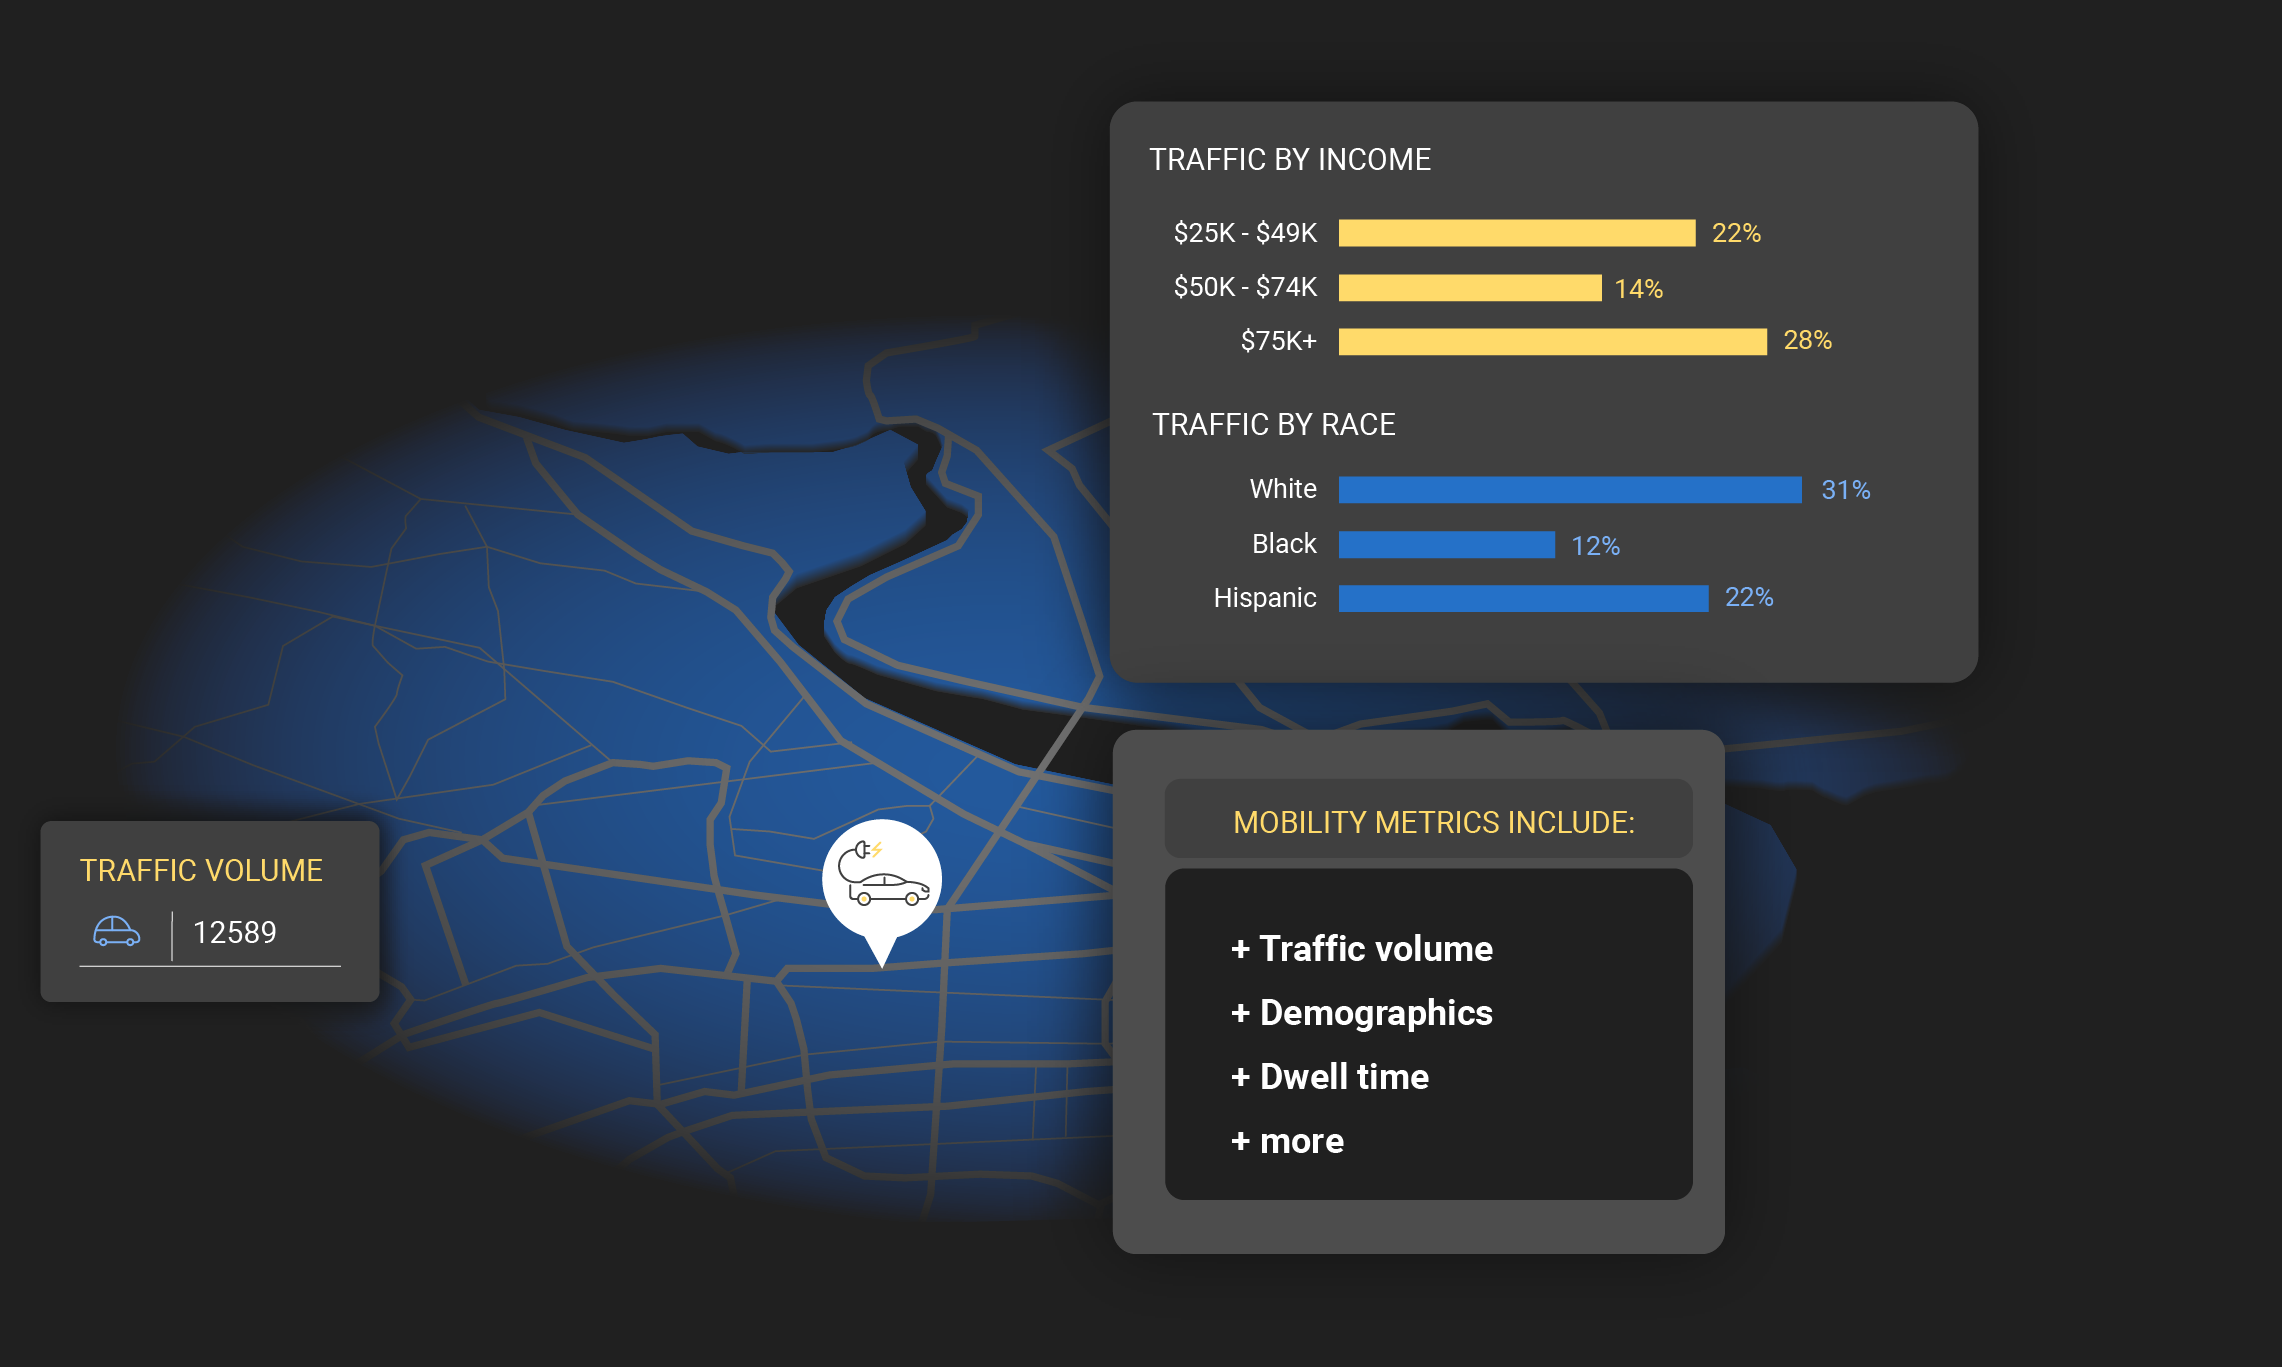
- Aggregate traveler demographics — including race, income, vehicle ownership, housing status, and more — allow you to analyze social, economic, and environmental equity.
- Metrics across any road, any mode, on any day ensure you’re prioritizing all travelers.
- Ensure your data is a representative sample without the time and cost required for traditional travel surveys.
Active Transportation
Bicycle and pedestrian infrastructure supports safety, health, and the environment, key themes in BIL. Access insights to accelerate the multimodal transition.
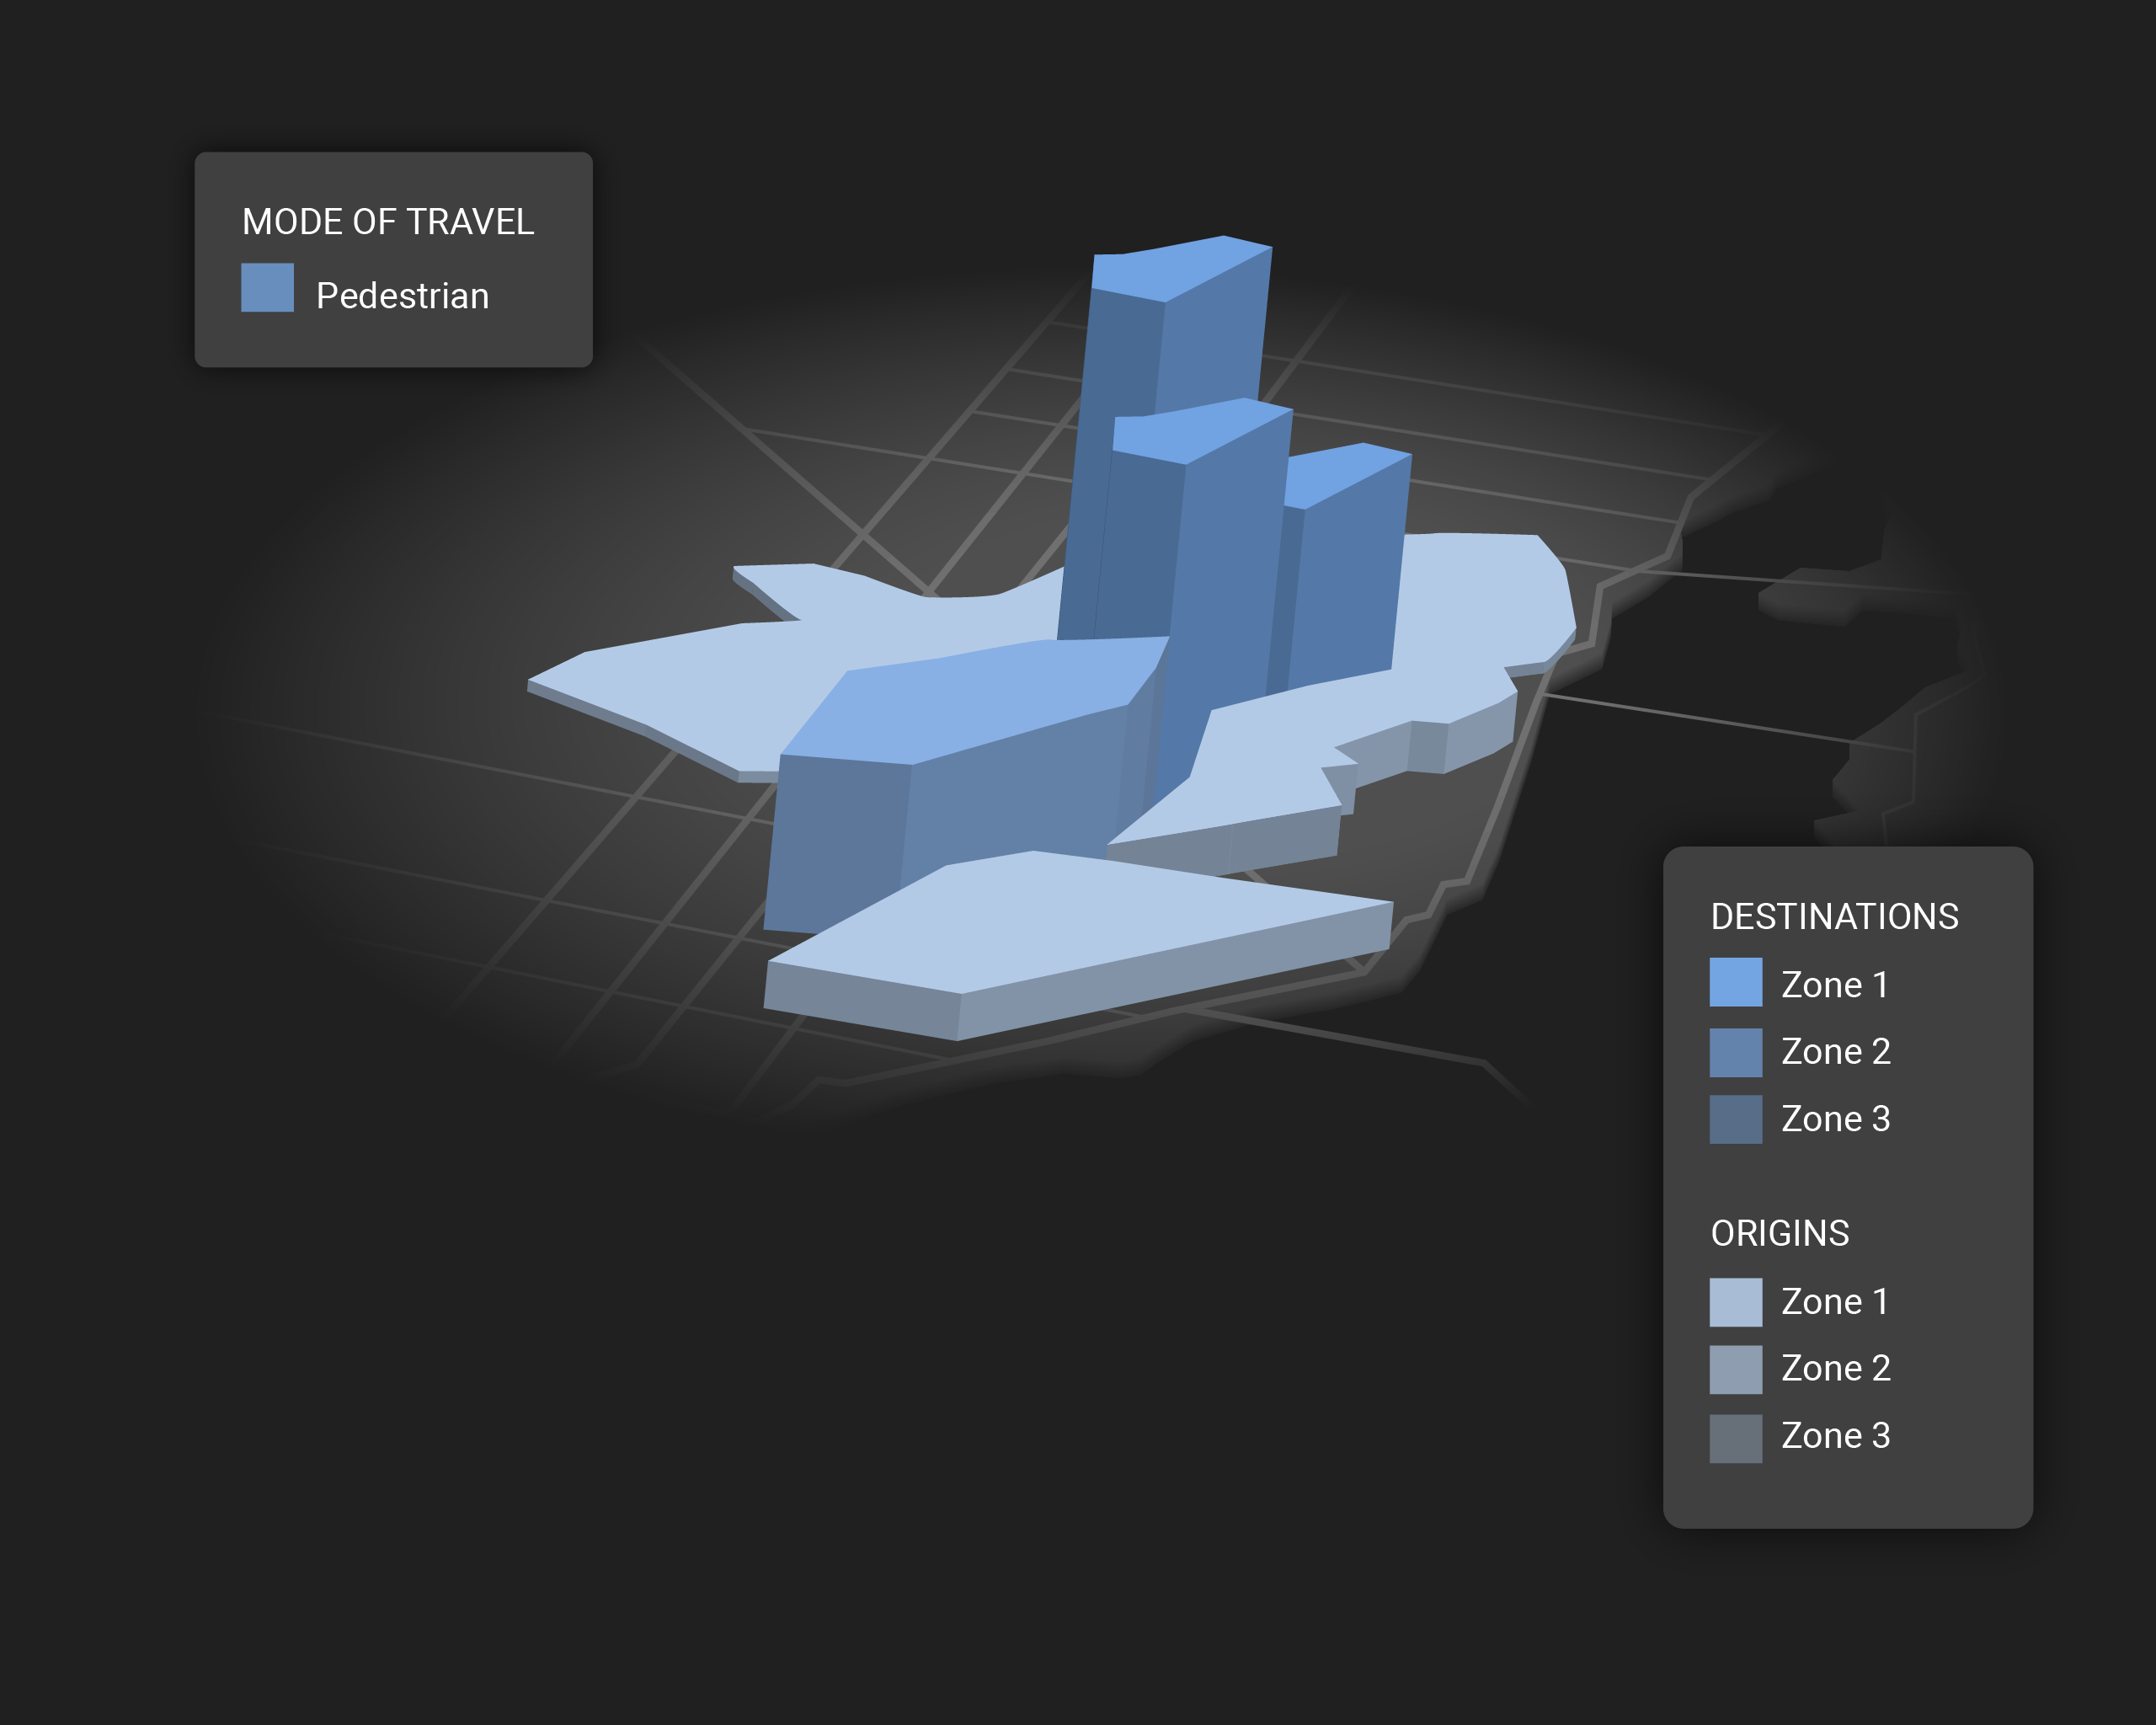
- Study vehicle/bike/pedestrian usage patterns on a corridor to inform a redesign that prioritizes non-vehicle modes.
- Evaluate segment speeds and volumes for bike and vehicle modes to prioritize safety interventions for vulnerable users.
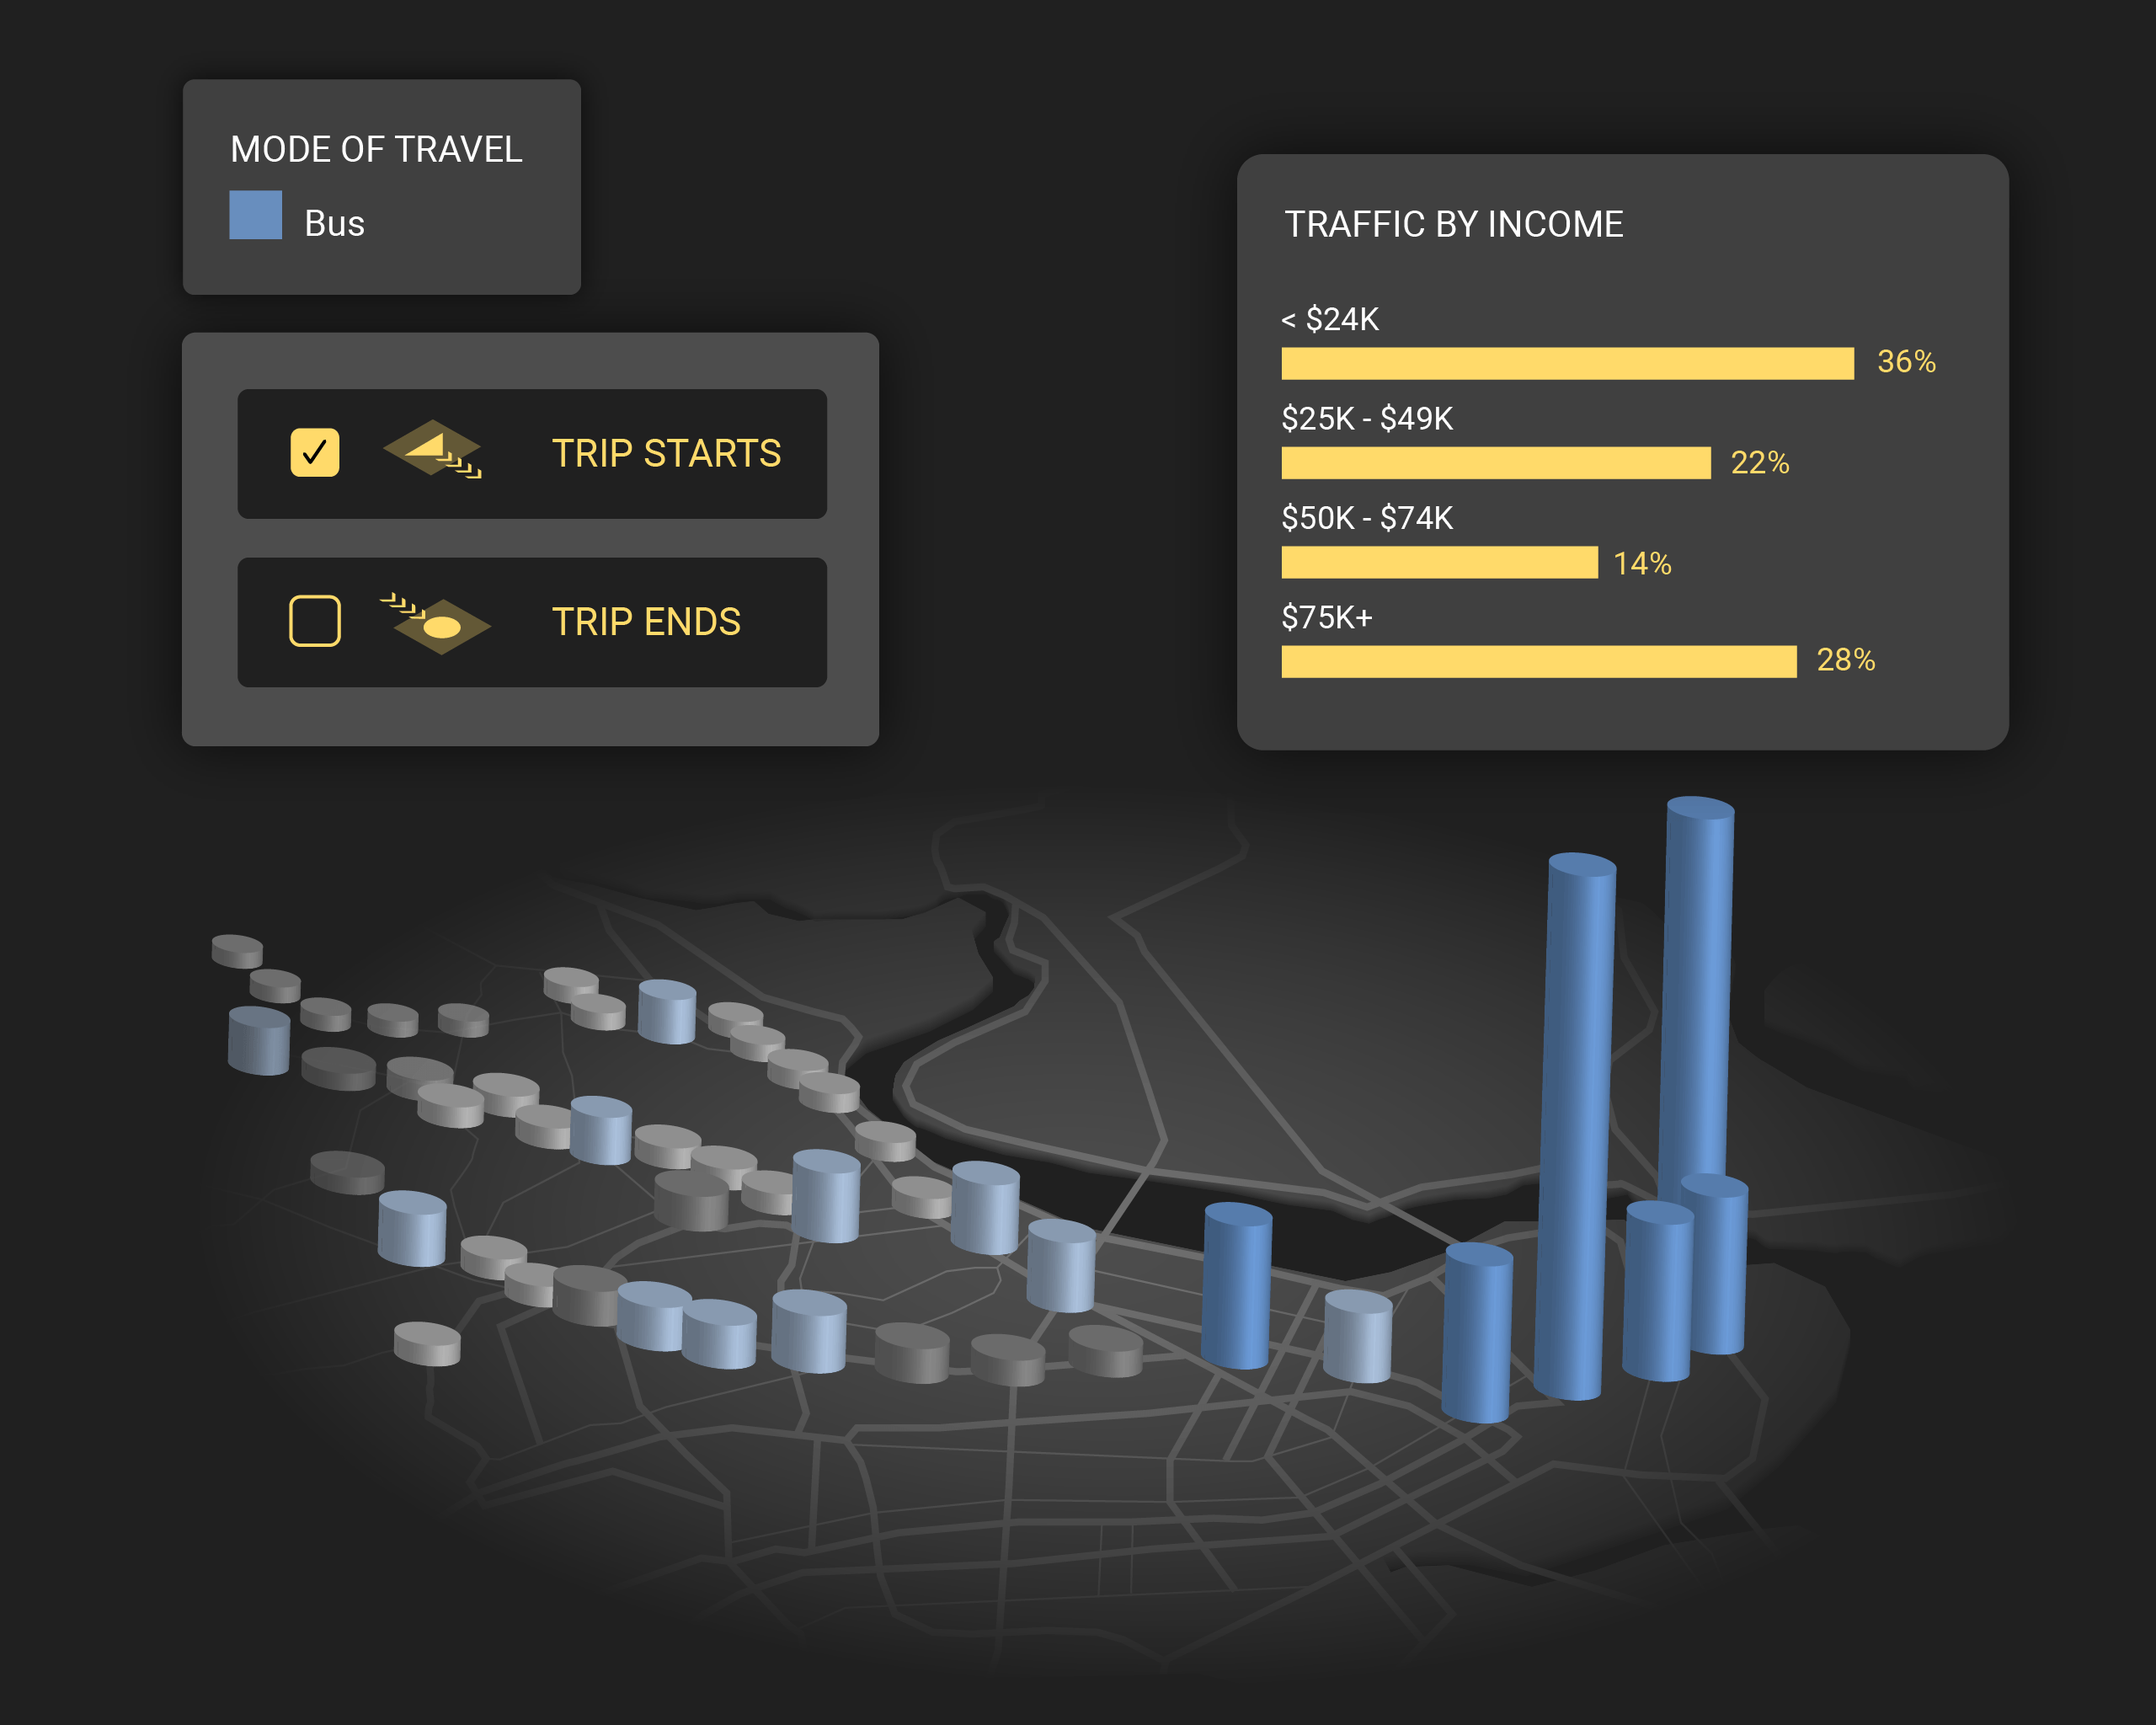
- Analyze pedestrian behavior near transit stations to understand ridership patterns and first- and last-mile patterns.
EV Chargers
Access key metrics for BIL-supported EV site selection and prove how your proposed locations will fast-track the EV transition.
- Get key insights on dwell time, travel patterns, and demographics on demand to guide site selection.
- Use refreshed data on vehicle volumes and shifting travel patterns to implement funds.
- Meet funding and deployment deadlines with on-demand analytics.
Roads and Bridges
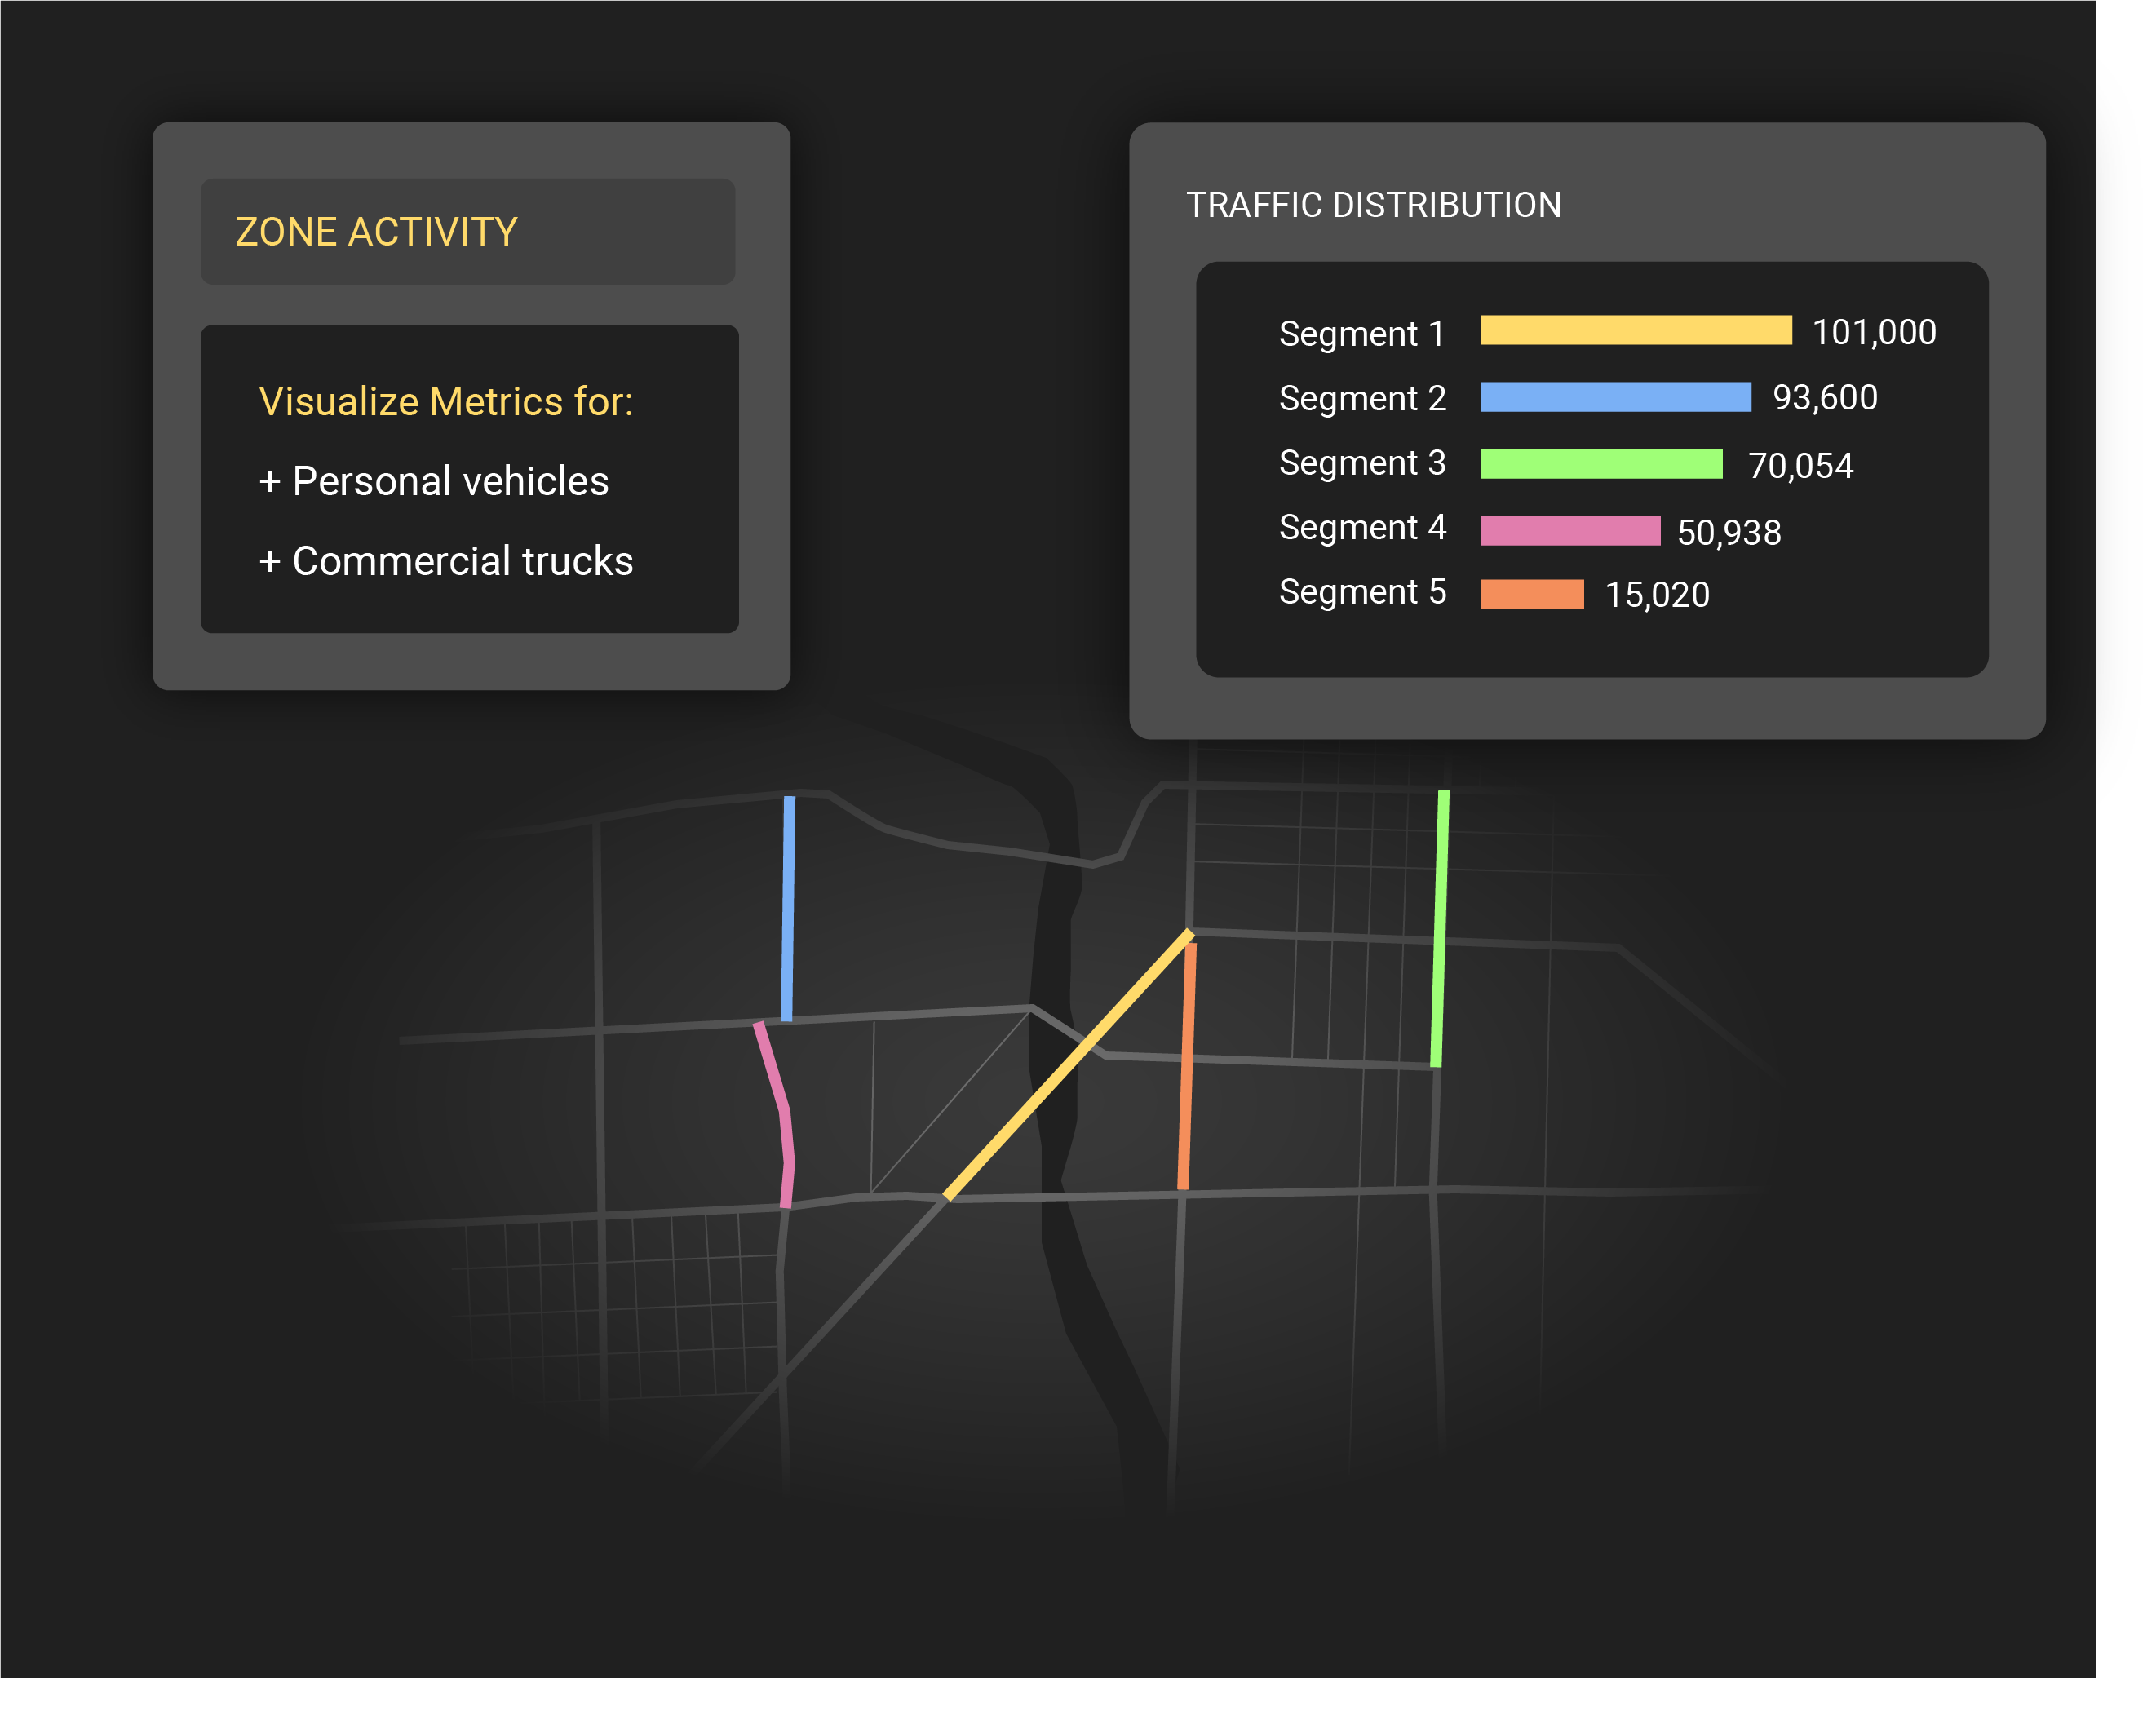
Prioritize core infrastructure for BIL funding using a nuanced planning lens. Get granular, validated car, truck, and active transportation data across any road.
- Access essential transportation metrics including O-D analytics, turning movements counts, Vehicle Miles Traveled (VMT), and AADT volumes.
- Get speed data and top routes.
- Segment activity between personal vehicles, truck volumes, and active transportation modes.
- Use vehicle and truck bridge activity to identify high-priority crossings.
Bus and Rail
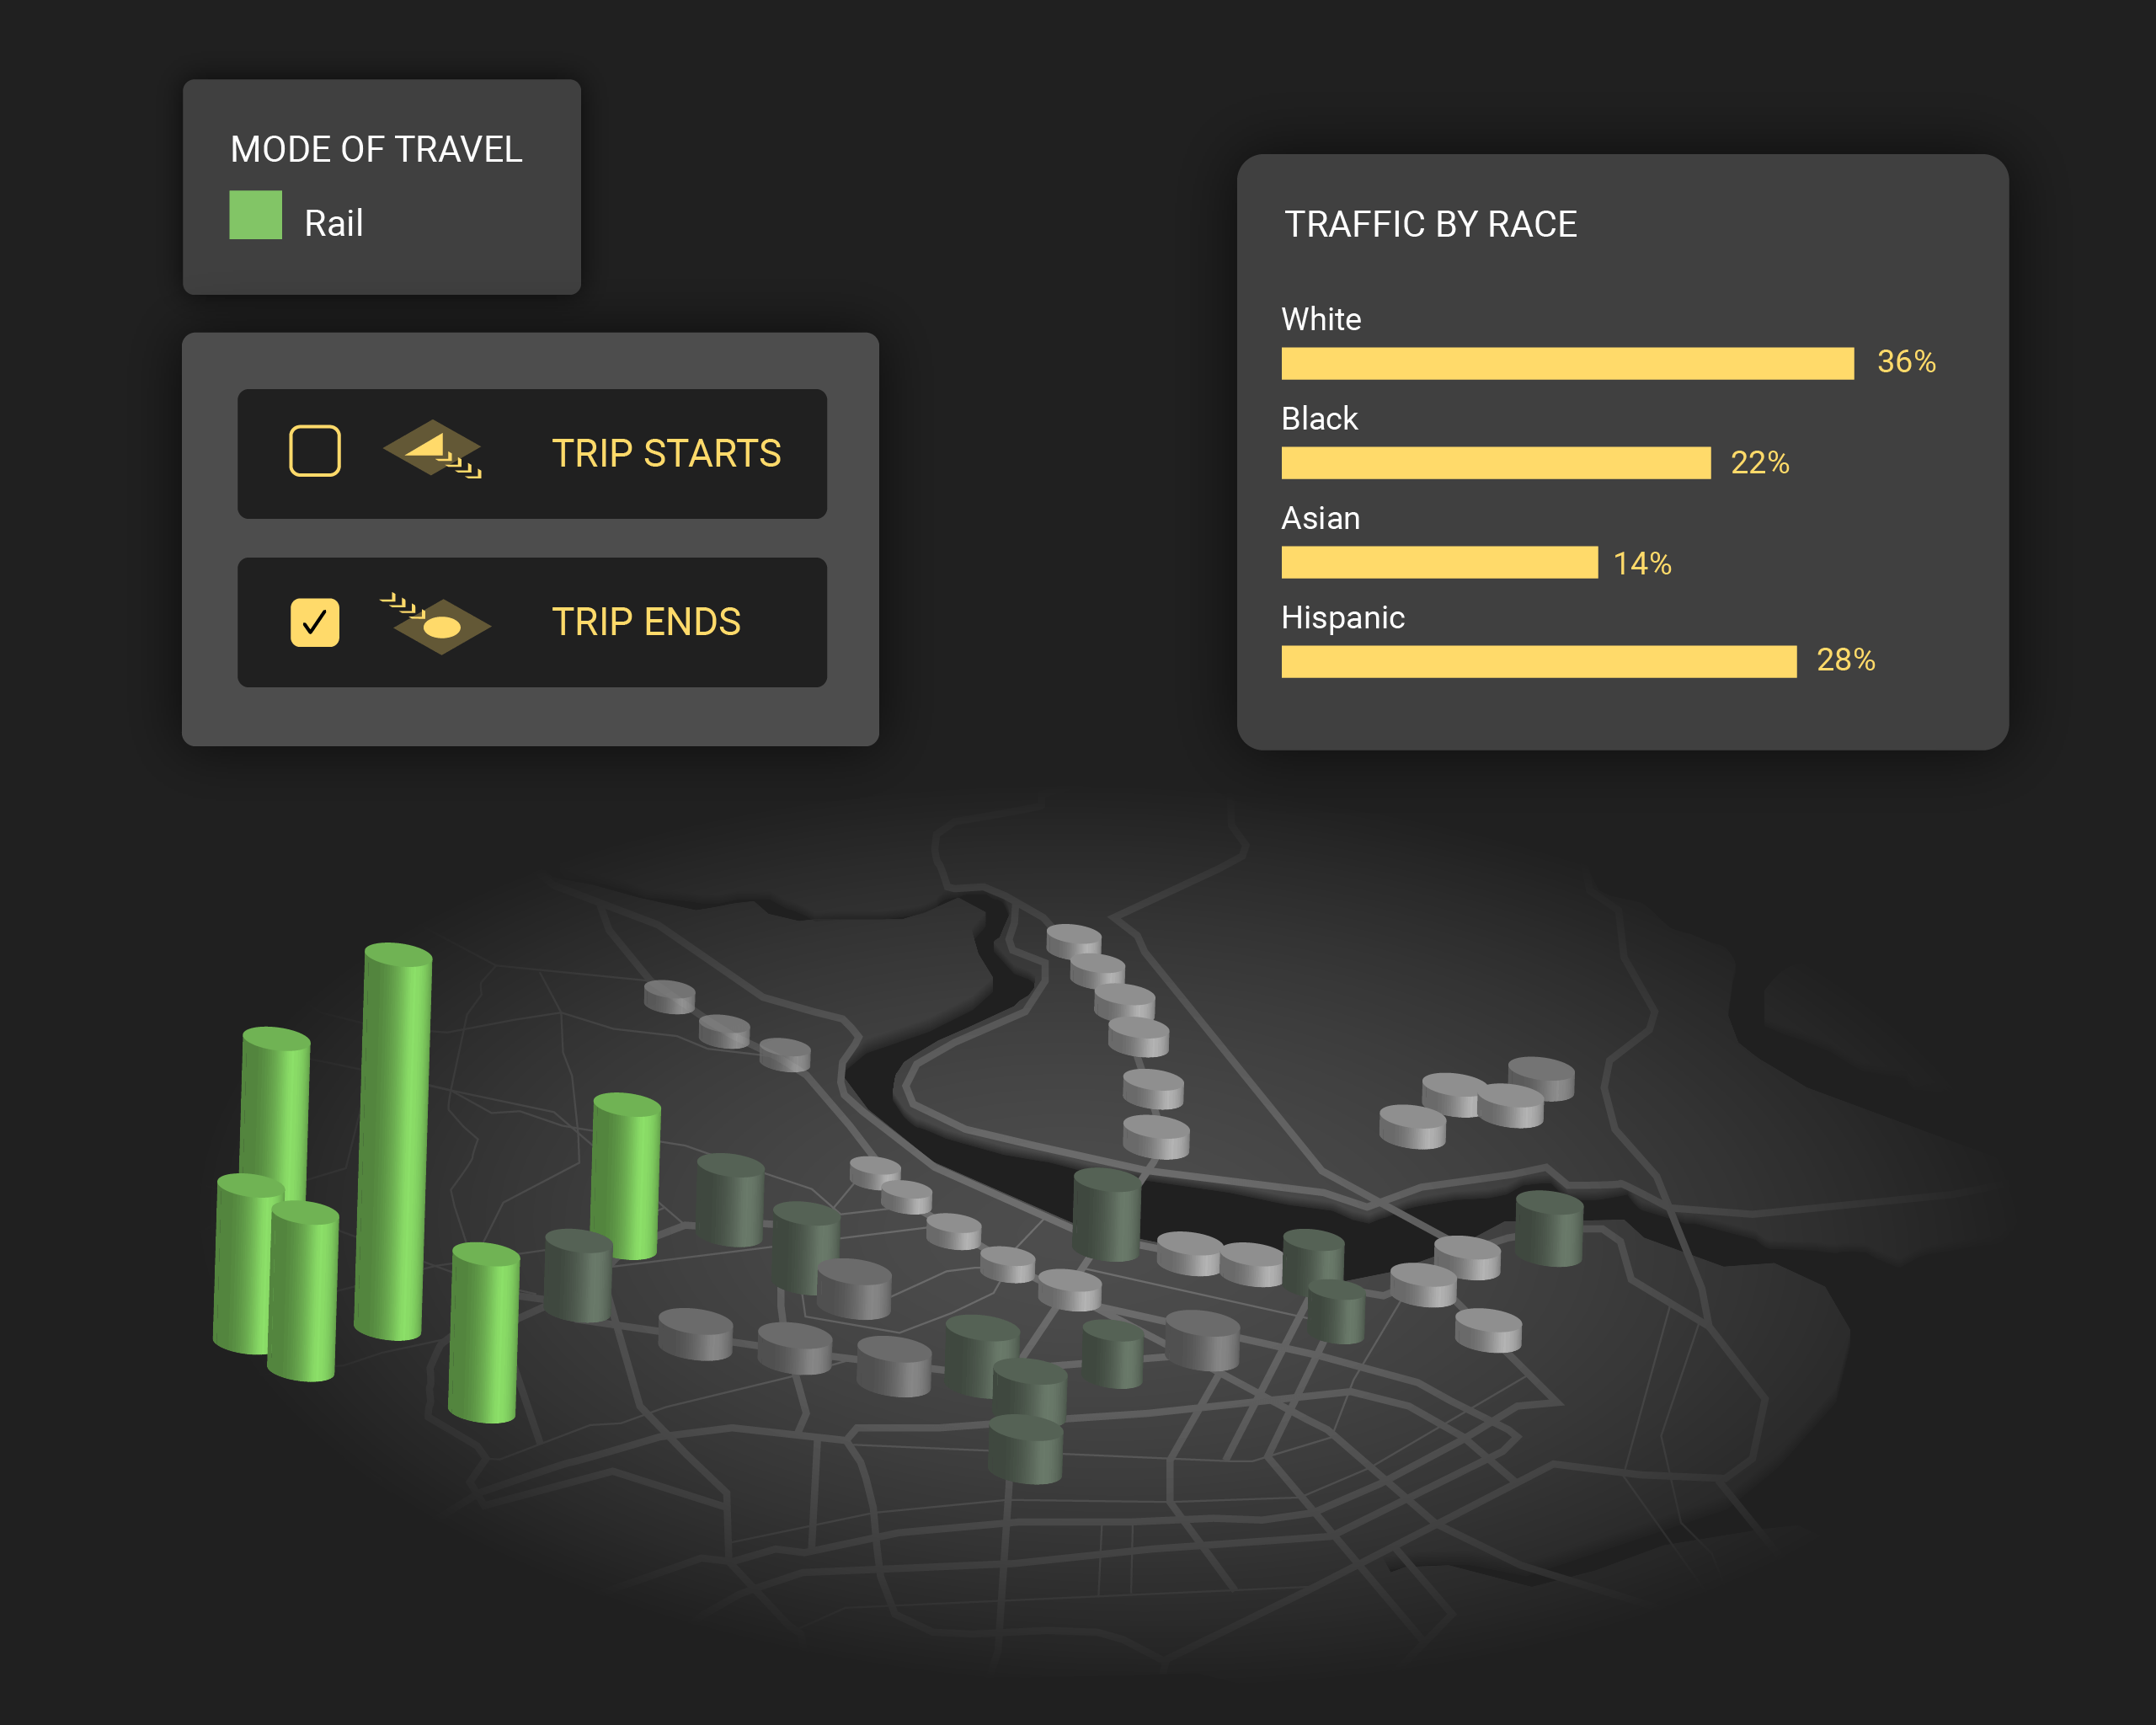
Transit planning is essential to BIL climate and equity goals. Get validated bus and rail metrics to enrich your public transportation planning.
- Identify the most popular O-D pairs in the transit network.
- Measure boarding and alighting across a network for corridor studies
- Understand aggregate ridership demographic data for social equity analyses
Talk to Us
Access validated, empirical data to plan and win federal grants.
*indicates a required field

