
How Does Gig Driving Interact with Congestion? A Road-by-road Analysis.

Many of our clients are concerned with new modes of travel and how they interact with existing transportation. Comprised of services like Uber and Lyft, “gig driving” for riders and delivery is a persistent concern. And its impact on congestion is hotly debated topic. Some claim it makes congestion better (less parking or less personal car driving), and others claim it makes congestion worse. The biggest challenge to finding the answer is a deep lack of available data about this mode of transportation.
Our team at StreetLight Data suspects that the interaction between gig driving and congestion depends heavily on what we call “context,” i.e. location, existing transit, urban density, land use, time of day, etc. We also believe that gig driving is here to stay and that we can arm policy makers with data to avoid the desire to “undo” what is a mobility mega trend — and instead try to harness and accelerate positive effects on the community and transportation networks.
To test our hypothesis about granular variation, we used our access to billions of transportation data points, and a lot of expertise in data science and transportation. We measured the interaction between gig driving and congestion road-by-road throughout the greater Miami region.
Our goals:
a. Find a way to measure gig driving that doesn’t rely on waiting for data sharing by private companies
b. Measure “gig mode share” — or the percent of vehicle trips on a given road segment at a given time that is a gig vehicle — on all roads within a single MSA. We chose greater Miami, an area boasting over six million people, heavy tourism, a diversity of urban density, rich variety of neighborhoods and plenty of nightlife, all adding up to a rich testing ground for our hypothesis.
c. Combine this “gig mode share” analytic with our core analytics about total vehicle volume and congestion to explore the interaction between gig share and congestion in different urban contexts.
Why do this? Because we suspect that sometimes gig is associated with better congestion, sometimes worse, and sometimes it’s neutral. There’s no one size fits all approach to managing gig driving within a city, so we need granular analytics to make good policy decisions, for example, figuring out which areas really need designated pick-up/drop-off areas or need incentives to encourage more equitable gig driving access, etc.
Spoiler alert – our hypothesis was proven largely correct. In the greater Miami region, depending on context, a road with a higher “gig mode share” can have a positive, negative, or neutral correlation with congestion. We measure congestion as (1 – [free flow factor]). See this link for details. The contexts we explored in this report are time of day, proximity to major transit centers, road class (highway/non-highway), land use, and density.
Methodology
StreetLight analyzes mobility patterns from millions of mobile devices every day. Analyzing congestion and driving characteristics for the full population is our core product, and for more on our approach, click here.
To create gig driving analytics, we worked with our partners at Cuebiq and Kochava Collective to segment anonymous users as having gig driving apps installed on their devices. Then we analyzed how those segments differ from the norm. It’s very clear that gig drivers don’t move around like you or me!
Their patterns include more miles traveled per day, irregular routes without fixed favorite places, and more. We used machine learning and probabilistic modeling to identify when a mobile device is in “gig driving” mode, and not — then applied those insights to our existing database. For this study, we analyzed over 15,000 gig drives, and several million personal driving trips.

Findings
Because each region is a unique with its own contextual nuances, these findings only hold for greater Miami! Each city must perform its own detailed analytics on its own context. As we repeat this effort in more places, we may find commonalities. However, we’ve shown that it’s feasible and straightforward to do this analysis for any city.
None of these relationships are causal! They are correlative. [Correlation does not equal causation!]
1. As shown in Figure 1 – gig mode share (gig trips as percent of all trips on the road segment) is higher in certain parts of town, notably tourist- and hotel-heavy areas like Miami Beach, downtown Miami, and at Transportation Network Company (TNC) ramps into Miami-Dade Airport. This matches intuition and helps build confidence in this hard-to-validate analytic.
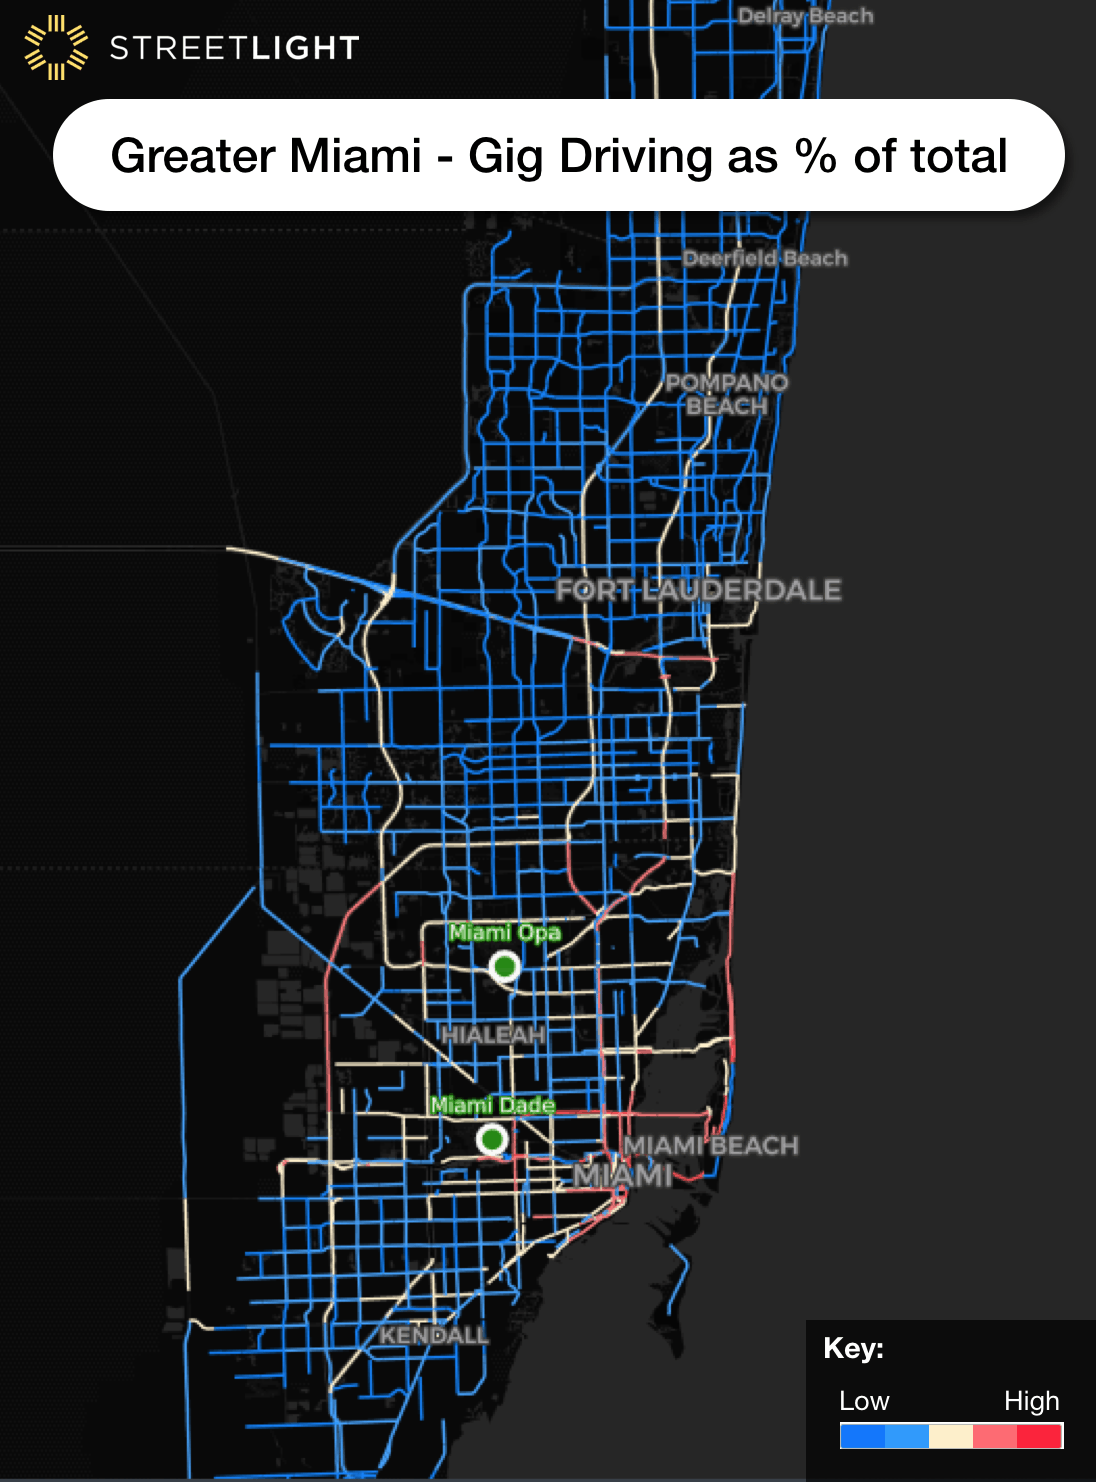
Figure 1 – Gig mode share means gig driving as percent of all trips on road segments in greater Miami (weekday, all day). Heavy gig mode share areas, shown in darker red, are concentrated downtown, airports, and in beach/tourist areas.
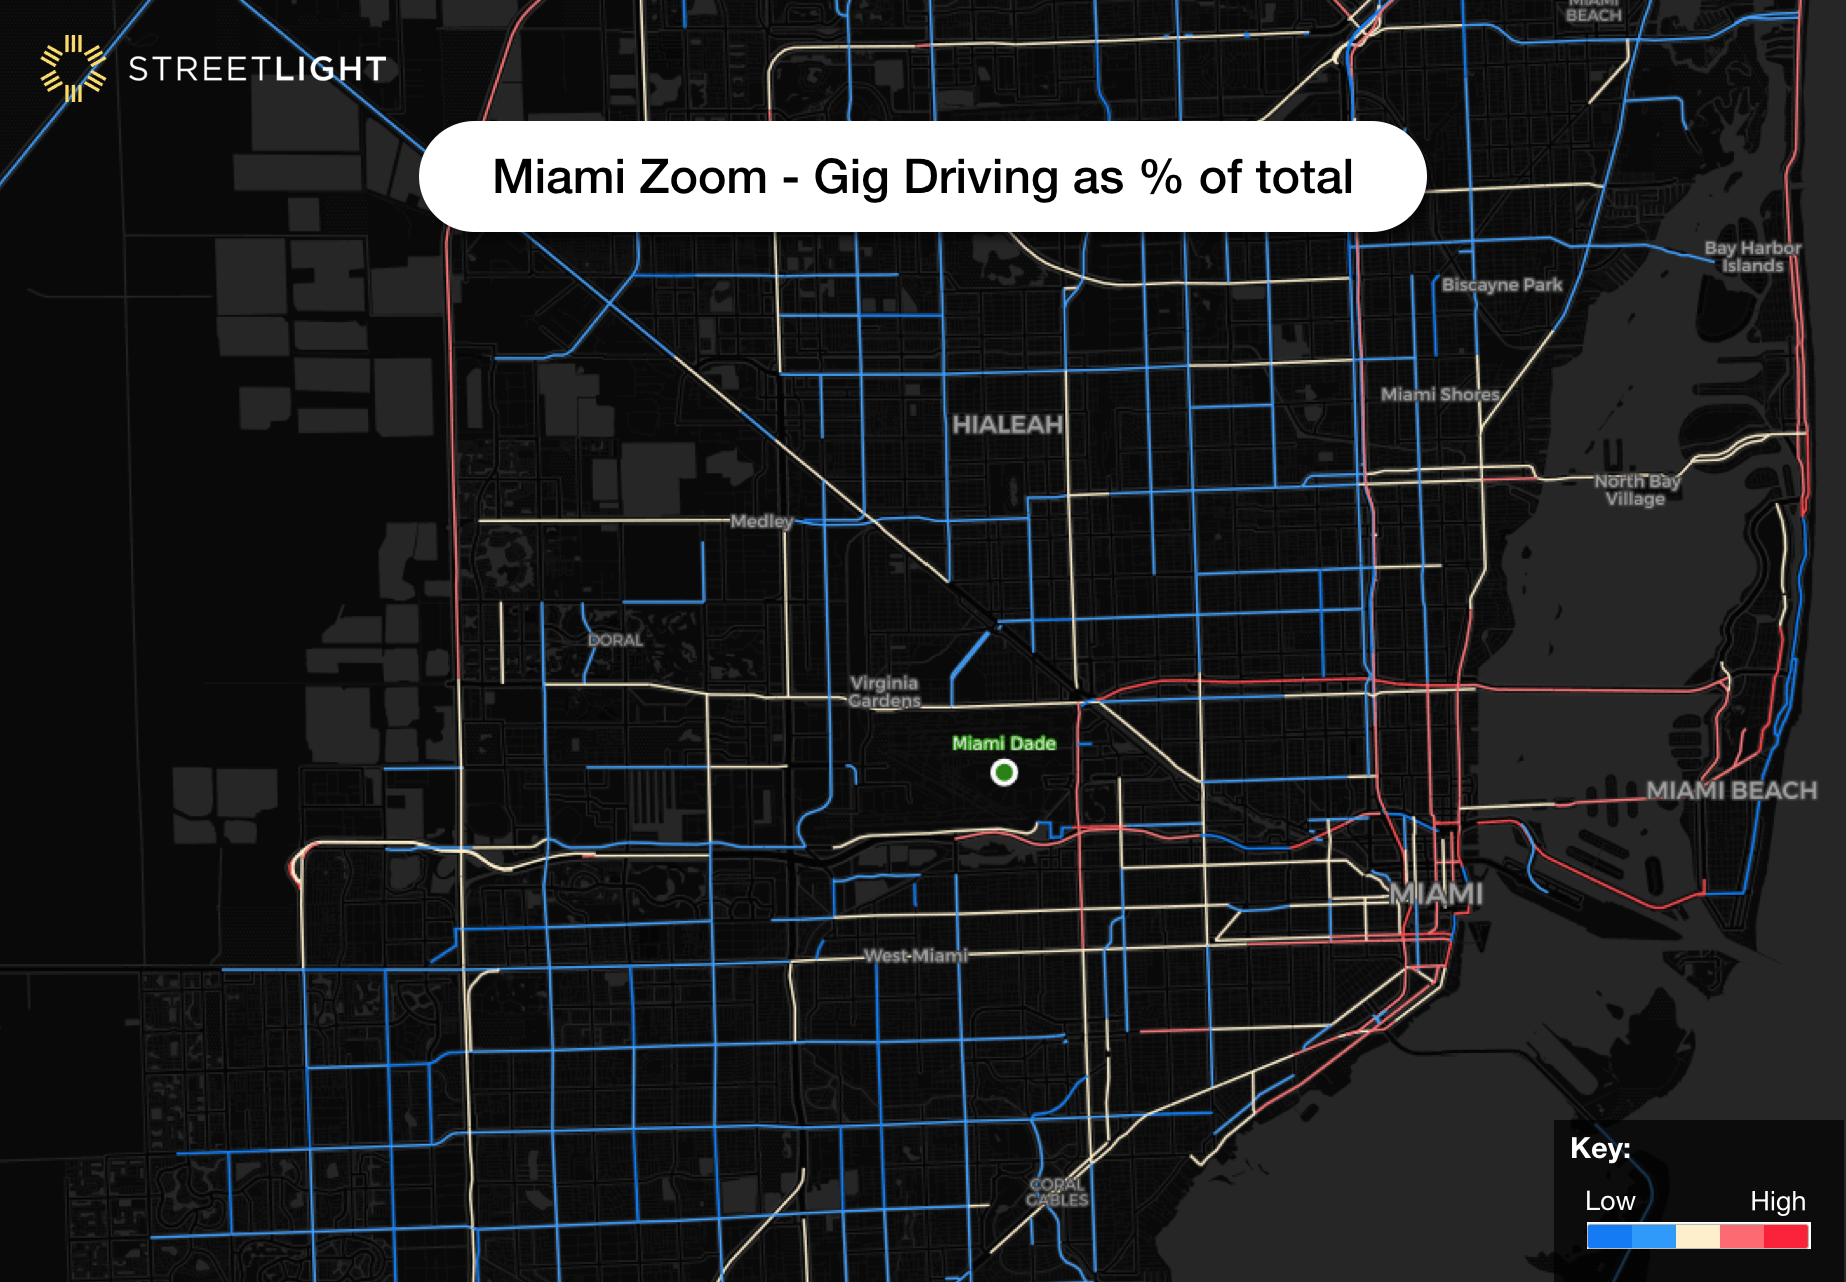
Figure 2: Close up of gig driving as percent all trips in downtown Miami. High gig mode share areas (darkest red) are concentrated at the Airport and heavy hotel/tourist districts, which matches intuition. It is extremely hard to find data to validate gig driving metrics at a granular level because this data doesn’t exist outside of private gig companies’ servers…until now.
2. In general, gig driving patterns follow overall temporal patterns. We see morning and evening peaks on weekdays, for example. However, gig mode share goes up on evenings, late night, and weekends. These are times with low congestion, when a few extra gig cars won’t make a big difference.
If the roads are congested in the first place, if gig creates more trips than would have existing otherwise, gigs do make a difference (like any type of marginal addition). Thus, the relationship between gig mode share and time of day is neutral.
3. In general, gig driving is a fairly consistent share of highway driving. This means that all highways have a similar experience with gig, and there are not one or two highways disproportionately impacted. Highways with higher gig mode shares have a very slight increase in congestion (especially on weekdays), but it is between 0.1% and 0.2% increase for each % increase in gig mode share – which is barely noticeable even in rush hour.
4. The bigger opportunity for policy makers is on non-highway roads. On arterial roads, we see 6x the impact as on highways: a 0.6-0.7% increase in congestion with each percent increase in gig mode share. Thus, we find that, in general, gig mode share has more variability, and more of an impact, on congestion, on non-highway roads. Policy makers can use this to find local roads to focus on for interventions.
5. In commercial areas (as opposed to residential areas) is where it gets interesting. In greater Miami, in the very dense neighborhoods (top 10% of points-of-interest density, see map) a high gig mode share is correlated with a lower congestion.
However, in the mid-dense commercial areas, high gig mode share is correlated with higher congestion. We interpret this to mean that in greater Miami there’s a threshold of activity density above which gig mode share increases are associated with less congestion, and below which gig is associated with more congestion.
Perhaps this is because of reduced parking-searching in the very hot neighborhoods. But in medium-density neighborhoods, the gig vehicles may be adding trips or stopping and blocking traffic. Other Miami-neighborhood-specific factors like road width may come into play as well.
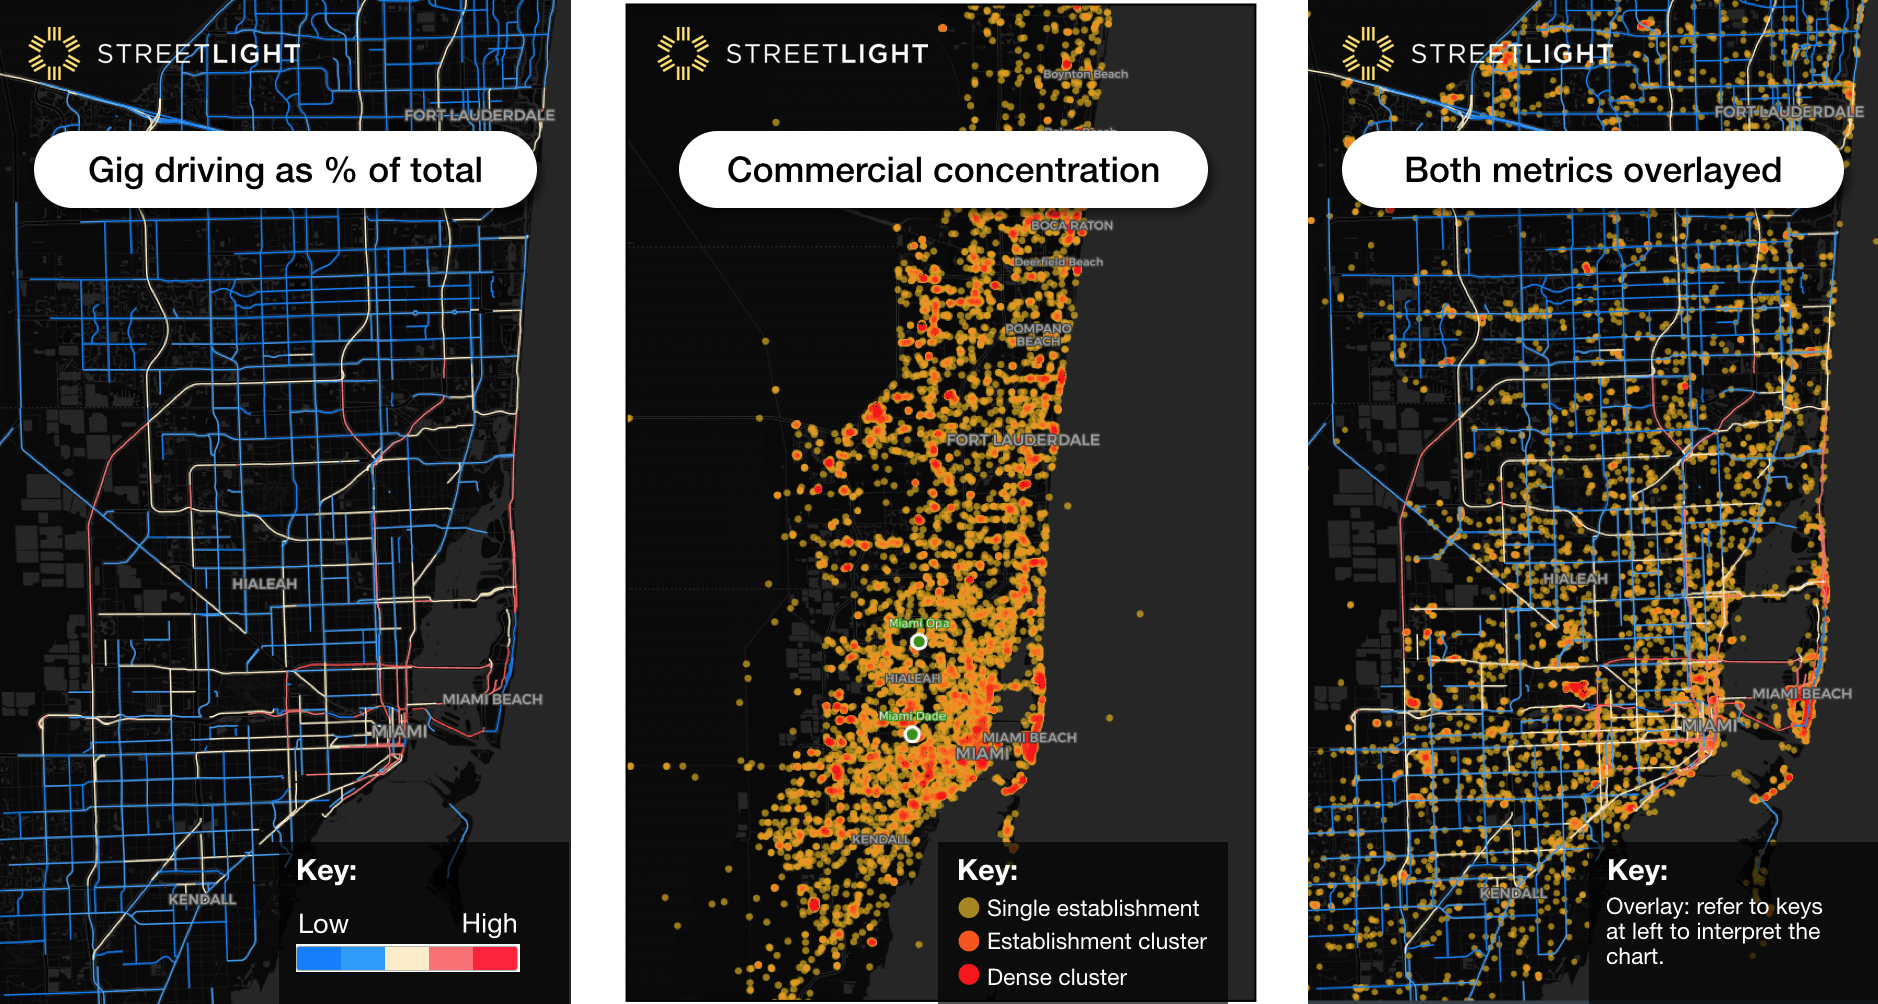
Figure 3a, b, c: Gig driving as percent of total, location of commercial points of interest (like restaurants, bars, entertainment) and a mashup. In some locations, both gig mode share and POI are “hot.’ These are areas associated with less congestion compared to areas with gig mode share is high but POIs are moderate – suggesting an activity threshold above which gig is associated with better congestion in greater Miami.
For example, Figure 4a shows neighborhoods near downtown Miami. All of them are in the top 20th percentile in terms of gig mode share as a percent of all driving on weekdays. Orange neighborhoods, like Little Havana, have both high gig mode share and high congestion. Green neighborhoods, like Bay Shore, have high gig mode share but very low congestion.
Even within the orange neighborhoods, the ones with a star, like Brickell, representing “top activity density” are likely to have lower congestion than one with no star. Image 4b shows the same information but for weekends.
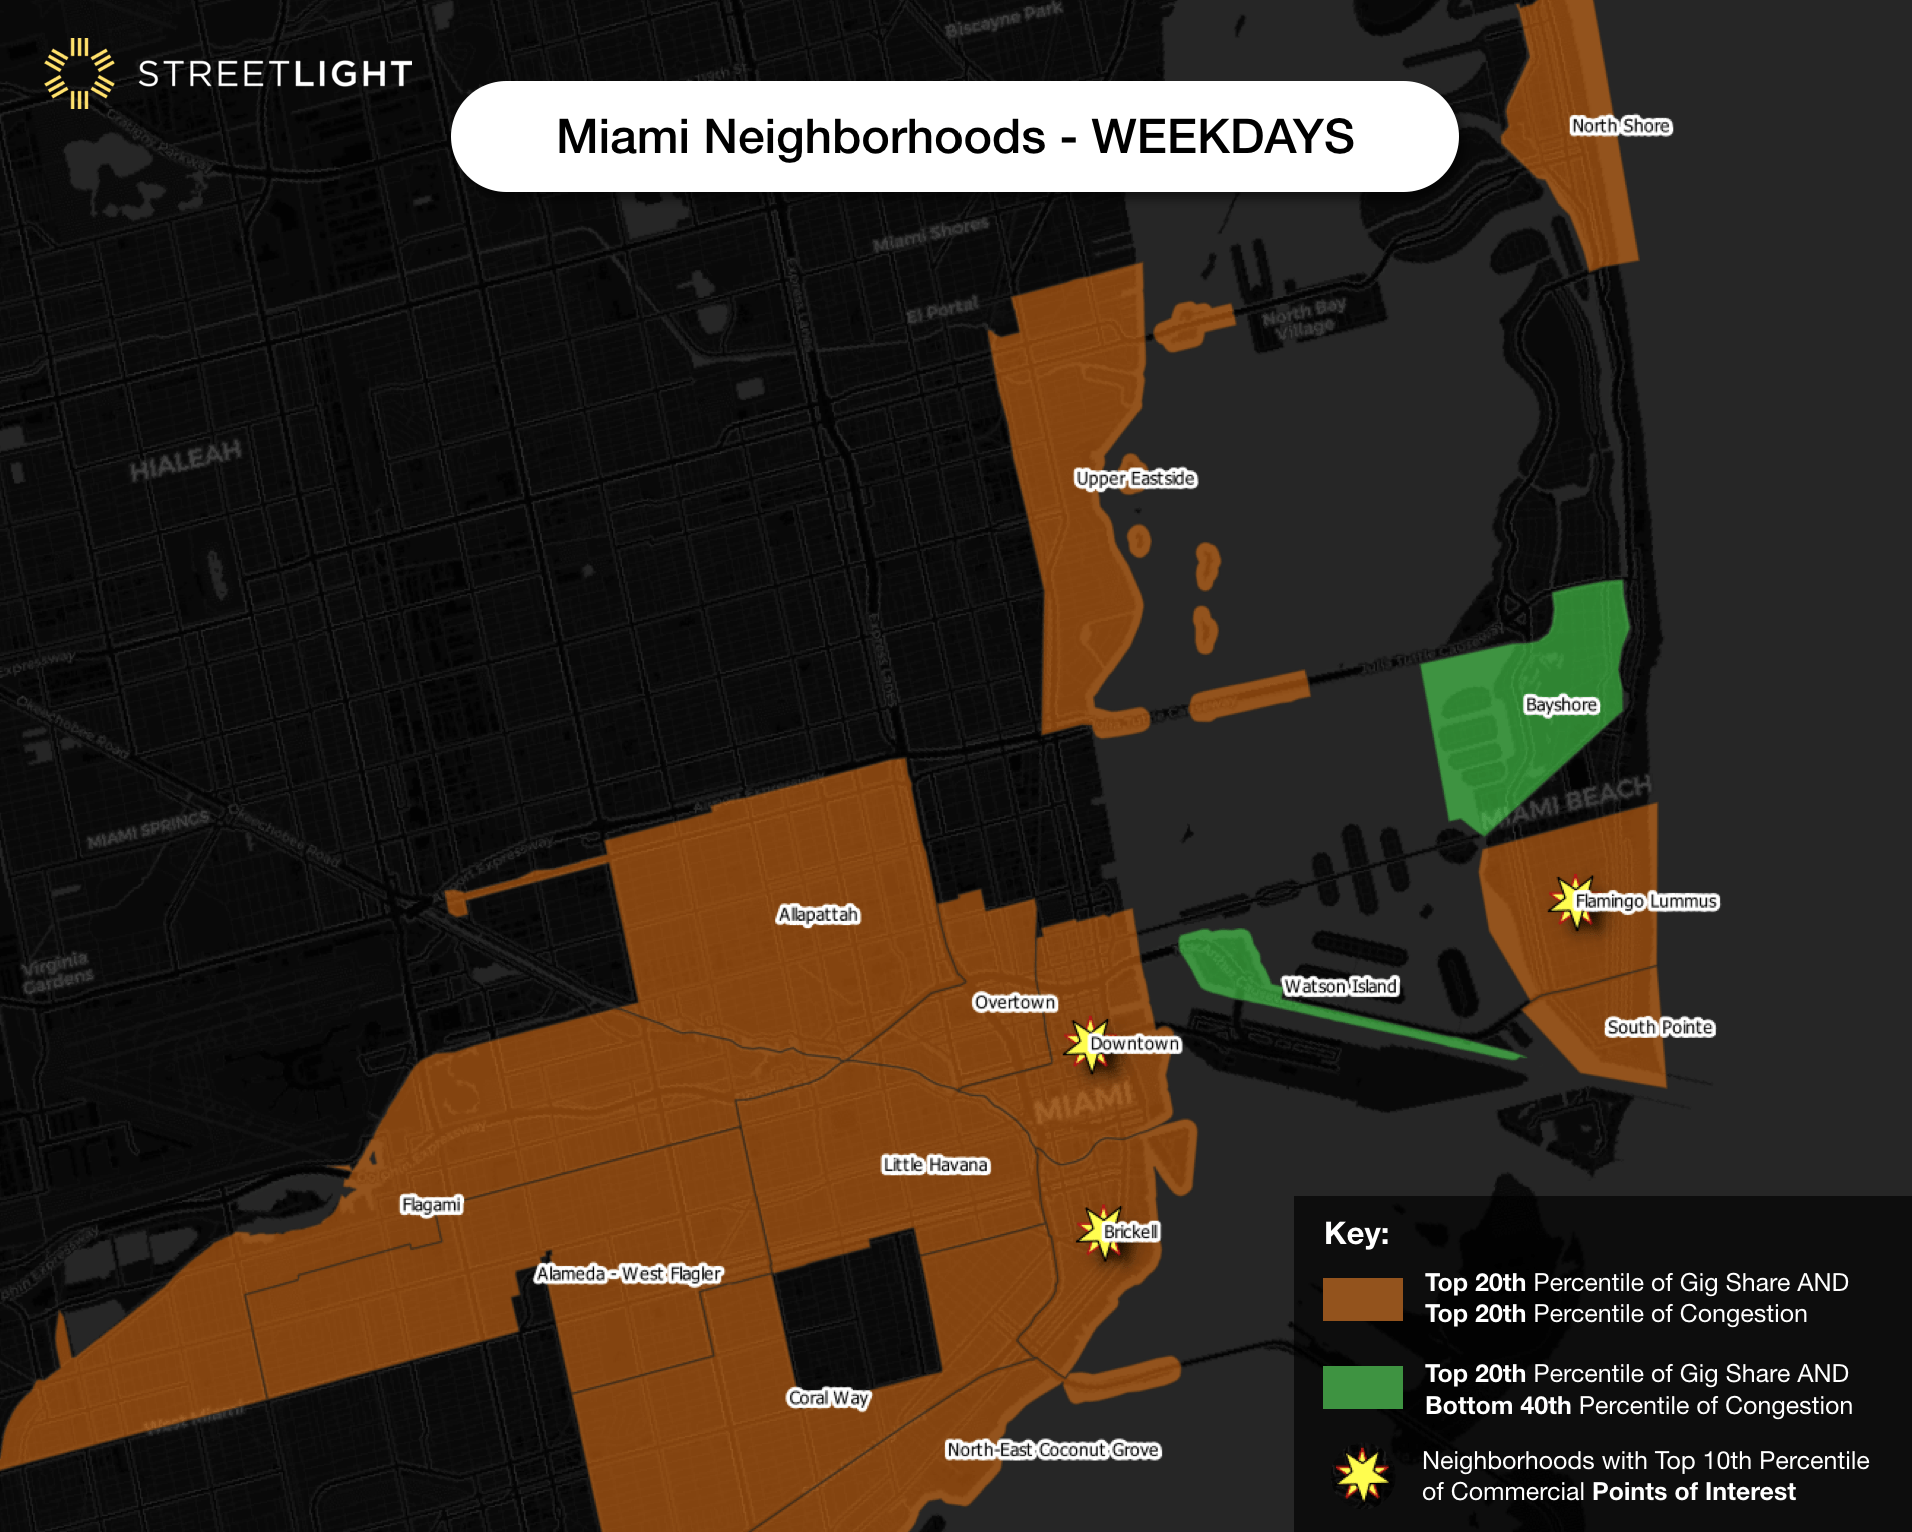
Figures 4a and 4b: These maps show neighborhoods in central Miami (as defined by Zillow). Green neighborhoods are ones where gig mode share is very high (top 20th percentile) and congestion is fairly low (bottom 40th percentile). Orange neighborhoods are ones where gig mode share is very high (top 20th percentile) and congestion is very high (top 20th percentile). The stars show neighborhoods with very high concentration of bars, restaurants, stores etc. Even though some of these neighborhoods are “orange” they are likely to get a little less congested as more gigs enter, though the opposite relationship is true for their non-starred peers.
6. Transit Hub Proximity – We looked at the subset of roads that were within 400 meters (walkable range) of the various bus and transit stations in the region. Overall, these roads are more congested than the typical greater Miami road. This doesn’t mean transit causes congestion! It means we tend to put transit in busy places, as we should.
In these zones, the higher the gig mode share, the lower the congestion. This finding may be a restatement of our finding #4 – as more transit hubs are in high-density areas. It may also mean that lots of people are taking gig to transit stations in the further-flung, less congested parts of town. Future analysis of transit ridership and gig trip destinations will help us learn more about this relationship.
We know there are so many more contexts to analyze, and we are already getting started. This analysis looked at variation of gig driving across one region in the present – other researchers in the past have looked at changes over long period of time (before and after gig hit a city), and StreetLight can explore that in the future.
In addition, we can look into the context of demographics, rent prices, and transit ridership. We can split out gig delivery from gig rideshare. We want to measure the way gig driving interacts with social justice, safety, climate, and VMT, not just congestion.
If you have more ideas of context, please share them with us! It’s a complicated story, and we strongly believe granular analysis is critical for understanding it. We therefore wanted to get the conversation started with these first set of results.
To close, here’s a video that shows a subset of the Gig Driving “pings” animated over 24 hours. Most activity is concentrated downtown and in Miami Beach. But a few lucky (unlucky?) drivers get some 1+ hour trips into and across the Everglades!JTNDaWZyYW1lJTIwdGl0bGUlM0QlMjJ2aW1lby1wbGF5ZXIlMjIlMjBzcmMlM0QlMjJodHRwcyUzQSUyRiUyRnBsYXllci52aW1lby5jb20lMkZ2aWRlbyUyRjMwNDkyMzY3OSUzRmglM0Q1MTljODhlMjYzJTIyJTIwd2lkdGglM0QlMjI2NDAlMjIlMjBoZWlnaHQlM0QlMjIzNjAlMjIlMjBmcmFtZWJvcmRlciUzRCUyMjAlMjIlMjAlMjAlMjAlMjBhbGxvd2Z1bGxzY3JlZW4lM0UlM0MlMkZpZnJhbWUlM0U=