
Three Things You Missed at TRB’s Annual Meeting 2022

Despite “Is TRB 2022 virtual” being the event’s most searched phrase on Google, hundreds of exhibitors and thousands of attendees braved the weather and the pandemic to show up in Washington D.C. last week for the Transportation Research Board (TRB) 101st annual meeting.
Secretary Pete Buttigeig addressed the Chair’s Planary Session, focusing on evidence-based transportation investment, equity, and road safety in the context of the Bipartisan Infrastructure Law. And it turns out the same themes resonated with TRB goers eager to discuss how to take advantage of new data sources to maximize the impact of the “BIL.”
StreetLight’s team welcomed hundreds of TRB goers in booth 731, with Jim Hubbell, AICP and Thomas Grogan leading the charge on many of the presentations, discussions and product demos. We asked Jim and Thomas what resonated most at TRB, and here are the three big take-aways.
1. Housing Imbalance Boosts the Impact Potential of Equitable Transportation
The pandemic has spurred inflation and created all kinds of imbalances, with perhaps the most notable being record increases in housing and rental prices across the U.S., making the nation’s pre-pandemic housing imbalance even worse.
Cities from San Francisco to Kansas City aren’t waiting for affordable units to be built to solve the daily challenges handed to disadvantaged neighborhoods as a result – they’re using equitable transportation to get people to work, whether places of employment are local or across town.
Take Wyandotte County in Kansas. The county suffers from a lack of jobs in proximity to housing. It is also more racially diverse and has lower incomes than adjacent Johnson county. What if you could quickly gather Origin-Destination and demographic data to highlight transit options needed to get residents to work affordably? “With StreetLight InSight®, you can do just that,“ comments Jim Hubbell, “and it’s amazing how this simple analysis can get planners in just about any city to move quickly toward solutions, rather than spending weeks or months gathering data first.”
Many of our booth visitors came away energized by what’s possible, taking away ideas on how to apply this sort of data to enrich their BIL grant applications and driving change in their communities. Curious to learn more? See how the San Diego Association of Governments used StreetLight’s Demographic Metrics to analyze the social equity impact of a new project.
2. Safe Streets Post-Pandemic Need Data “Teeth” to Succeed
Work from home for office workers in every corner of North America has caused a “de-urbanization” in many large cities, shifting more than vehicle traffic to the suburbs: Many “bedroom communities” previously emptying out during the week are seeing their residents hit local streets.
Orlando, Florida is just one city seeing pedestrian traffic shift from downtown to uptown, with some of the city’s outer neighborhoods seeing more than 100% increase in pedestrian activity during the pandemic. But without adequate infrastructure to accommodate the new mobility patterns, these areas have seen fatal pedestrian crash rates skyrocket.
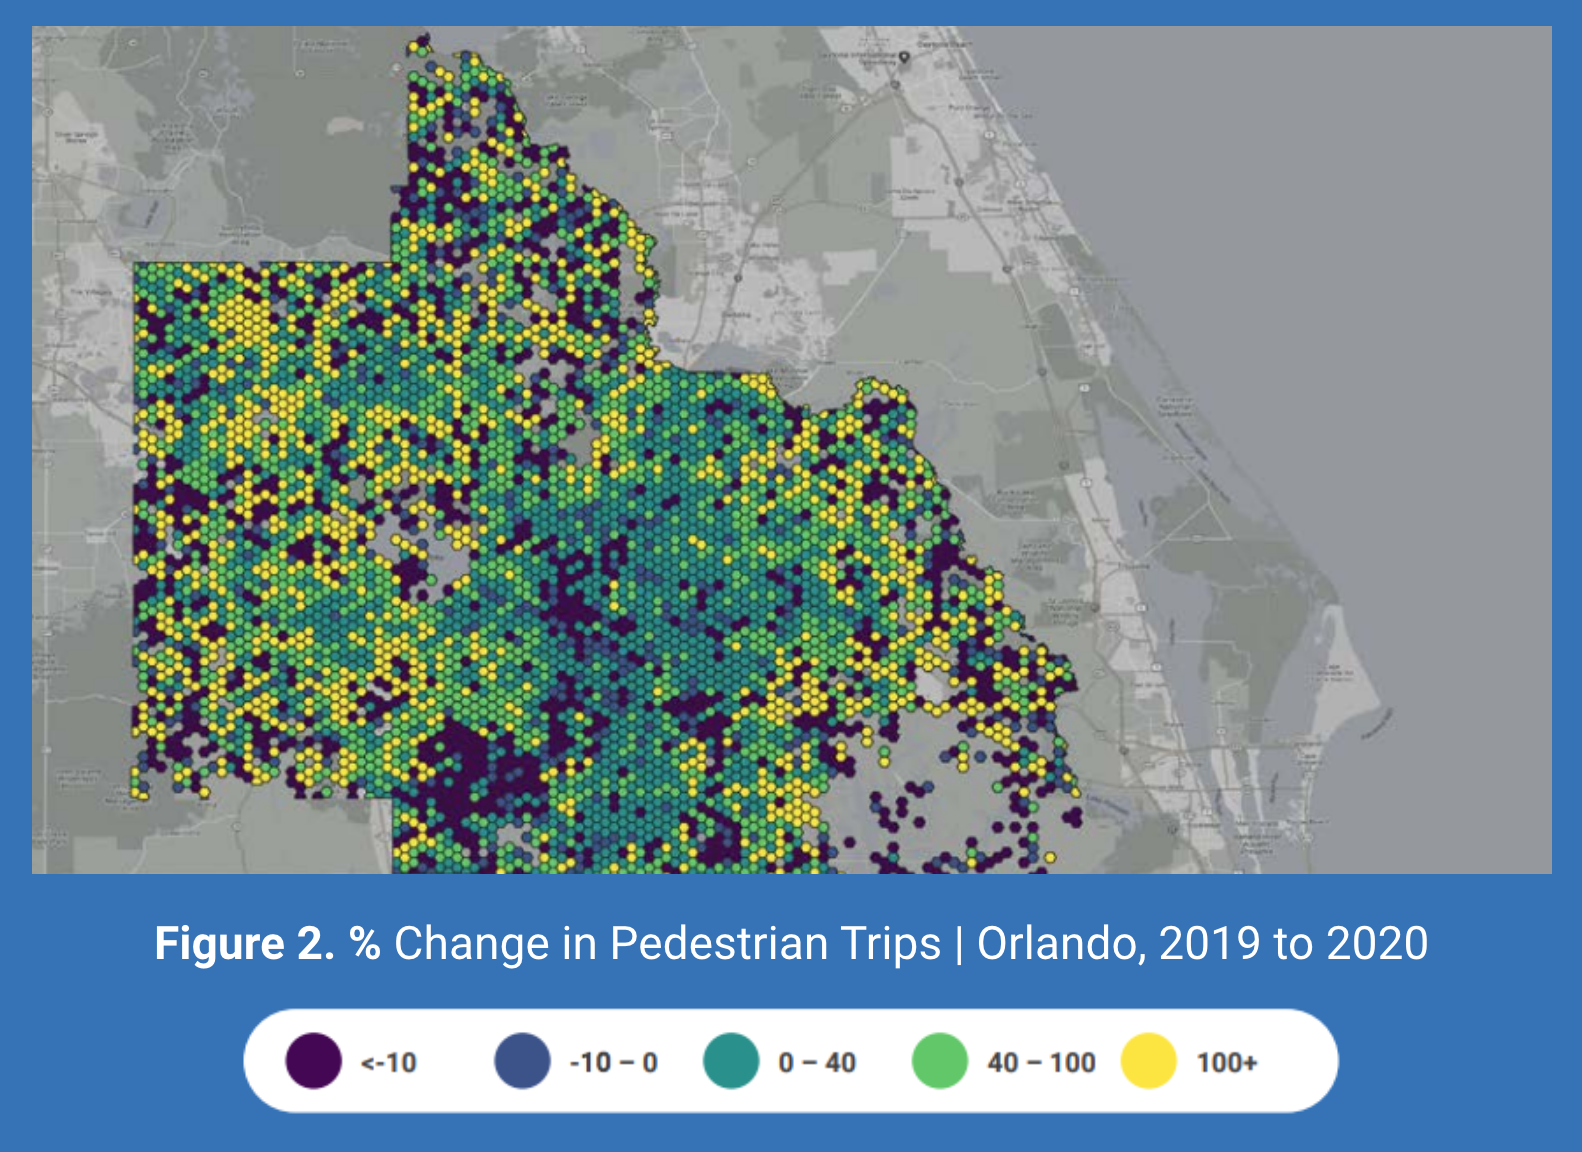
What if you could quickly scan your entire city to identify where people are walking now, diagnose crash exposure rates, and prioritize safety-geared infrastructure? With StreetLight InSight®, all this is possible in a matter of clicks, not weeks or months.
Curious to learn more? See how the City of Pittsburgh used StreetLight’s Bike and Pedestrian Metrics to identify areas most in need of safety improvements, and plan infrastructure changes to address it.
3. Solving “Range Anxiety” Among EV Enthusiasts Goes Beyond Better Batteries
The Biden administration’s goal is to increase the number of charging stations to 500,000. Currently, there are some 45,000 publicly available charging stations in the U.S. This implies more than 90% of EV charging capacity is yet to be built, but where are the most immediate gaps?
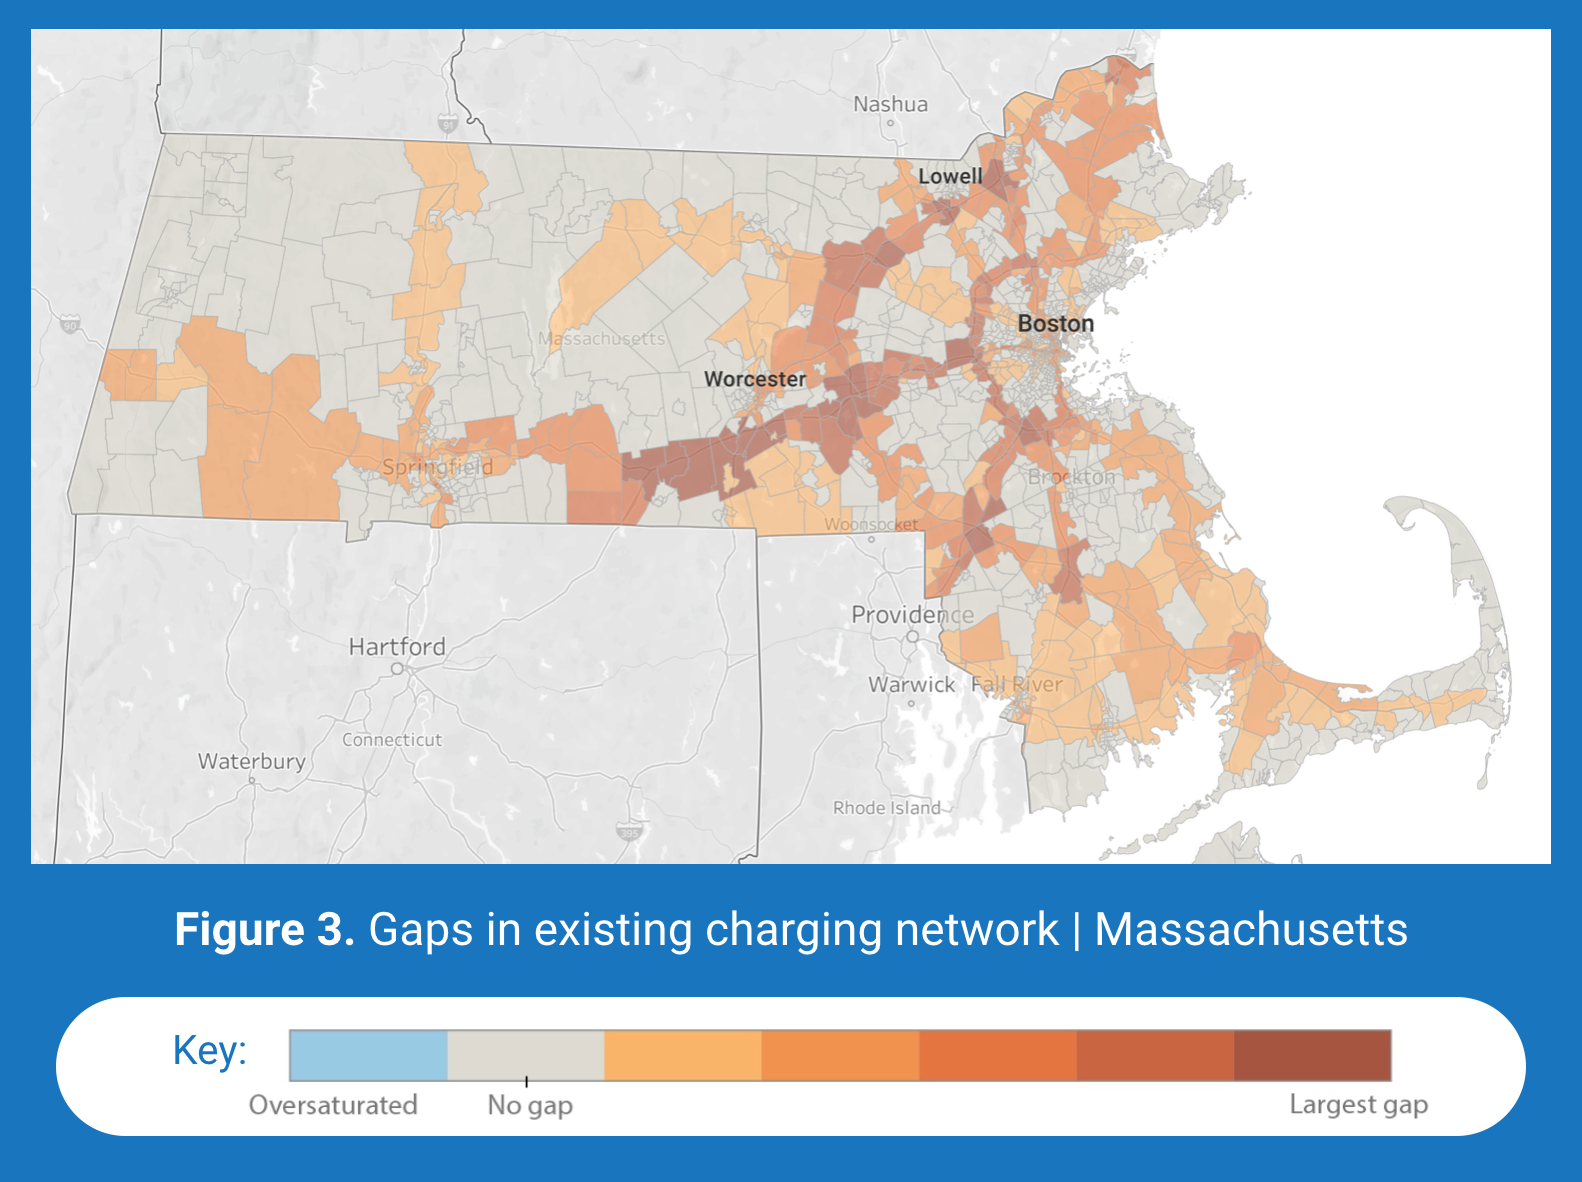
With “range anxiety” being a top concern among potential EV buyers, we used StreetLight’s EV dashboard to pinpoint locations lacking in rapid (Level 3) chargers in areas frequented by drivers making long trips. Zeroing in on the state of Massachusetts, we didn’t have to look far beyond the city of Boston to find gaps in the charger network.
It turns out that gaps exist in areas along the I-95 and I-495 rings that extend around Boston, as well as the I-90 corridor that runs east-west across the state. Figure 3 presents a heatmap, with some of the darkest areas on the map indicating the largest gaps around Worcester and Lowell.
What if you could survey an entire state’s EV readiness in a mere three clicks? Our EV dashboard does just that, demonstrating how data and analytics can guide decision-making about charging infrastructure. We invite you to sample the EV dashboard in your geographic area, and get a high-level view of gaps that might just be in your own backyard.Figure 1 Caption: Weekday traffic volume for 2019 (a) and 2020 (b).
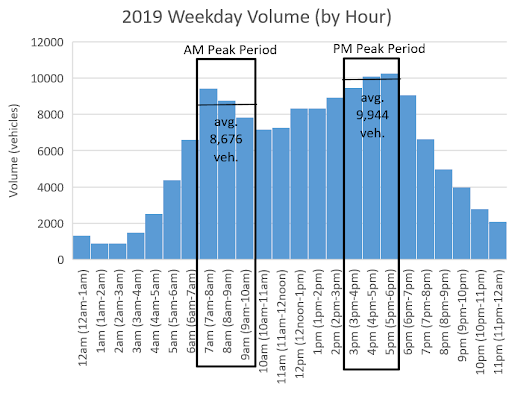
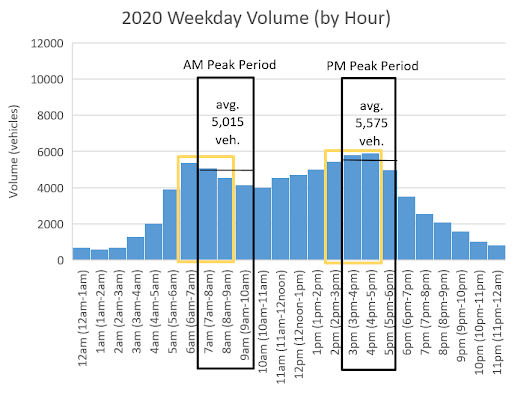
Figure 2 Caption:. Weekday traffic speed for 2019 (a) and 2020 (b).
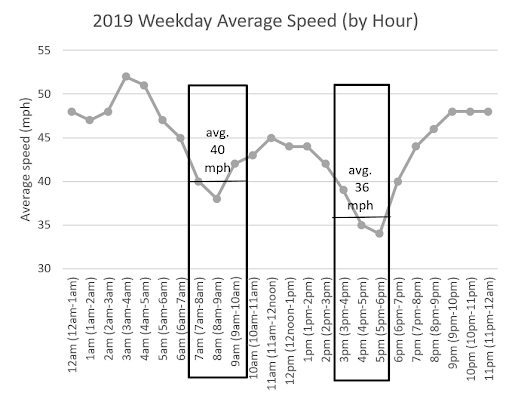
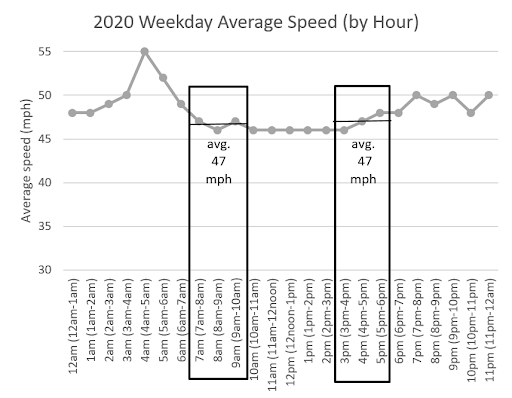
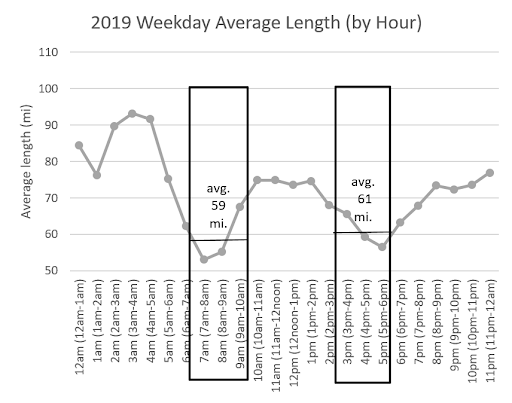
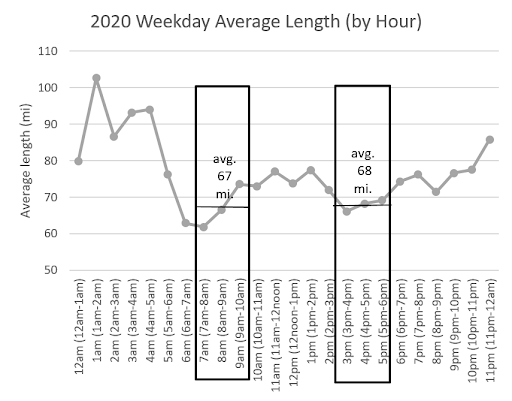
Most of the results, including increased peak-hour speeds and shorter travel times, were as expected, though StreetLight helped uncover the surprising conclusion that average trip length actually increased during COVID-19, despite drops in traffic congestion.
Analysis 2: Destination Zone
For the second part of this study, researchers analyzed traffic conditions on the UC Davis campus during high traffic periods (fall 2019) and lower traffic periods (summer 2019) to understand how traffic demands change during the academic year. Notably, a large portion of campus visitors travel by bike, so researchers compared bicycle traffic to car traffic.
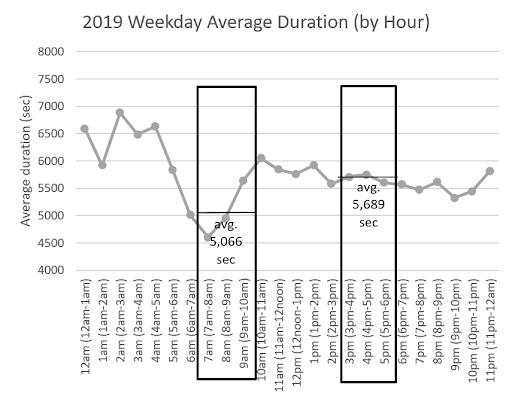
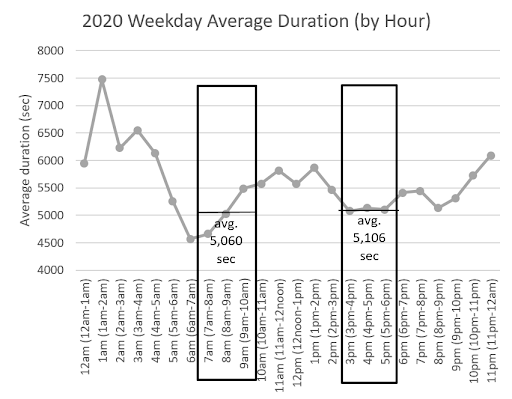
The analysis found mostly predictable results — for example, the largest average daily volume (ADV) for bikes and cars occurred on weekdays midday–and the overall ADV of bikes and cars was higher in the fall than the summer due to a larger share of workers and students on campus. The average trip lengths (ATL) of bike trips in the summer and in the fall were found to be nearly the same, while the ATL of car trips was higher in the summer than the fall, and generally higher for visitors than residents and workers.Figure 3 Caption: Weekday average trip duration for 2019 (a) and 2020 (b) and trip length for 2019 (c) and 2020 (d).
“Since obtaining accurate traffic counts was no longer feasible during COVID-19, StreetLight became the perfect tool to retroactively find traffic turning volumes.”
Nada Naffakh, Hanson Professional Services
Interestingly, StreetLight Metrics also helped to uncover that the larger share of trips to the UC Davis campus originate in Davis, despite the high costs of living in the area relative to surrounding towns and cities. The rest of the trips come from the cities of Sacramento, Winters, Dixon, and Woodland.
Conclusion
The findings collected in this UC Davis transportation survey course offered both a snapshot of important campus traffic trends and a valuable training in the use of Big Data within academic research. Oftentimes, college campuses can be leveraged as small-scale “testbeds” for research that can later be applied to larger cities and regions, making them a prime environment to explore tools like the StreetLight InSight® platform.
StreetLight is proud to offer numerous resources that support academic research in the areas of transportation planning, COVID impacts, climate change, health, and more. By introducing future transportation experts to the many applications of big data, we can strengthen the foundation of our work as a sector and continue driving meaningful change on our streets.
“Being an engineer I have always used Streetlight for turning movement counts. Your new feature makes it much easier! Streetlight saves painstaking data collection in the field.”
David Pulay, PE, Akron Metropolitan Area Transportation Study
Our TMC Metrics have been tested and validated, returning a very strong R2 correlation of .95 with physical sensors. Watch our short demo video to learn how StreetLight’s TMC Metric can support your transportation work.