
Traffic ReLAXed: The Effects of COVID-19 on Car Travel at Los Angeles International Airport

When the COVID-19 pandemic upended the world’s travel activity in 2020, no transportation systems felt the effects more acutely than airports and airlines. Los Angeles International Airport (LAX), which ranked as the busiest origin-destination airport in the world prior to the pandemic, saw a staggering 96% drop in passengers in April 2020 as compared with the year prior.
The drop in traffic (both airplane and vehicle) came amid the airport’s efforts to modernize its landside-access offerings for the first time in decades. Pre-pandemic congestion in the central horseshoe roadway—a two-level structure that connects the airport’s eight terminal buildings in an oval around the Central Terminal Area (CTA) known officially as World Way—was legendary, but COVID-related shutdowns and passenger decreases caused that congestion to evaporate. What remained told a different story: that of baseline operations needed to keep the airport operational.
As part of the Travel Survey Design and Data Collection Methods course taught by Professor Giovanni Circella at UC Davis, visiting students Samuel Speroni and Fariba Siddiq of UCLA used StreetLight Data to examine the vehicular traffic that accessed LAX before the COVID-19 pandemic (April 2019) and during the pandemic-related stay-at-home orders (April 2020).During each time period, the team conducted a Zone Activity analysis within a pass-through zone polygon to capture all entering and re-entering vehicle volumes on both decks of the World Way roadway. They used this data to analyze the differences in overall composition of trip attributes and traveler characteristics between 2019 and 2020, and the changes in how these varied based on day of the week in both time periods.
Goodbye to LAX’s Notorious Vehicle Gridlock
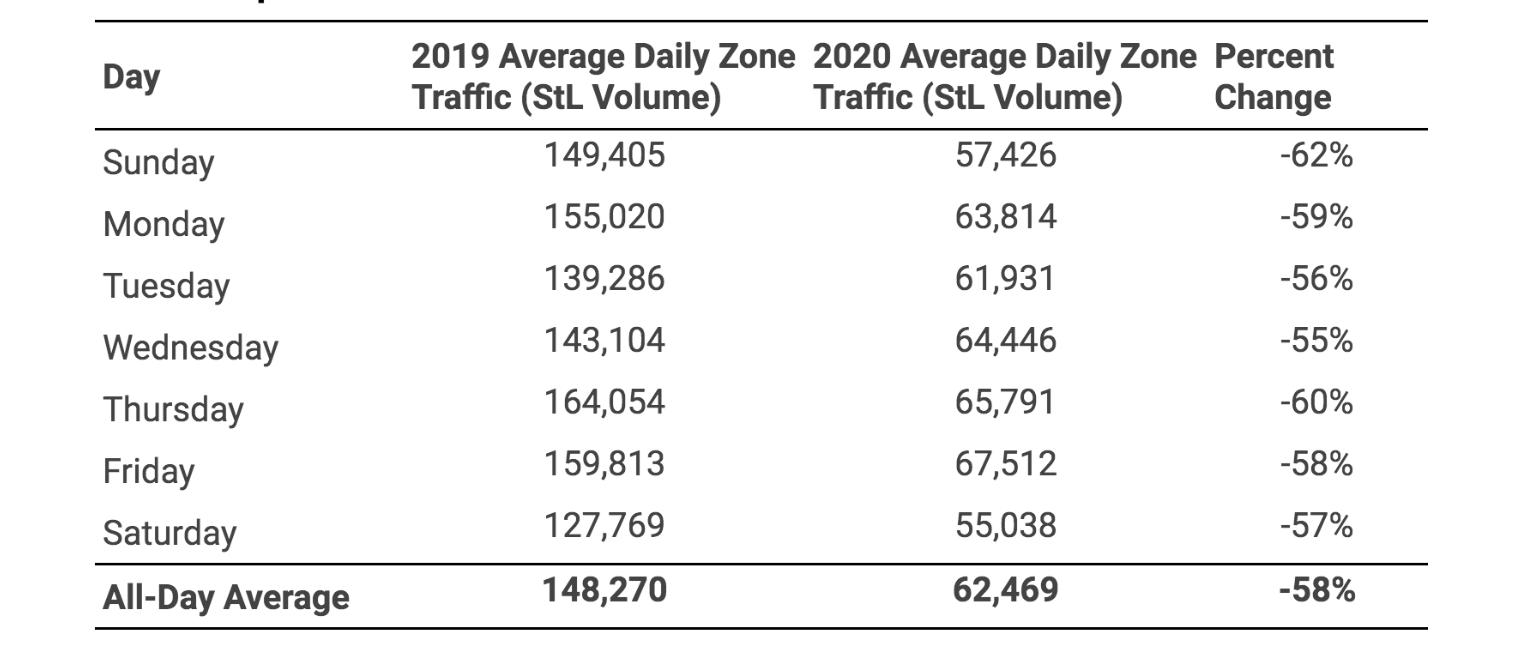
Using StreetLight’s Zone Activity analysis, the team found overall vehicle traffic entering the LAX Central Terminal Area dropped by 58% between April 2019 and April 2020. On all days of the week, the vehicle volumes entering the CTA decreased dramatically (as shown in Exhibit 1), while variation across the days of the week was minimal.
Exhibit 1: Average Vehicle Traffic at LAX Central Terminal Area by Day of Week, April 2019 versus April 2020
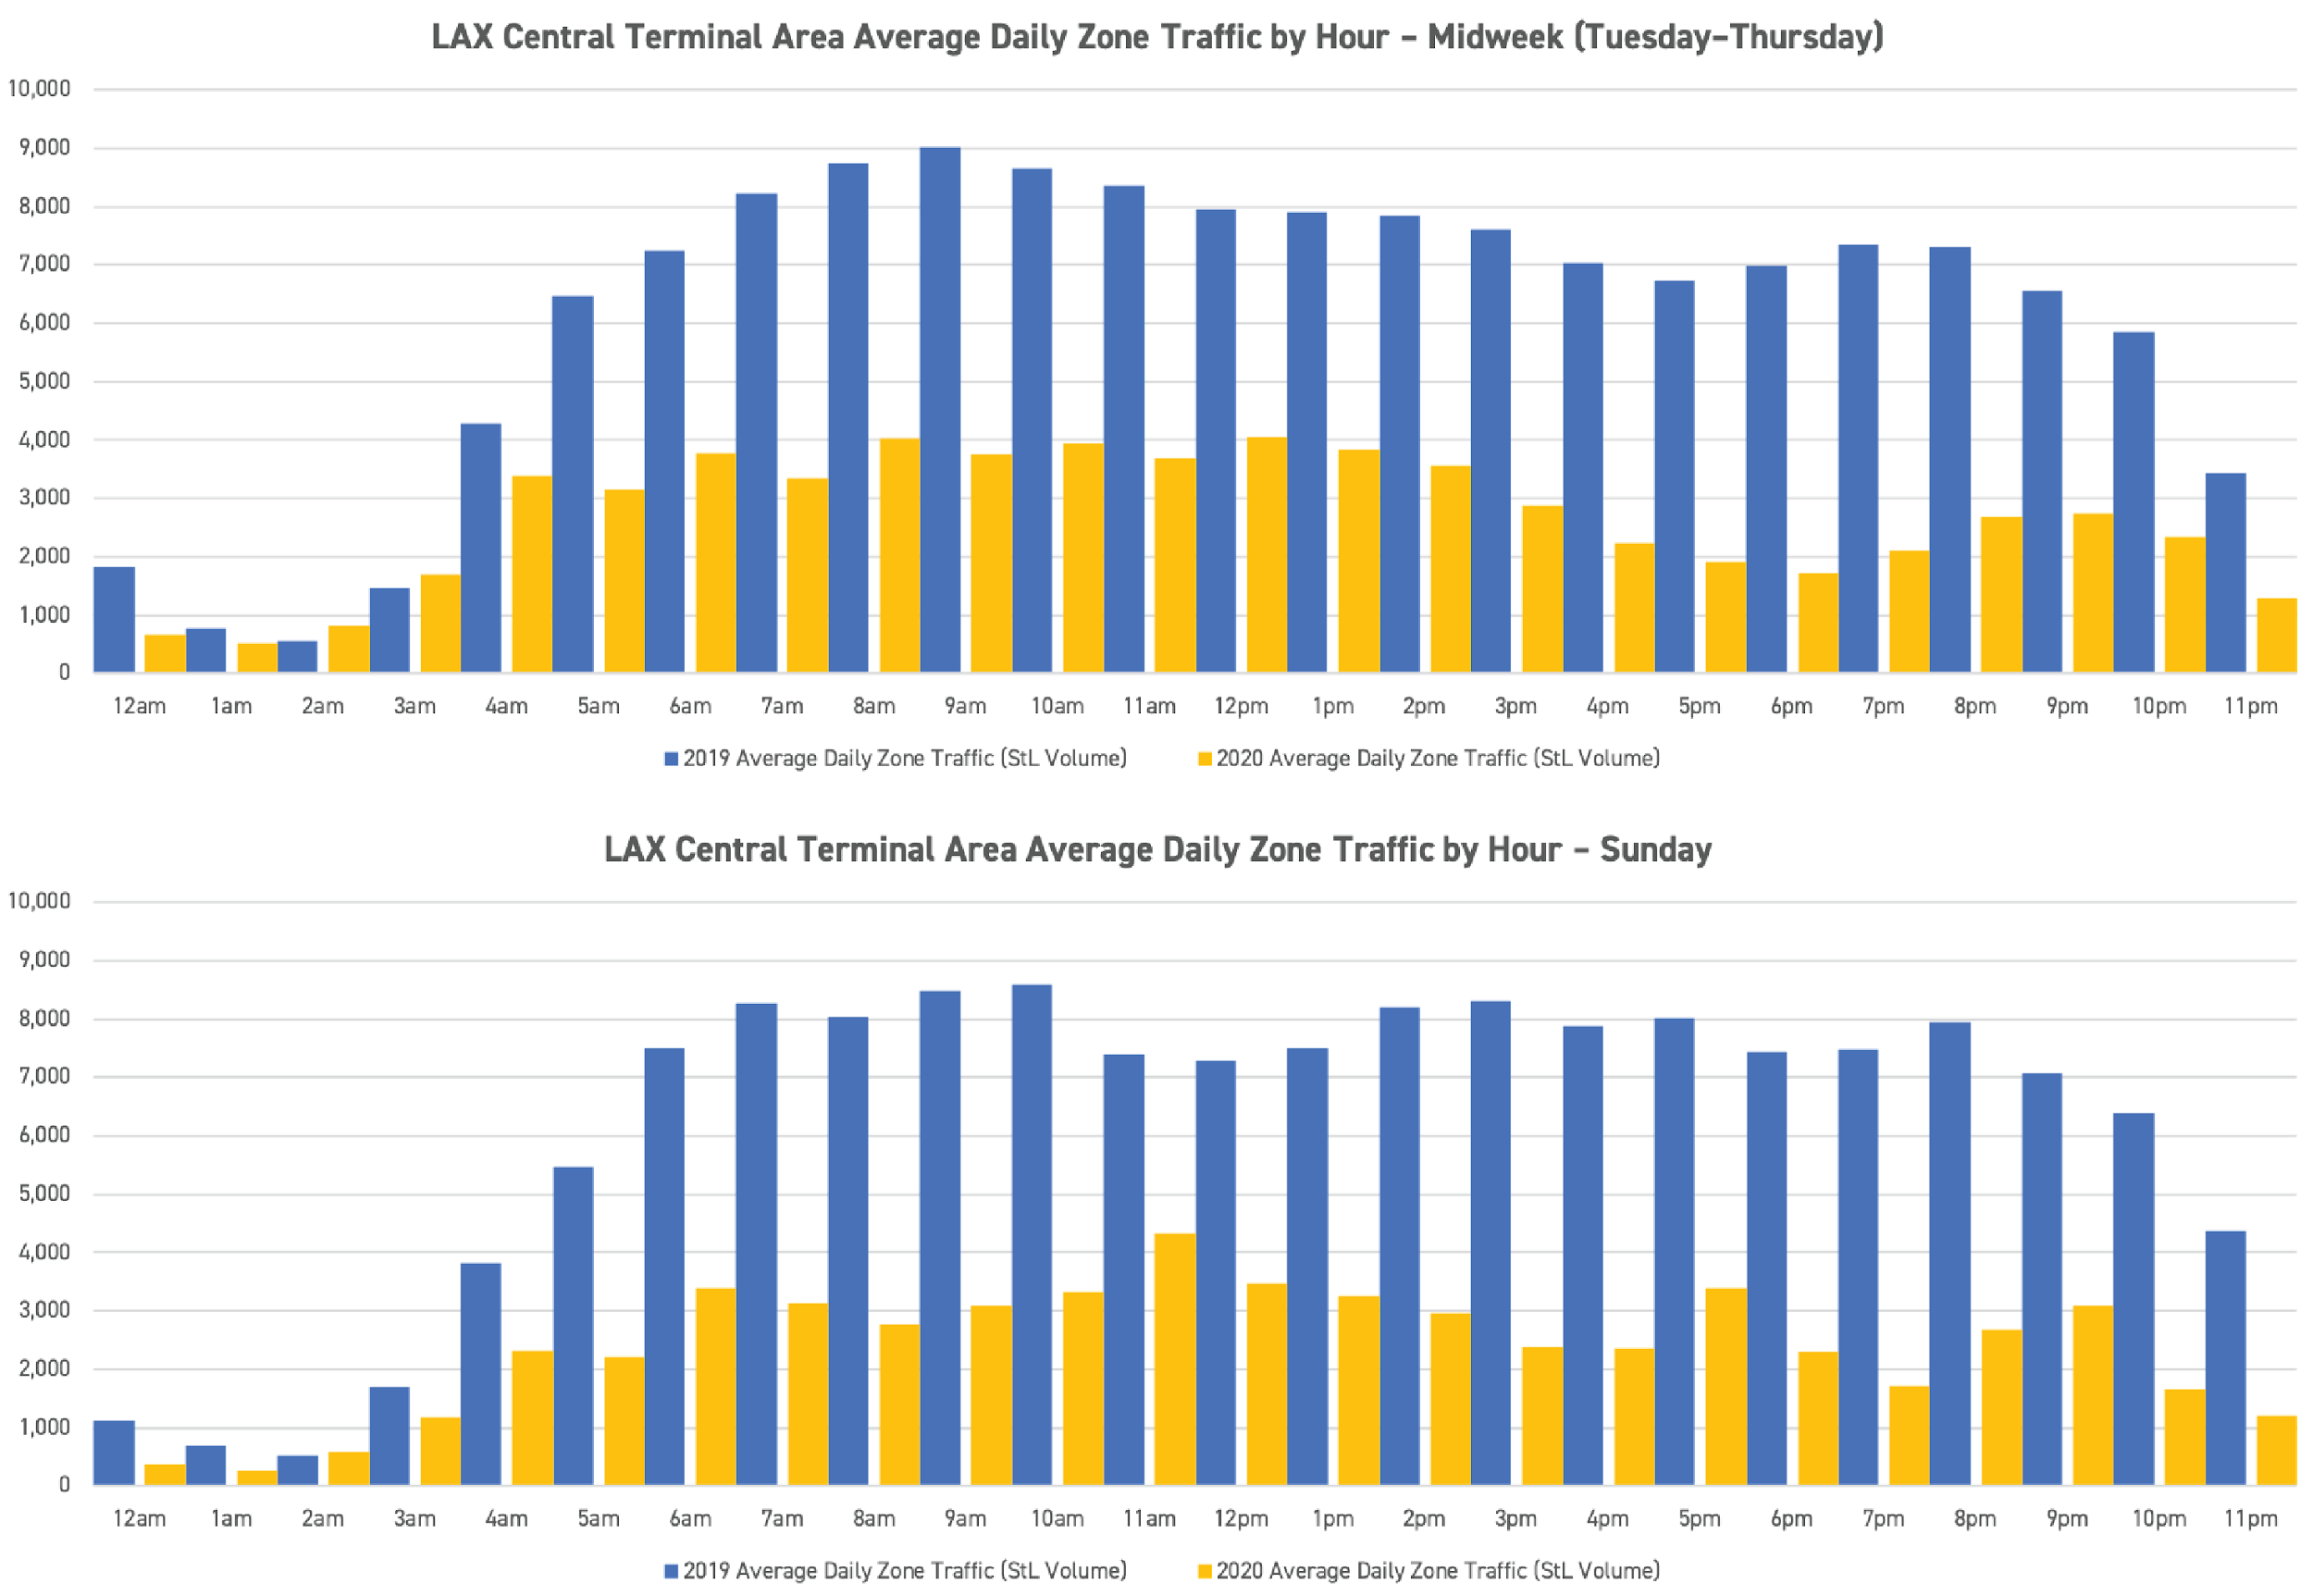
The variability in traffic volumes across the hours also leveled off. While April 2019 volumes typically peaked at 9 AM with around 9,000 vehicles, there were no discernible peaks in April 2020. (Exhibit 2 shows how these hourly volumes are distributed throughout the day.)Exhibit 2: Hourly Distribution of CTA Average Daily Vehicle Volumes via StreetLight, April 2020
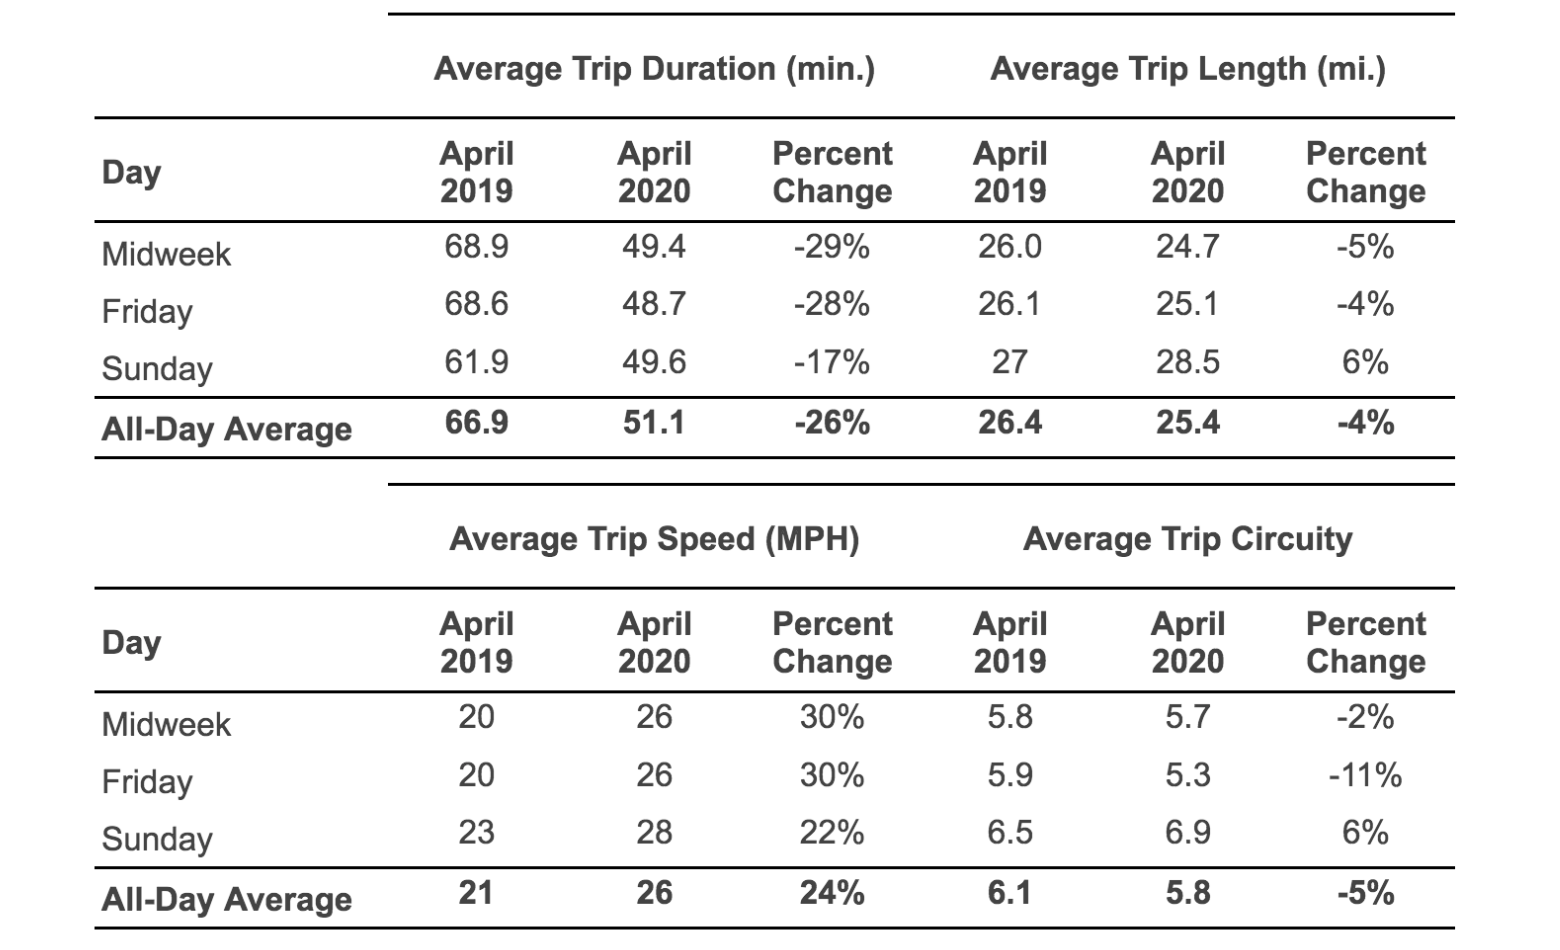
Trip characteristics generally fall in line with prevailing logic in comparing the pre-pandemic and early-pandemic periods: trip durations dropped dramatically, trip distances trended slightly down, trip speeds went up substantially, and trip circuity generally went down.Most of the results, including increased peak-hour speeds and shorter travel times, were as expected, though StreetLight helped uncover the surprising conclusion that average trip length actually increased during COVID-19, despite drops in traffic congestion.
Analysis 2: Destination Zone
For the second part of this study, researchers analyzed traffic conditions on the UC Davis campus during high traffic periods (fall 2019) and lower traffic periods (summer 2019) to understand how traffic demands change during the academic year. Notably, a large portion of campus visitors travel by bike, so researchers compared bicycle traffic to car traffic.
The analysis found mostly predictable results — for example, the largest average daily volume (ADV) for bikes and cars occurred on weekdays midday–and the overall ADV of bikes and cars was higher in the fall than the summer due to a larger share of workers and students on campus. The average trip lengths (ATL) of bike trips in the summer and in the fall were found to be nearly the same, while the ATL of car trips was higher in the summer than the fall, and generally higher for visitors than residents and workers.
However, these characteristics trend differently when they compare weekday data with Sunday data, as detailed in Exhibit 3. While trip duration dropped by nearly 30% on most days of the week, it dropped by an average of only 17% on Sundays. Trip speed dovetails with trip duration: weekday speeds jumped up by about 30%, while Sunday speeds saw only a 22% jump. Trip length and trip circuity tended to change rather analogously, for the most part, though circuity saw a much more pronounced reduction on Fridays. The UC Davis team hypothesizes that this is the result of intense pre-pandemic traffic congestion on Fridays from both worker commutes and weekend social activities, leading to more (although still relatively few) drivers diverting onto local streets.Exhibit 3: Comparison of Trip Characteristics, 2019 to 2020
“Since obtaining accurate traffic counts was no longer feasible during COVID-19, StreetLight became the perfect tool to retroactively find traffic turning volumes.”
Nada Naffakh, Hanson Professional Services
Identifying the COVID-era Traveler
While these changes in CTA roadway volumes between April 2019 and April 2020 were undoubtedly dramatic, they notably paled in comparison to the changes in air passenger traffic volume at LAX over that same time period. LAX experienced a 96% decrease across all passenger types in April 2020 compared with April 2019, as less than 10,000 passengers per day boarded airplanes at LAX in April 2020.
By comparing this figure with the daily averages for the StreetLight analyses over these same time periods, they discovered that the roadway saw approximately six times the amount of vehicles in April 2020 as the airport had passengers (Exhibit 4).Exhibit 4: Comparison of Average Daily Air Traffic and Roadway Traffic at LAX, 2019 to 2020
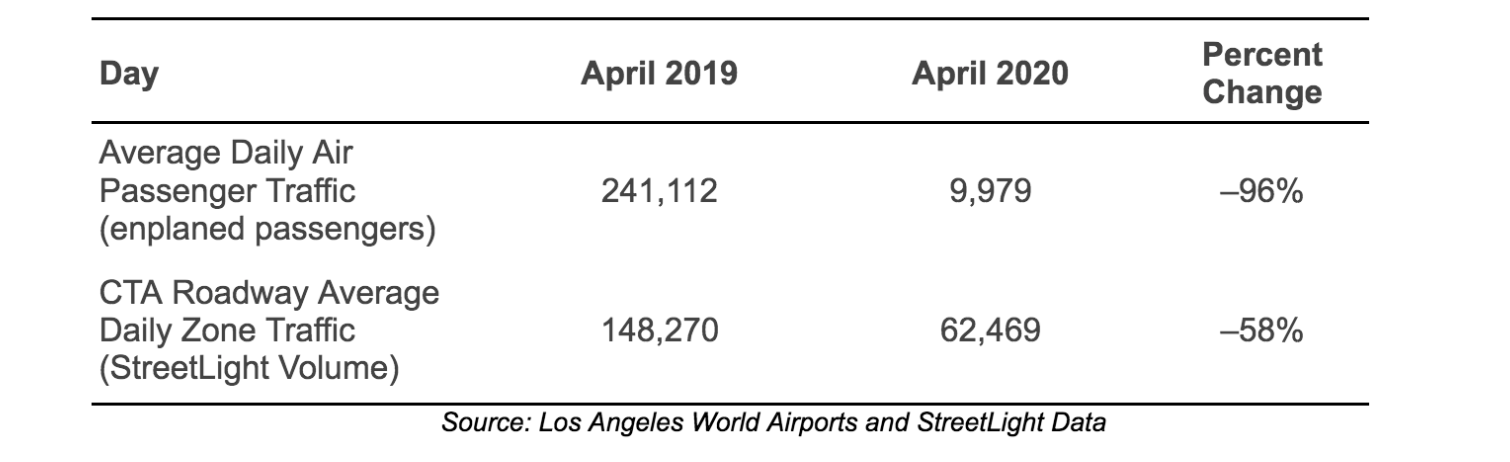
There are three potential explanations that could contribute to this striking difference. First, it is possible that many of these vehicles entering the CTA are driven by employees. Second, fixed-route vehicles including hotel or rental car shuttles continued to operate amid the pandemic, thus StreetLight counted those vehicles despite the possible absence of any passengers. Third, the reduced traffic volumes allow for more free-flowing traffic, which would no longer impede drivers from circling the CTA while waiting for passengers to exit the airport for pick up, resulting in repeated counts by our gateway polygon as they circled.
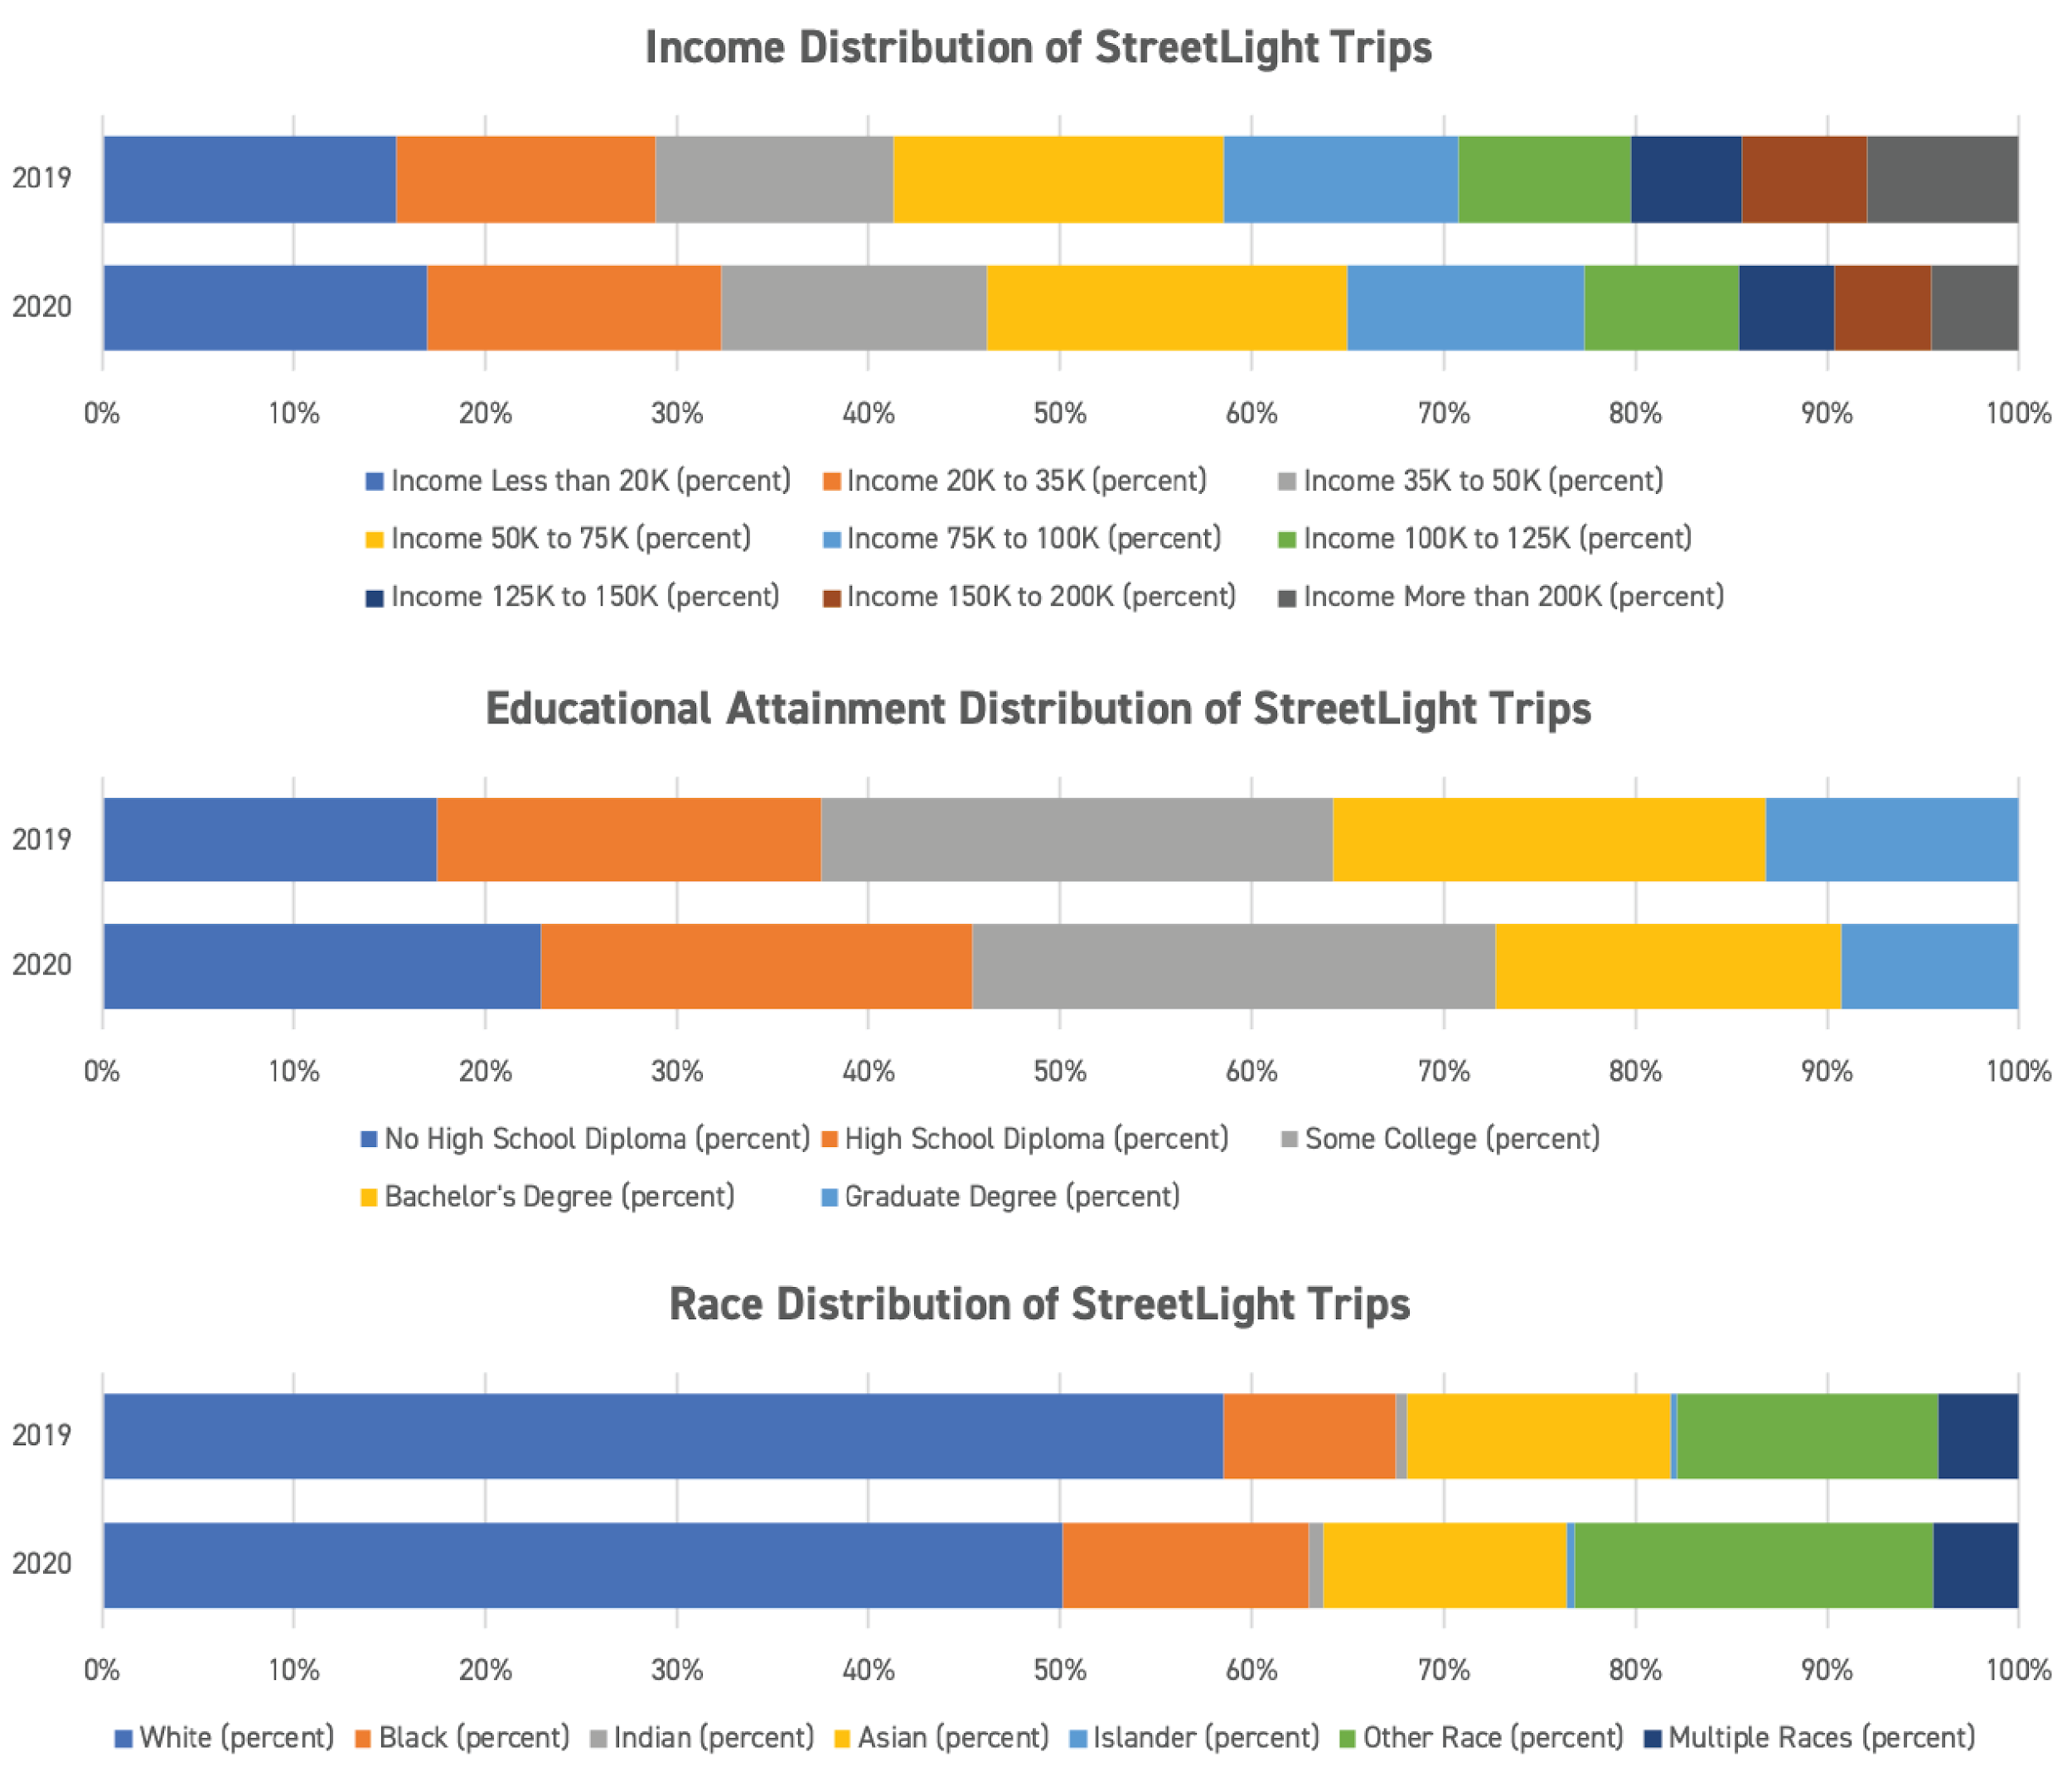
StreetLight Data also helped to uncover interesting insights on traveler demographics. Through their analysis, the UC Davis team found the CTA drew fewer wealthy people, fewer white people, and fewer highly-educated people in April 2020 as compared with a year prior. While none of these variables showed dramatic or striking differences year-over-year, all showed a clear skew. This finding generally aligns with other analyses regarding access to remote work opportunities. Those who work from home tend to be wealthier, whiter, and more educated — the very people traveling relatively less into the LAX CTA (see Exhibit 5).Exhibit 5: Traveler Socio-demographic Traits by Percentage of Total Trips, April 2019 and April 2020
Lessons from LAX
Through the help of StreetLight Data, our team gained a better understanding of not only the analysis’ central research question—how have CTA traffic volumes and characteristics changed from April 2019 to April 2020—but also the trends that may have impacted broader airport and airline travel, such as behavioral disparities based on demographics.
It’s impossible to predict exactly what events may upend travel behaviors, but through data collection and thoughtful analysis, we can work toward shifting travel behaviors and preparing the solutions that can curb traffic challenges before they arise.
StreetLight is proud to offer numerous resources that support academic research in the areas of transportation planning, COVID impacts, climate change, health, and more. By introducing future transportation experts to the many applications of big data, we can strengthen the foundation of our work as a sector and continue driving meaningful change on our streets. Get in touch with us if you would like access to StreetLight for your classroom.
“Being an engineer I have always used Streetlight for turning movement counts. Your new feature makes it much easier! Streetlight saves painstaking data collection in the field.”
David Pulay, PE, Akron Metropolitan Area Transportation Study
Our TMC Metrics have been tested and validated, returning a very strong R2 correlation of .95 with physical sensors. Watch our short demo video to learn how StreetLight’s TMC Metric can support your transportation work.