Category: Performance Studies
Commutes Across America – Where are the Longest Trips to Work? Part 2

Commutes Across America – Where are the Longest Trips to Work? Part 2
After a long day at work, you probably want to get home as soon as possible. But, on most days, that’s easier said than done.
Today, commutes across America are longer than ever – and they’re increasing. The average American commutes 52 minutes to work each day, for a total of 4 hours and 20 minutes per week. Think of all the productive ways you could be spending that time, rather than sitting in your car or crammed in a crowded subway.
In our last blog about commutes, we explored where some of the longest commutes to work are in America. Now, let’s learn more about why areas have long commutes and how Big Data can be used by transportation planners to help mitigate this problem
Why Some Commutes Across America Are So Long
So, why are commutes to work long? There are a number of factors. First, there are large population concentrations in the suburbs. As the cost of living in city centers increases, people relocate to the suburbs, which means they often have to commute into the city for the best jobs.
Next, due to urban and suburban development, construction is a regular feature of many people’s daily commute. Doesn’t it seem like there’s always something under construction in your area? Because commutes are increasing, roads need to be reconfigured to accommodate more people. And, there’s the regular construction to upkeep roads, too.
Solo commuting plays a role, as well. Most commuters today don’t carpool, choosing the freedom that comes with driving their own car to or from work. Over 90% of trips to work happen in cars, which equates to more cars on the road and slower commutes.
How Data is Collected
Each minute, millions of mobile devices collect data points that can hold valuable insights for transportation companies or urban planners. But, this raw data collected from phones, tablets, or GPS devices can be hard to translate into actionable transportation plans. So, you need a partner like StreetLight Data to help. StreetLight Data is a technology company that transforms Big Data from mobile devices into actionable analytics for transportation infrastructure and policy planning.
Using a solution like StreetLight Data’s StreetLight InSight® platform helps because it collects and condenses all of the data resources alongside processing software in one easy-to-use tool. You save time by not going out and finding the best Big Data resources yourself from different vendors, or by trying to organize and analyze data yourself outside of a proven framework.
Once the raw data is collected, it’s processed and presented as a number of different, customizable and insightful analytics to users. These analytics includes:
- Origin-Destination Matrices
- Traffic Diagnostics
- Corridor Studies
- Trip Purpose
- Demographics
- Average Travel Times and Travel Time Distributions
- 2016 AADT (Average Annual Daily Traffic)
- Commercial Truck Studies
How Data Helps Shorten Commutes
While the data collection process may seem intricate, the results it produces can be applied to a number of different transportation modeling, forecasting, and planning activities. And these activities can help you design better project and policy solutions that reduce – or even eliminate – long commutes for citizens. These include:
- Creating and calibrating travel demand models
- Evaluating before-and-after studies to determine project impact
- Prioritizing tasks and creating cost/benefit analyses for projects
- Busting congestion
- Routing detours
- Designing, expanding, and analyzing public transit systems
- Changing toll systems and signals
- Employer incentive programs
- Acting as supporting materials for public meetings and communications
Each of these transportation projects could help improve commutes in your area and shorten the drive for millions of Americans. With the right data insights, you can pinpoint exactly where problem areas are, the factors behind those problems, and the solutions that can help address these issues.
The Road to Becoming a Transportation Rockstar
Transportation data can be used by a number of transportation professionals, both in the public and private sectors. Here’s how data ensure you and your team successfully shortens traveling commutes.
How Transportation Planning Consultants Can Improve Projects Using Big Data
The success of private transportation firms is dependent on completing projects effectively and efficiently. With transportation analytics, you have the insight needed to properly plan and execute your projects. You’ll also be able to find creative solutions that could act as a competitive advantage over other firms bidding for the same projects. Plus, data can provide insights to show the return on an investment in your projects, like how building toll roads can shorten commutes.
How Public Sector Planners Can Improve Commutes for the Community
No community is like your community. Big Data helps you find the precise solutions you need to shorten traveling commutes, like improving your public transit system and first-mile/last-mile solutions, implementing new carpooling programs, and designing active transportation infrastructure.
One concern you may have as an urban planner is that the steps you take to improve commutes might not solve the problem. In the past, without data in your corner, this was a definite possibility. Today, when you use data, however, you can mitigate that risk by being sure of the factors that impact commutes. Even better, you can easily measure project performance as you implement different solutions and adjust your strategy to optimize results.
What the Government Can Gain by Using Big Data for Commutes Across America
For the federal government, data is essential for comparing commutes nationwide. This helps the government pinpoint areas that might need more federal funding for road projects or to improve public transit systems.
Data is also beneficial when it comes to nationwide initiatives. For example, the U.S. Green Building Council was able to use Big Data for transportation to better characterize commute distances.
If you’re ready to cut down on commutes in your community, it’s time to turn to Big Data. Get the analytics you need to understand the factors behind long commutes in your area and develop effective strategies to address these challenges. With StreetLight Data on your side, you’re sure to translate Big Data analytics into performance-driven results.
Commutes Across America – Where are the Longest Trips to Work? Part 1
Commutes Across America – Where are the Longest Trips to Work? Part 1
Are you tired of the long drive to and from work? This is probably the most tiresome, frustrating part of your day. And, you’re not alone. Everyone on the roadway probably feels the same!
To better understand commutes across America, StreetLight Data has compiled information on where commutes are the longest. Explore this article to find out why it’s important to understand commute travel patterns and to discover the top five states and cities with the longest commutes.
4 Reasons Why Understanding Commutes Matters
1. Commutes Impact Happiness and Health
As you sit in your car during your commute to or from work, you probably feel frustrated and stressed. Aside from being an inconvenience, a long commute could actually impact your health and happiness, too.
First, it’s important to note that the average American professional spends about 52 minutes commuting each day, according to the U.S. Census. That’s a lot of time that could be spent in better, more productive ways. You could be with your family, or even getting more work done. Instead, you’re commuting.
Next, let’s look at the impact of commutes on your health. According to a study in the American Journal of Preventative Medicine, commutes longer than ten miles have negative impacts on cardiovascular health. “The study found that people who drove longer distances to work reported less frequent participation in moderate to vigorous physical activity and decreased CRF (cardiorespiratory fitness), and had greater BMI (body mass index), waist circumference, and blood pressure.”
Finally, your happiness is at stake, too. In another study from National Geographic fellow Dan Buettner, it was reported that “if you can cut an hour-long commute each way out of your life, it’s the [happiness] equivalent of making up an extra $40,000 a year if you’re at the $50- to $60,000 level.” While a longer commute for a certain job may add more money to your bank account, it also reduces happiness from your life.
2. Commutes Contribute to Economic Inequality
Why do people drive so far to work? Many people commute just to have a job or to have a job that pays well. Others commute from suburban areas with lower costs of living to urban areas with more business and greater job opportunities.
So, how does this perpetuate economic inequality? Commutes cost money and time. If workers are expected to travel 20+ miles every day to get to work, that might not be a sustainable lifestyle. By looking at commute data, governments can step in and take action to close the accessibility gap.
3. Commutes Have an Environmental Impact
The longer you’re in your car during a commute, the more carbon dioxide your vehicle is emitting into the air. In fact, motor vehicles emit 20 pounds of carbon dioxide per gallon of gas burned. That translates into a national average of 5.5 tons of carbon dioxide emission a year for every motorist. Those emissions have a huge impact on the environment.
While there are options to cut down on the environmental impacts of commuting, like carpooling, telecommuting, or public transit, most people – 77% of motorists – still drive alone to work. And, work-related driving is responsible for nearly 30% of miles traveled in a vehicle. To cut down on those numbers, transportation planners need a better understanding of what commutes across America look like.
4. Commutes Should be Put in Context
Finally, it’s important to understand your community’s commute in context. How does your area stack up against other states and cities? Answering this question helps two groups. First, it’s crucial information for urban planners. When urban planners understand their community’s commute in context, they’re better able to identify what changes need to be made, and where they’re doing things right. Looking at similarly sized cities can reveal alternative transportation methods that could work in your own city.
Understanding commutes to work in context can also help workers make informed decisions for the future. While everyone feels like their commute is unbearable, the number might show that it could be worse. If your commute is better than those around you, you might stay at your job longer. If your commute is longer than your average commute, you might begin searching for a new job closer to home.
Commutes Compared: States and Cities
Now that you have a better understanding of why we think researching data on traveling commutes is important, let’s look at the states and cities whose drivers commute the longest distances.
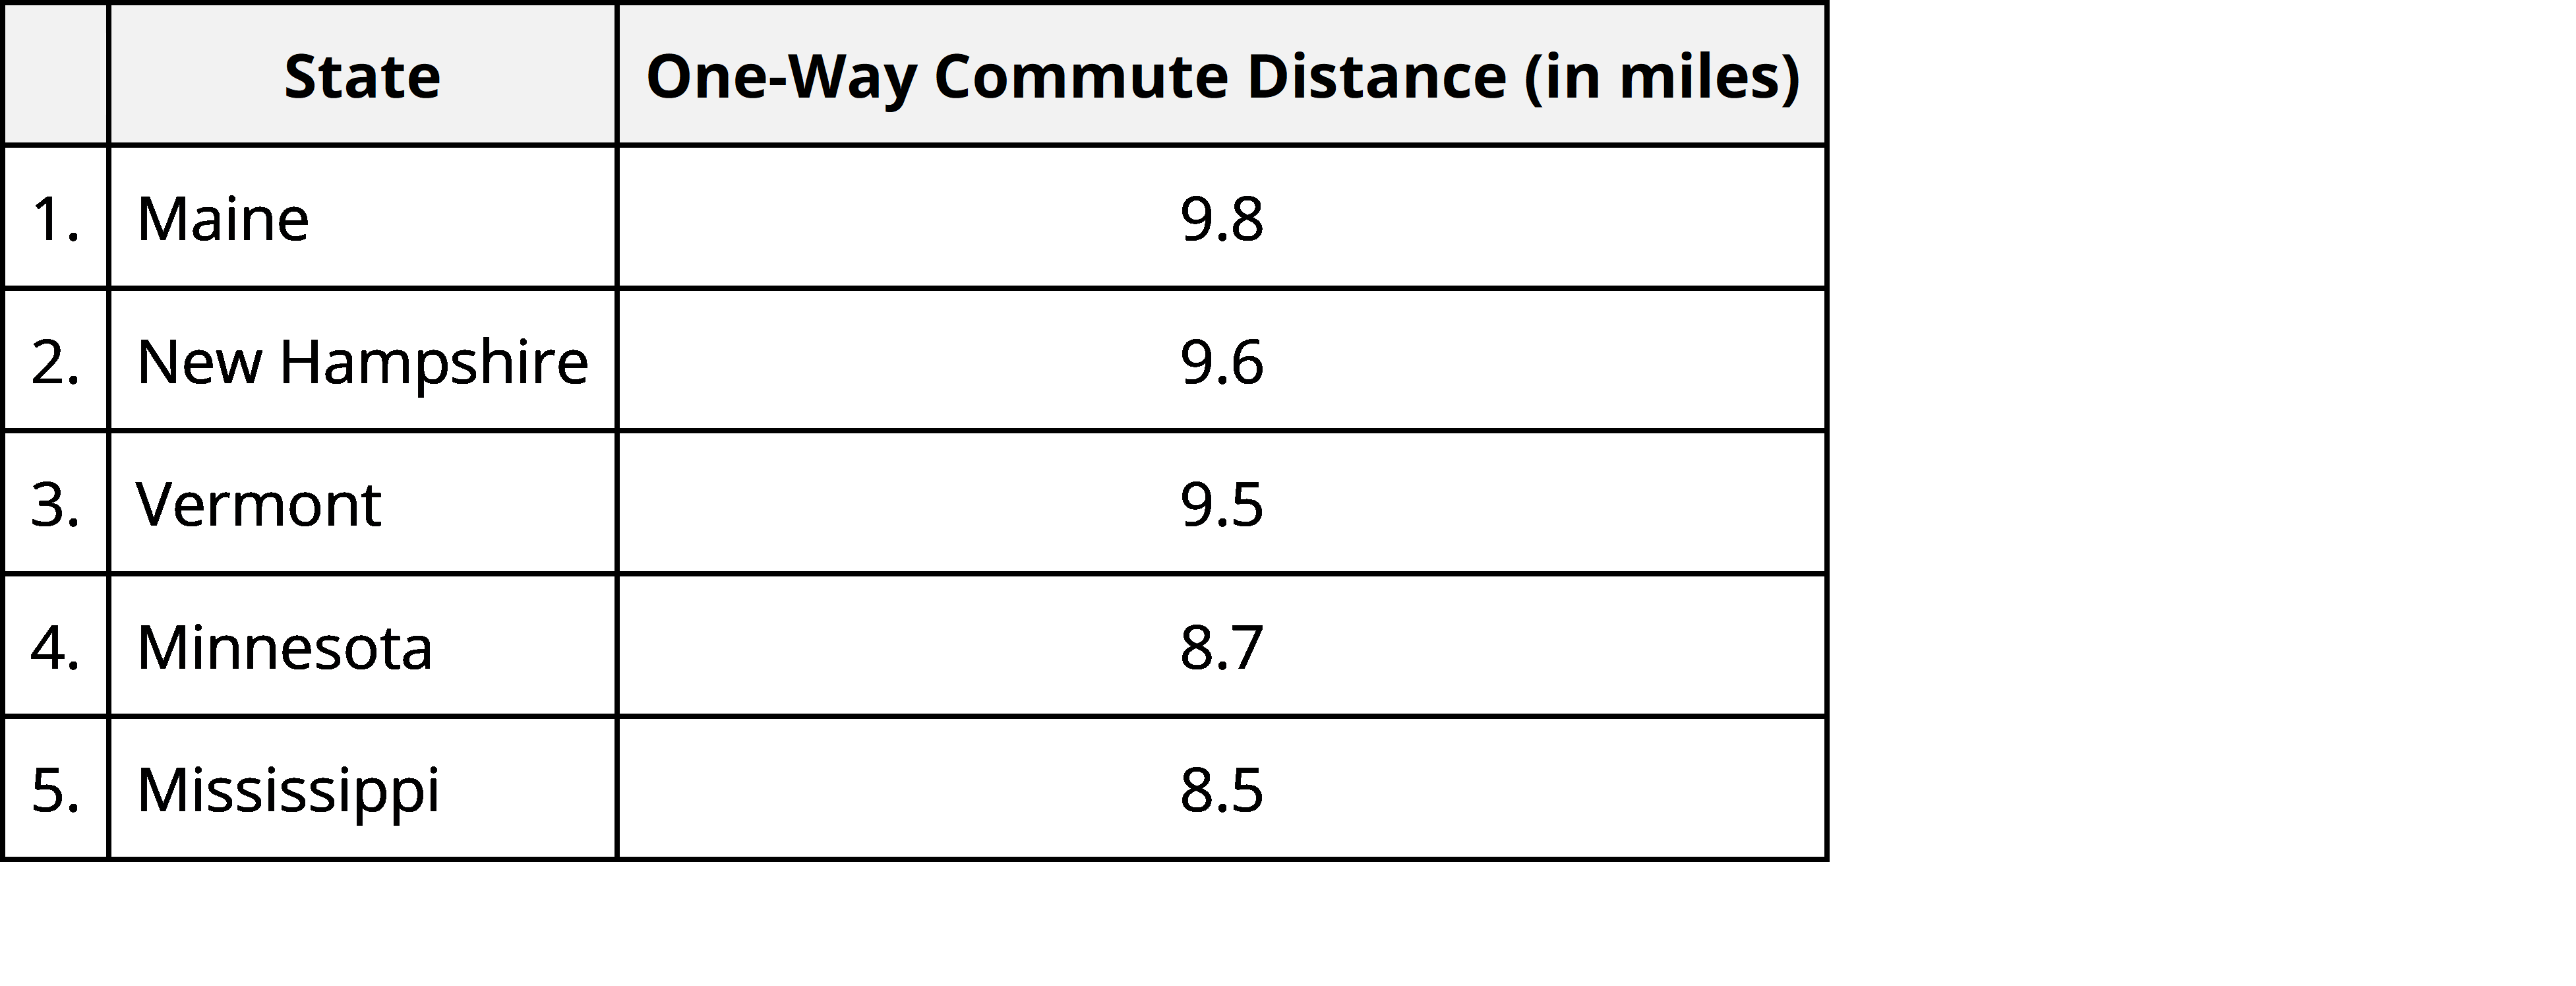
Top 5 States with the Longest Commutes
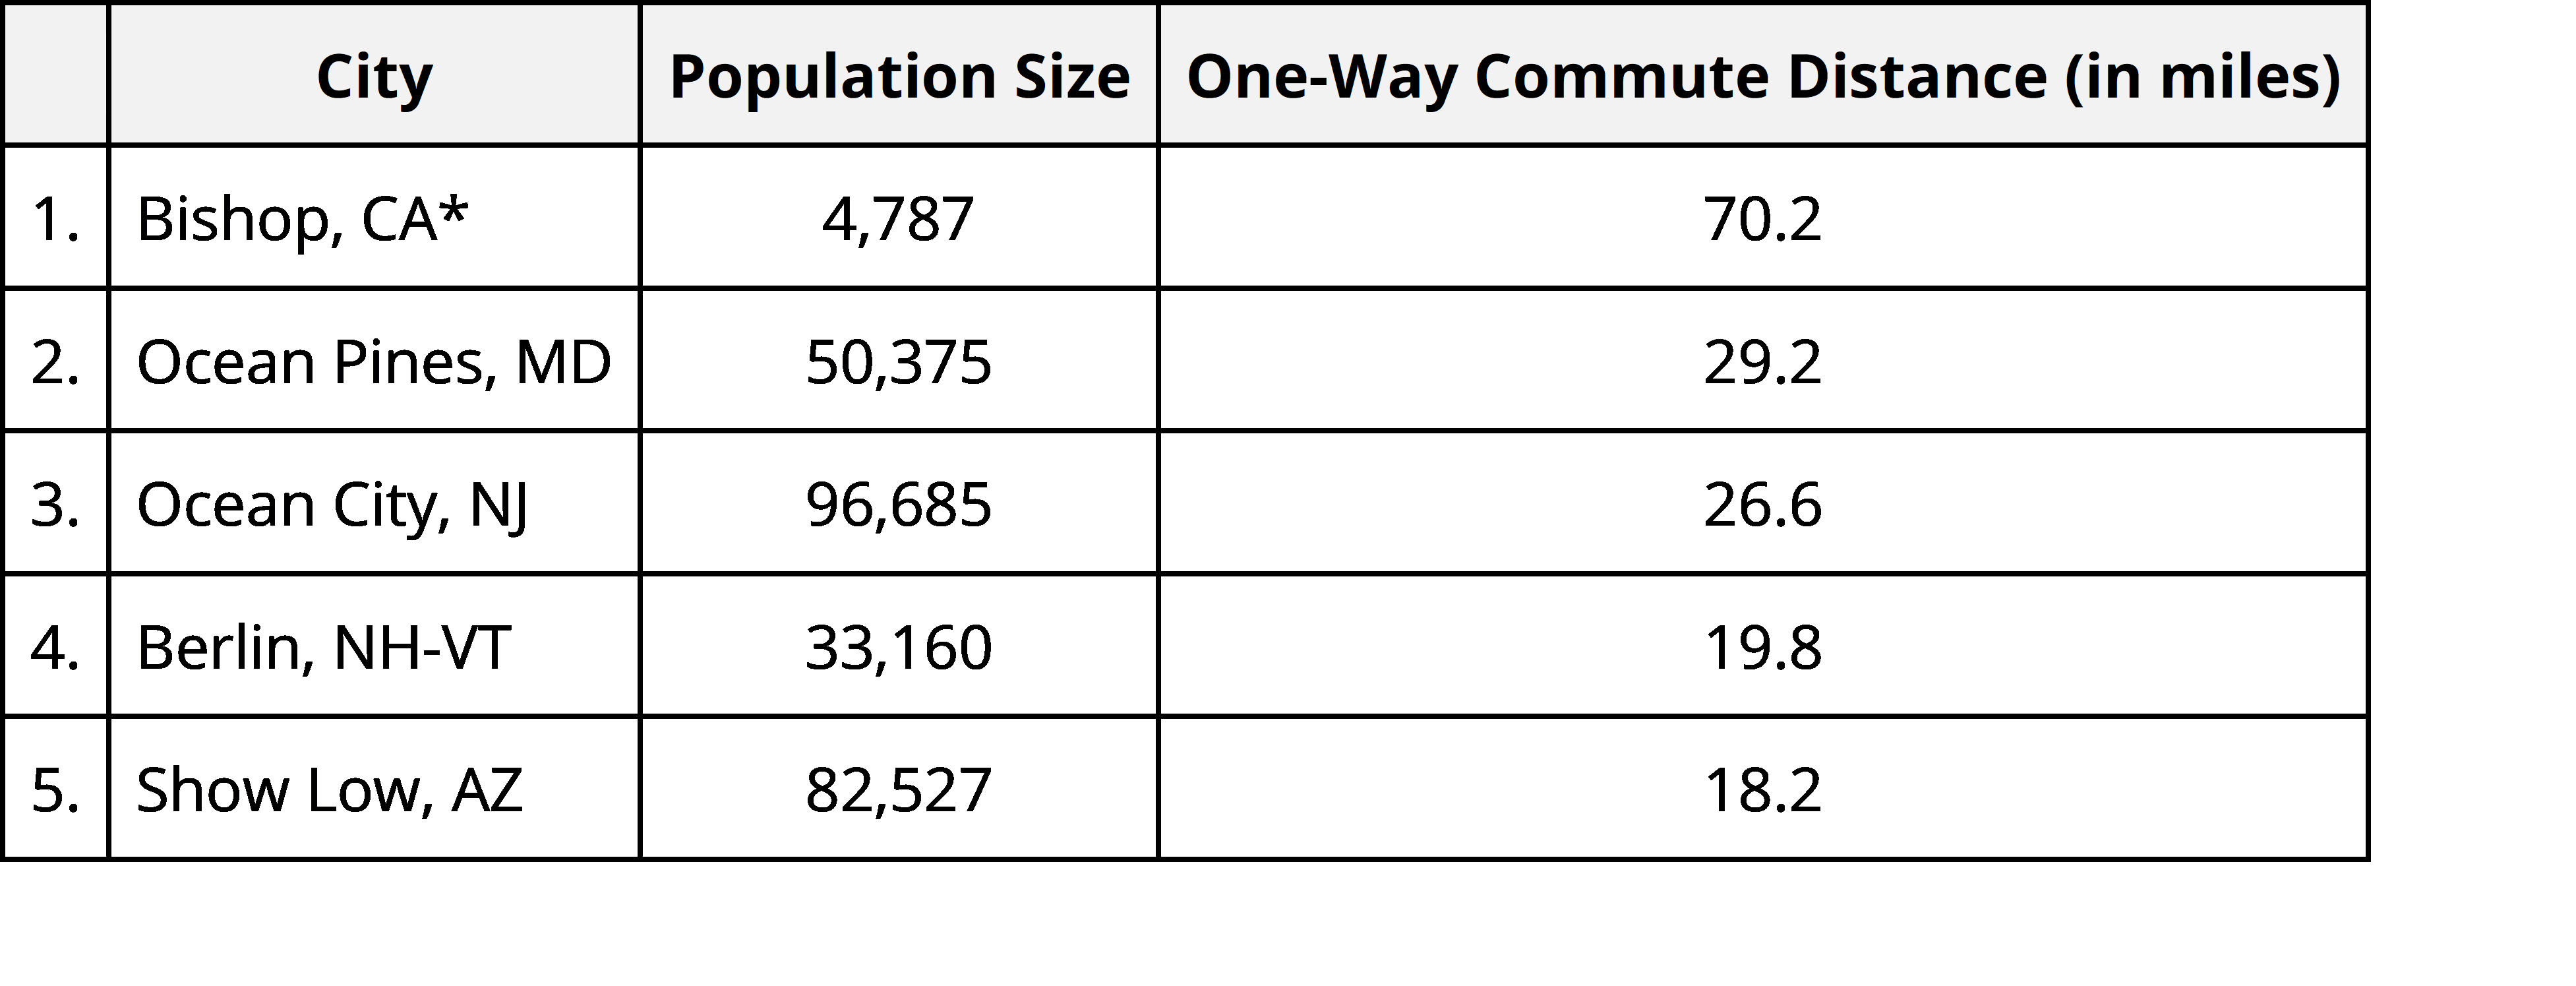
Top 5 Cities (CBSAs) with the Longest Commutes
To understand city-wide travel patterns, we looked at CBSAs, or core-based statistical areas, which are a census designation for “one or more counties anchored by an urban center of at least 10,000 people,” plus neighboring counties with socioeconomic links to the urban center due to commuting. Keep in mind that statistics related to low population areas can be heavily impacted by a small number of commuters who drive long distances.
Why this Data Matters and How to Put Big Data to Work for Your Transportation Projects
Commuter data is key to finding actionable solutions for the problem. With these insights, transportation and urban planners are equipped to make insightful decisions regarding transportation planning for the future. These data points also reveal areas that may need extra attention to make commutes to and from work shorter.
Consider incorporating Big Data analytics into your transportation and urban planning process. When you do, you’ll have better insights into the commuting habits of your community, and you can find solutions to alleviate the burden of their commutes. For more information on this topic, check out the blog next week to read part two of this series on commutes across America.
Can Big Data Use In Transportation Planning Reduce Infant Mortality Rates?
Can Big Data Use In Transportation Planning Reduce Infant Mortality Rates?
When most people think about transportation, they think about planes, trains, and automobiles – maybe even ferries. But infrastructure, technology, and our transportation networks do more than help us travel. They also have socioeconomic impacts. Getting from point A to point B efficiently is not only a matter of convenience. It can be a matter of life or death – and not just from a traffic safety perspective. The issue of infant mortality clearly illustrates the interplay of health, socioeconomic conditions, and transportation. In this article, I’ll explore this relationship and highlight a few ways that Big Data can be helpful for planners working to address infant mortality.
This article will focus on the City of Columbus, Ohio for two key reasons:
1. Infant Mortality is a Challenge That Must be Addressed in Columbus
Average infant mortality rates in the US are high compared to many developed countries, and Ohio is on the high end for the US. In 2016, Ohio had with 7.4 infant deaths per 1,000 live births. This is in contrast to the national average, which in 2016 was 5.9 deaths per 1,000 live births. While high infant mortality rates are a problem that we need to address nationwide, it’s particularly important to do so in Ohio.
Columbus, the most populated city in Ohio, struggles immensely with this problem. In their lower-income counties, like Franklin County, 2 to 3 babies die before the age of one every week, and 11.4 percent of babies in Columbus suffer preterm births. As is unfortunately the case in many localities, Columbus infant mortality challenges disproportionately affect lower-income areas and people of color. As I’ll explain below, a huge factor in this issue is transportation problems.
2. Columbus Has the Resources to Use Big Data to Address It
On the bright side, Ohio DOT already has a Regional Subscription to StreetLight InSight®, StreetLight Data’s online platform for turning Big Data into actionable transportation analytics – it’s more than traffic data alone. That means many planners in Ohio already have on-demand access to both Big Data resources and easy-to-use software. The StreetLight InSight software is key because it makes it easy for planners to transform messy, archival location data into the real-world information that can help address this challenge.
Columbus also received an amazing opportunity in 2016 when they won the Smart Cities Challenge sponsored by the federal Department of Transportation. The city received $50 million to create a new transportation system that would specifically address accessibility issues in low-income neighborhoods. With these funds, Columbus is working to use autonomous vehicles, connected cars, and updated bus fleets to better connect the city. A major goal of this plan is to link transportation in low-income neighborhoods to health care facilities.
How Transportation Impacts Infant Mortality Rates
According to an investigative article from City Lab, the ability to actually go to a doctors’ office is one of the biggest factors in infant mortality. For example, “There are more single mother households [in the South Linden neighborhood in Columbus] than in 99 percent of all U.S. neighborhoods, yet there are no OB-GYN clinics. With a median household income of about $21,000, relatively few households own cars.” Simply put, it’s hard for parents in South Linden to travel to be able to get to a doctor.
However, it could completely change the outcomes for infants if doctors were more convenient to South Linden. In Franklin County, where Linden is located, 14 percent of all infant deaths are due to prenatal conditions and congenital anomalies, which can go undetected if doctors’ appointments are missed. If a woman cannot physically get to the doctor, financially or due to a lack of transportation infrastructure, the odds of fixing the infant mortality get a lot longer. This is where using the right type of data for transportation planning can be a game changer.
Access to Big Data—and by Big Data, I mean the location data created by connected cars and trucks, smartphones, and wearables—can help communities use real-world information to design their transportation networks. Instead of relying on outdated information from surveys or incomplete data from sensors, planners can see the full picture of travel behavior for their entire city across all demographic groups. This drives more accurate travel demand models and forecasts, and it allows planners to easily and quickly measure the performance of policy and infrastructure investments. Columbus has an amazing opportunity to use Big Data and modern technology to get the information required to address important social issues.
Common applications on smartphones can aid in Columbus’ fight against infant mortality.
Why is Big Data the Right Type of Traffic Data to Address Infant Mortality?
It seems like the term Big Data is getting thrown around left and right to address huge problems in our communities. So, let me break it down into two digestible ways that Big Data can actually aid Columbus, and more generally Ohio, in their fight against infant mortality.
1. Understanding Real-World Travel Patterns
In 2016, 77% of people in the U.S. had a smartphone. Many smartphone users have applications—such as dating apps, weather tracking apps, shopping apps—that document their location through opt-in location-based services (LBS). This LBS data can be processed to reveal insights into travel patterns like trip origins and destinations, home and work locations, and more. This type of data allows planners to empirically understand where people are going and coming from. So how does this help infant mortality rates?
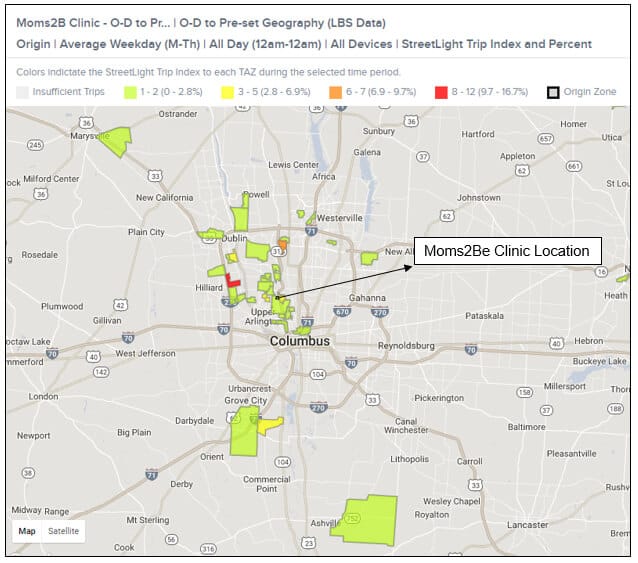
Well, planners could look at clinics such as Moms2B—a program dedicated to help mothers at high risk for infant mortality in Columbus—and assess what neighborhoods patients are actually coming from when they arrive to clinics, as well as what neighborhoods they are going to when they leave (see below). They could combine these real-world data analytics with other information sources. For example, they could talk to the clinic about the neighborhoods of their patients who miss the most appointments. From there, Columbus’ planners could target future transportation improvements or shuttle services to help mothers get to classes and appointments at this facility.
This heatmap shows the transportation analysis zones (TAZs) where trips to the Moms2B clinic location in Columbus, OH originate on average. The more red the TAZ is shaded, the more trips begin there. Note that, like most OB-GYN clinics in Columbus and elsewhere, Moms2B is located in a building that houses multiple medical service providers.
2. Increasing Civic Engagement
Big Data also allows for larger portions of a community to be civically engaged. Large scale transportation projects typically require public input, but the voices of those who are most affected by transportation problems or decisions, such as low-income individuals are often underrepresented in public meetings and conventional household surveys.
Traditionally, low-income individuals are less likely to attend public meetings due to a variety of reasons. These include not having a car to access the meeting, not being able to afford child care, having to work late and/or being unable to miss work. But many of these individuals have smartphones. This allows them to civically engaged when it comes to their transportation needs without having to actually go to a public meeting. In essence, the locational data their phones create can be their voice and communicate their transportation preferences and challenges, but only if planners use it.
If we put these two important benefits of Big Data together, then we can see how this new approach to traffic data could help Ohio and the city of Columbus to address infant mortality. By using Big Data, planners can understand what lower-income communities need in regard to transportation. They can utilize archival origin and destination matrices to recognize where people actually need to go, and then create shuttle services or bus lines that will have real benefits for lower-income communities. This means we stop putting bus lines in the places we think or assume should solve the problem. Instead, we start putting bus lines in the places where comprehensive, real-world data demonstrate that transportation accessibility improvements are truly needed the most.
According to CityLab, 23% of women who make prenatal appointments at free clinics do not actually show up. This relates to whether it is simple for them to get to their appointments. While the Smart City projects in Columbus don’t directly address infant mortality today, there is hope and potential that these women will benefit from spillover effects of transportation investments. But imagine if a planner decided to use Big Data to analyze where women who go to clinics are coming from, combined that information with the places women aren’t coming from, and then tailored transportation investments directly to their needs. Well, that would be a game changer.
Smartphones are altering our society in so many ways, so why not use all those billions of data points to create real, tangible benefits for these communities? Why not think beyond using traffic data for transportation alone, and focus on the ways that transportation can solve our greatest challenges? Women in Ohio and across the US need better access to health care destinations. Big Data can be the key to providing them with the transit options that will get them – and their families – to doctors conveniently, affordably, and efficiently.
The Segment Analysis: A Better Way to Measure Corridor Travel Behavior with StreetLight InSight®
The Segment Analysis: A Better Way to Measure Corridor Travel Behavior with StreetLight InSight®
We’ve added a brand-new type of analysis to StreetLight InSight®: the Segment Analysis. This feature helps you measure corridor travel behavior faster and more comprehensively. In this blog post, we’ll show you how the feature works and three great ways to use it:
- Diagnosing the Cause of Congestion
- Multimodal Planning
- Before-and-After Studies
What Is the Segment Analysis?
The Segment Analysis Project Type provides information about trips through corridors. The analytics included in this Project Type are derived from Navigation-GPS data, which are location records created by connected cars and turn-by-turn navigation apps for mobile devices.
The following standard analytics are provided for every Day Part in your study, and you can customize these Day Parts down to one-hour intervals:
- Trip speed
- Trip duration
- Relative volume of trips
When we calculate average speed along the segment, we look at the travel time between gates – that is the information our clients are usually looking for. But we’re going beyond these standard Metrics with this new Project Type.
The Segment Analysis comes with an important new Metric: Free Flow Factor, which you can also think of as “Speed-As-Share-of-Free-Flow.” It is a ratio of the average trip speed for a Day Part to the maximum average trip speed in any hour during the entire Data Period.
This means that when the Free Flow Factor is close to 1, there is little congestion on the corridor. The lower the Free Flow Factor, the greater the congestion. However, the “maximum average speed” per hour has to have at least 5 samples to prevent one or two outlier “speed demons:” from skewing the results.
How Does the Segment Analysis Help With Corridor Studies?
Some of you may be saying, “Hey – I’ve actually used StreetLight InSight” to get this information in the past. This isn’t new.” But the key point is that our Segment Analysis makes it so much easier to get this information. It’s faster and quicker to set up your study, and you don’t have to manually process tons of Metrics in Excel to get the insights you need.
The first step to using our Segment Analysis is to set up your Road Segment Zones, and we’ve made it really easy to use your own line geometries. All you have to do to set up your Zones is to upload a line segment shapefile with all of the corridors that you want to analyze. Road Segment Zones uploaded via line segment shapefile are the only type of Zone that can be used for this Project Type.
Once you upload your Line Segment Zones, three gates will automatically be created: one at the beginning of each segment, one at the middle of each segment, and one at the end of each segment. (See Figure 1 below).
Figure 1: This shows a Zone created by uploading a line segment shapefile to StreetLight InSight. Three gates, shown in light blue, were automatically created: one at the beginning, one at the middle, and one at the end of the segment.
Once your Zone Sets are created, simply navigate over to the Create Projects tab, then create your Segment Analysis Project just like you would any other Project. You customize your Day Parts using our standard Project Options menu, and you can set up your bins for Trip Speed and Trip Duration in separate Project Options menu. It’s that easy.
Example #1: Diagnosing the Cause of Congestion
Many cities already know where their congestion occurs thanks to a variety of different tools — including personal misery on the way home from work! The new Segment Analysis Project Type offers a way to explore when and why congestion happens, especially when used in combination with Premium Trip Attributes, Zone Activity Analysis, and/or StreetLight Volume: 2016 AADT.
Of course, the Segment Analysis can also help you identify where congestion occurs, and that matters. In our experience, our instincts about where and when the worst traffic happens are not always correct. Being stuck on your way to an important meeting may feel a lot more stressful than a slowdown during lunch hour.
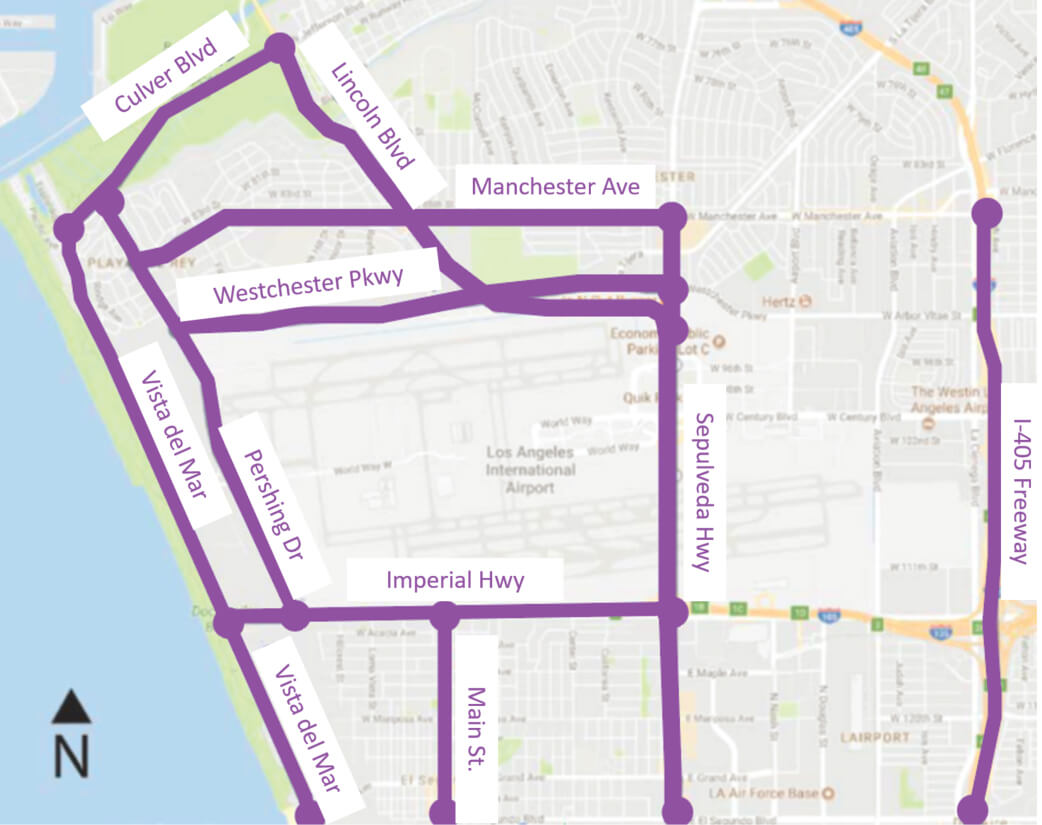
As a quick example, let’s analyze a few roads around Los Angeles, which is famous for its mind-numbing congestion. Imagine that LA residents are concerned about congestion on Del Mar, so planners in LA want to identify the time and place of top congestion, and identify why it is occurring. They’ll use this information to implement changes, and, later, to see if congestion improved.
Figure 2: These are our roads of interest around Vista Del Mar in Los Angeles.
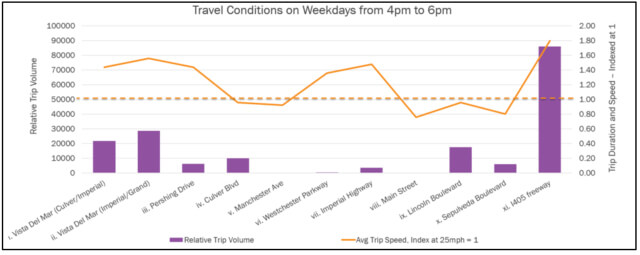
First, we can use the Segment Analysis to compare average speed to volume of traffic. As Figure 3 (below) shows, during the afternoon rush, Vista Del Mar’s speed is actually quite high compared to other roads in the area. It’s comparable to Imperial Highway and a little faster than parallel Pershing and Sepulveda. This is true despite the fact that Vista Del Mar moves more people than those other two roads, thus its throughput is in fact quite good – at least it is on an LA-adjusted basis.
Figure 3 – This shows average trip speed compared to total traffic for various roads around Vista Del Mar in LA. We created this chart in MS Excel using StreetLight InSight .CSV files.
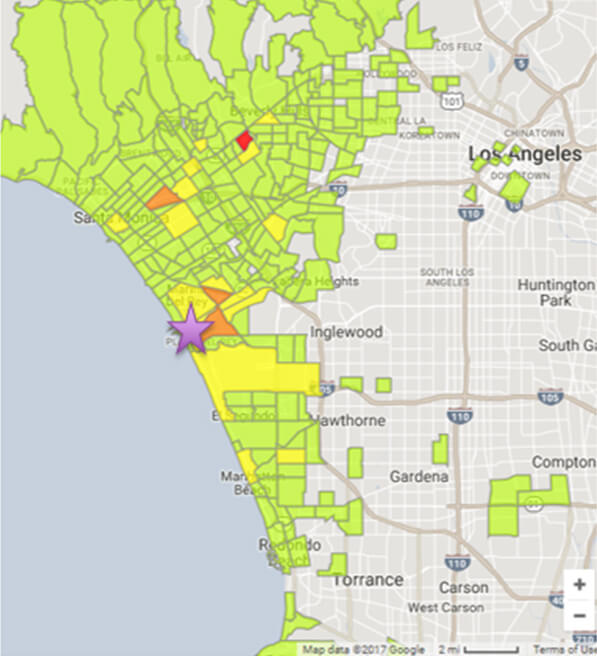
Next, we can use another type of Project – Origin-Destination to Pre-set Geography Analysis – to dig into the origin and destination of traffic during rush hour on Vista Del Mar. This will help us to better understand the causes of existing traffic, and then target solutions to the locations indicated.
Figure 4 – This shows the destinations of trips that passed through the congested segment of Vista Del Mar. “Hotter” zones can be good targets for transit, employee incentives, rerouting, and other programs to reduce congestion.
Example 2: Multimodal Planning
One of the biggest benefits of Big Data is the ability to scan really large geographies for specific travel conditions. This is particularly helpful for multimodal planning, and the Segment Analysis Project Type gives our clients a new way to do this.
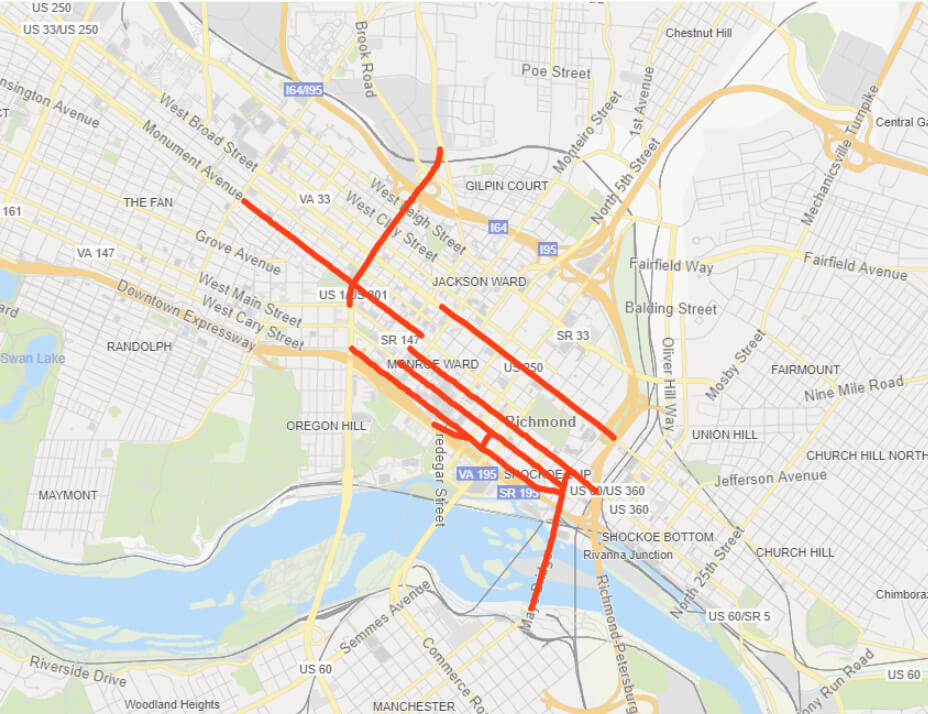
Take, for example, bike lanes. Let’s imagine we want to do in-depth studies to invest in bike lanes in Richmond, Virginia. Before we spend a lot of time and money on those studies, we want a “short list” of the roads that are the best candidates for bike lanes. Let’s hypothesize that the best place to add bike lanes are road segments where:
- There are lots of short vehicle trips happening in cars.
- Those vehicle trips would be faster if they were bike trips instead.
- The average speed of cars and trucks is less than 40mph – this makes cycling safer for riders.
In the pre-Big Data world, planners could look only at speed limits, some level-of-service data for vehicular travel, and perhaps some surveys. That data was often inaccurate, took a while to collect, and was hard to compile. Now with Big Data and our new Segment Analysis, we can look at all three of these characteristics simultaneously. In fact, by combining the Segment Analysis Project Type with StreetLight’s existing Premium Trip attributes, we can get everything we need to complete this study in under 5 minutes.
First, we create our Zone Set by uploading Line Segment shapefiles to StreetLight InSight. Next, we run two studies: Segment Analysis and Zone Analysis with Premium Trip attributes. (I won’t go into the details here, but please check out our Support Center for more information).
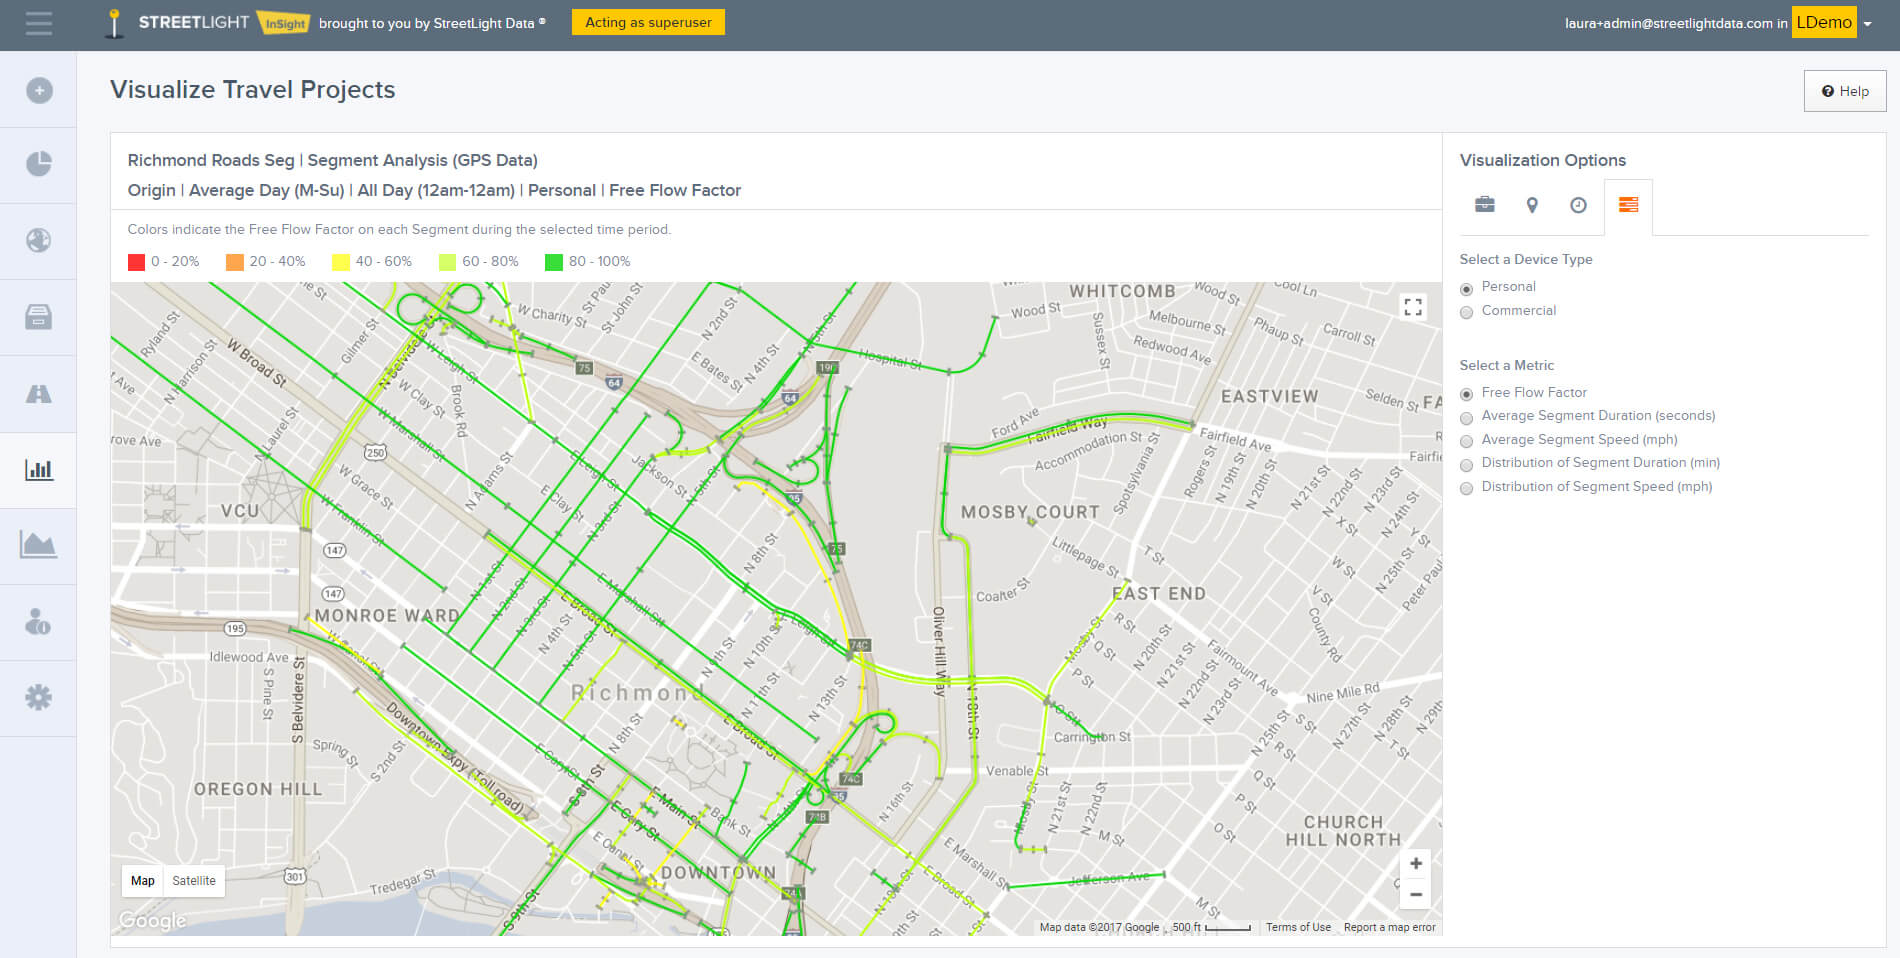
You can see the results of the Segment Analysis as displayed in StreetLight InSight in Figure 5 below.
Figure 5: This map shows the congestion factor for candidate bike lane roads. The roads that are light green and yellow are more congested for personal vehicle traffic, making them potentially better candidates for biking, as drivers might see more time saving benefits by switching modes.
My next step is to assign five “scores” for each of my road segments – congestion during rush hours, max daytime hourly speed for cars, max daytime hourly speed for trucks, share of personal car trips under 5 miles. I eliminate road segments that had one or more scores “out of range” (speeds over 40mph, fewer than 5% of trips under 5 miles, etc.).
This leaves me with a shortlist of 10 or so roads to pursue in greater detail (shown in Figure 6 below). I can now use local knowledge, stakeholder outreach, and all the other planning tools in my toolkit to finish my multimodal planning process, but I have a huge head start thanks to Big Data.
Figure 6: Top 10 road segments for bike-ability, based on criteria from StreetLight Segment Analysis and Trip Attributes analysis.
For an example of how these “rankings” work in chart format as opposed to map format, take a look at our blog post on electric vehicle charging stations.
Before and After Studies to Measure Changes in Speed and Delay
Our new Segment Analysis also makes measuring the impact of infrastructure on speed and delay much faster and easier. It’s a quick-and-easy check on how speed and congestion change over time on a particular road segment.
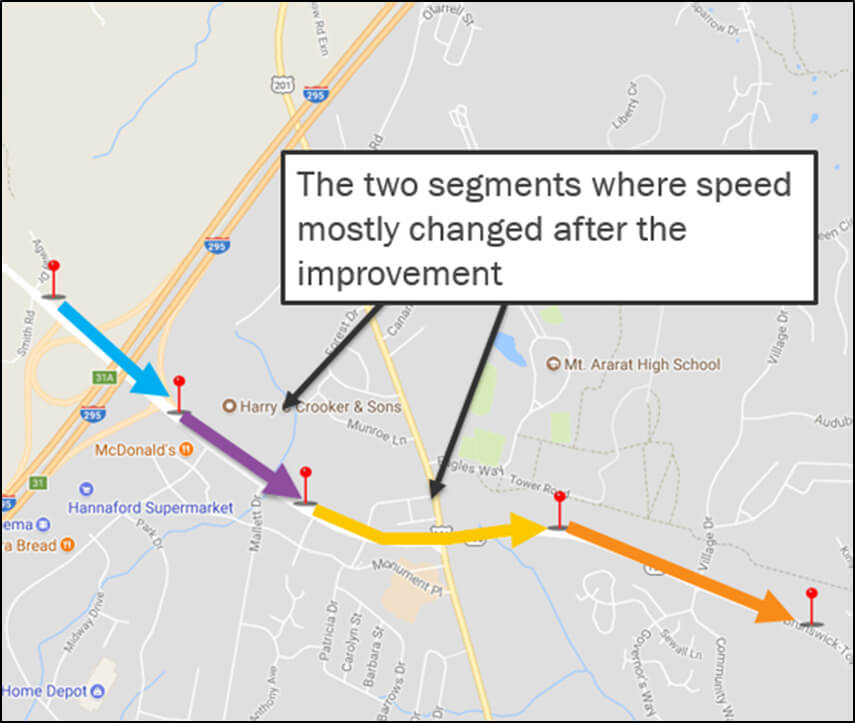
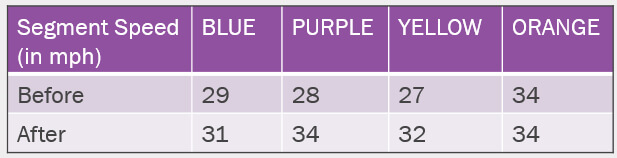
To demonstrate this, let’s take a road in Maine where signal timing improvements were implemented in February 2017. We measure the speed on the segment and subsegments of the road in question for six months before and six months after the implementation of the timing improvements. Our question is: Did the timing work? It did indeed! In particular, travel speed improved in the central two segments.
Figure 7: Four segments near improved signals in Brunswick Maine.
As shown in the table below, gains in the central segments were significant: 5 to 6mph or about 20%.
Analyzing Roadways with the Segment Analysis: Putting it All Together
As you can see, our new Segment Analysis is a powerful way to access actionable insights about trips through corridors. It makes collecting all the pieces of information you need to understand – and solve – congestion challenges much simpler and quicker.
The Big Picture: Big Data for Detour Route Planning
The Big Picture: Big Data for Detour Route Planning
If you’re like many drivers today, your heart sinks when you see an orange road sign with the word “DETOUR.” Suddenly, you remember the flashing highway sign that warned you in advance that construction was coming. In today’s busy world, you simply forgot and did not prepare. As you join the hundreds of other drivers who are now taking a circuitous journey around much-needed construction, you realize that you’re going to be late.
But with the right data tools, transportation planners can make these frustrating detour experiences much better. When planning major transportation projects such as construction and lane closures, it is essential to identify the best alternate routes to reduce traffic disruption – that’s something we can all understand. But it’s time to change the way we identify them. Learn more about using Big Data to improve detour planning in this blog post.
The Federal Highway Administration’s guide on “Developing and Implementing Transportation Management Plans for Work Zones” recommends that state agencies use simulations to analyze the impacts of work zones, but these simulations cost at least $150,000. They can also take several months to configure and run, and that’s after planners have collected the data they need to build these simulations. So while this tactic has been effective for planners, it is also a slow and arduous process. Sometimes planners don’t always have that time – just consider the collapse of a bridge on I-85 in Atlanta just a few months ago.
Big Data, defined here as location records from mobile devices, can be combined with contextual data sets to create powerful, accurate measurements of trip volume, peak travel times, and peak traffic flow. Even more importantly, they can show planners the origins and destinations of routes that will impacted by construction and closures. These analytics can help transportation planners develop more accurate detour scenarios that are grounded in real-world travel behavior much faster and cost-effectively.
Detour Templates Just Aren’t Enough
Prior to beginning construction, approved detour plans are required to help mitigate the impacts on roadways and the modified vehicular, bicycle, and pedestrian traffic. California’s Sacramento County, for example, provides planners with Traffic Control Plan templates. These templates help planners strategize an effective detour plan during construction. They offer suggestions for speed changes based on the project, appropriate signage for a detour, types of barricades, and more.
But even with 50 detailed scenarios for Sacramento alone, these templates do not cover all locations and situations that could occur. Exceptions require review and approval before construction can begin. Complex, multi-stage construction projects will likely require far more sophisticated solutions that are not offered on their website.
A Big Data Approach to Detour Planning
Big Data allows transportation engineers to quickly and easily estimate the impact of construction on travel patterns, and identify the most efficient alternative routes. The sample size from months of Big Data is usually superior to sending out a probe vehicle or scanning license plates, and it provides a more comprehensive picture of complete travel patterns than sensors.
This Big Data approach can also be used to optimize detour designs to help prevent bottlenecks and other unintended safety issues. Using this real-world data can help engineers to ensure that the alternate routes can handle the overflow traffic, preventing the many potential issues from the detoured traffic. Better measurement of existing travel patterns can also help reveal the routes that drivers prefer as alternatives, improving driver satisfaction and lessening potential disruptions or inconveniences.
Measuring Travel Patterns to Create Better Detours
Big Data makes it easier to measure corridor reliability and performance in a variety of conditions. For corridor studies using Big Data, transportation experts can zero in on the routes that travelers take to get from their origins to their destinations. They can quickly find out about the types of trips that take these routes at different times of day, types of day, and days of the year. Characteristics include:
- Average travel time
- Distributions of travel times
- Average speed
- Distributions of speeds
When transportation experts use analytics about trips from millions of mobile devices instead of relying on simulations alone, they can empirically measure the travel preferences of a far greater percentage of the population across a longer time span.
These analytics can also help planners target their communications about construction and road closures to the right audiences. When planners accurately identify where the origins and destinations of trips that use routes impacted by construction, they can ensure that the right people get the message about upcoming detours. While installing signage on the affected highways is an important first step, reaching out to employers and residents directly is equally valuable.
Beyond Detour Planning
For major transportation projects, traditional methods of data collection don’t always have the necessary detail to create dynamic responses to changing conditions. Armed with Big Data, transportation experts can develop a clear, comprehensive, description of behavior along specific corridors that is valuable for real-world projects. Because these expenditures are based on actual, measured behaviors, they are more likely to deliver good ROI in terms of both avoided congestion and dollars spent.
Are We Ready for Autonomous Vehicles?
Are We Ready for Autonomous Vehicles?
At this point, it seems clear that autonomous vehicles are on the verge of technical feasibility. Just last week, Waymo announced that it is testing self-driving minivans without a human back-up in the front seat. Its employees will be riding in the back with an emergency stop button – but no steering wheel. But do these technical advances mean that we’re ready for AVs? How should we manage the non-technical aspects of AV deployment to ensure they achieve promised improvements in safety and accessibility?
I decided to write this article to address these issues after participating in the Intelligent Transportation System World Congress earlier this month. There were tons of panels focused on autonomous vehicles, and I was lucky enough to speak on one that dove into the critical questions for civic leaders and transportation professionals. We went beyond technical readiness to ask ourselves if should we deploy AVs, and, if so, how should we deploy them?
The name of the panel was “Automation as a Solution: Addressing 21st Century Mobility Challenges through AV Deployment.” I’ve collected a few of the key themes and interesting remarks in this post. Many of these ideas were generated by my co-panelists: Avery Ash from INRIX, Karla Taylor from the City of Austin, and Dave Vermer from HMI Tech. To avoid any misquotation or misinterpretation, I’m not going to attribute specific ideas to specific people.
Personally, I don’t think that AVs are inherently good (or bad!). If they can help mitigate some of the serious challenges facing our environment and our economy, and if they bring greater prosperity to all segments of society, then I’m all for them. But what if they’re just new places for rich people to binge watch Netflix in? What if they only make it easier for people to live further out and isolated in the suburbs? If that’s the case, then I’m deeply concerned about them.
Coming out of the conference, there seemed to be a general consensus that AVs should be shared and electric as a key part of achieving the positive version of the AV future. And I agree. How can the transportation industry work to ensure that AVs will be deployed in a manner that is good for accessibility, affordability, and jobs equity?
Require AV Manufacturers to Share Their Data
Data about AVs should be easy to collect, at least in a technical sense. But historically it has been really hard to collect data about everyone else on the road, and that is critical for us to rigorously understand how AVs are impacting our system very early on, as soon as they are adopted by consumers. To achieve that rigorous understanding, we absolutely need good data from AVs – data that is relatively complete and demarcated as “AV only-data.” But we also need data on everyone else.
We didn’t do a great job with this concept when transportation network companies (TNCs) such as Uber and Lyft hit the roads. First, we still don’t have many useful data about TNCs from the providers themselves. Second, this issue is compounded by the fact that most planners still use very clunky techniques like surveys to measure “everyone else.” Thus, we have very little idea of how TNCs are being used, and the evidence we do have about their impact is usually anecdotal.
As a result of this lack of data, we cannot and have not done a good job of managing the arrival of TNCs, nor have we effectively pushed for these new services to benefit all parts of our cities. If we take the same approach with AVs, we are virtually guaranteeing that the same situation will unfold.
Facing the Infrastructure Challenges Head-On
The real infrastructure challenges for AVs are not high-tech. They’re low-tech. The most significant one my co-panelists and I have heard is striping, or painting clean lines on the roads and keeping them maintained. AVs perform best with clean and maintained basic roadway infrastructure like painted lines, consistent curbs, and no potholes.
This type of infrastructure challenge is not new: Clearly painted lines and no potholes also make driving for humans much safer and easier. And yet, many communities are struggling to keep these basics up to par. What about AVs make us think that we can avoid the systemic policy and funding issues that drag down our ability to maintain the fundamental infrastructure of our roadways?
Instead, cities seem to be distracted by companies asking them to spend extraordinary amounts of money on “connected IoT” and other infrastructure investments that are far less critical – to AVs and to everyone else – and way more expensive to implement. But if we don’t put our collective “house” of infrastructure into order first, AV deployment won’t be successful.
Don’t Start With Consumers
The vision for AVs does not have to be focused on personal vehicles taking drunk people home from a bar! Some of the most interesting applications are in commercial vehicles, utility vehicles, and delivery vehicles. These commercial market segments are also easier to manage from a regulatory perspective: There are fewer actors in the market (when compared to consumers), and these actors are already accustomed to regulatory compliance.
Where Do We Go From Here?
Bringing this together, here’s a proposal: I think the first AVs should be maintenance vehicles that make the infrastructure and road network better for all. They can start as super-Roombas that sense potholes and chipped line paint. Maybe they can send messages that deploy fix-it teams, or maybe they can fix issues themselves. The streets will get better and safer for everyone, and they will also become AV-friendly. As our fleets of self-driving super-Roombas fix our highways, the industry can work with manufacturers to ensure our data collection systems are robust and seamless.We can test the data that these maintenance teams send to ensure the information provided is complete. With an effective data collection system in place prior to consumer adoption, we will be ready to measure the impact of widespread AV deployment as it occurs.
I know this may result in jobs lost for people working in road maintenance. I suggest that we already have a lot of unfilled jobs and work in this field. Plus, the companies that deploy these maintenance AVs as pilots could also be asked to provide AV maintenance or management training in the community as part of the pilot.
The conversation about AVs has just begun, it’s complex – but it’s starting to seem like we’re running out of time to get this right. For example, the New York Times magazine was almost completely about AVs this weekend.
4 Ways Big Data Helps Cities Create Better Transportation Plans
4 Ways Big Data Helps Cities Create Better Transportation Plans
Getting the data you need to make savvy transportation planning decisions can be a lengthy, expensive process if you’re using surveys, license plate counts, or road sensors. These methods also make it difficult to evaluate the performance of a policy or project after implementation.
For example, when planners rely on old or modeled data to design their project, they don’t have a real-world baseline to evaluate current performance after a project is completed. Most road sensors are removed after a few days, so they must be re-installed to collect more data. Surveys can take months or even years to complete. If planners want to make performance-based improvements as they implement policy or infrastructure changes, they often have to start from scratch with data collection. This could create real flaws if your community has seasonal variation based on weather or school – or if your community has new transportation patterns derived from the rise of ride share or urban population growth, for example.
In today’s world, there are much more efficient, up-to-date, and accurate ways to obtain the information you need. Nearly 77% of the US population uses a smartphone, and the data they produce is creating new options for transportation planners. In this article, I’ll share four advantages that Big Data has over conventional data sources for transportation planning.
Why It’s Time To Update Data Collection Methods
Transportation behavior is changing rapidly, and so are other factors that influence planning decisions, such as household characteristics; for example, millennials are more likely to live in high density housing, they’re buying fewer cars and houses than their parents, and they’re delaying parenthood.
For example, according to CNBC survey, 22% of Uber users aged 17 to 64 in the US delayed buying a car because they could use Uber. That’s adds up to as many as four million people opting against cars. However, many of the transportation decisions made today came from household surveys that were taken before ride-share companies such as Uber and Lyft even existed.
This dramatic change in transportation decisions creates a disconnect between projects that were top priorities six years ago and the projects that are need now. We need current data to know how our planning priorities should change to match the behavior and the preferences of people today.
But despite these new challenges, infrastructure and planning budgets are not growing. Communities have to maximize the utility of future spending. That means it’s critical for transportation plans to be based on accurate forecasts and models – and just as it’s critical to measure whether or not policies and infrastructure actually improve conditions as predicted.
The Four Advantages of Big Data
Here are four ways that using Big Data analytics can help:
1. Big Data lets you collect real-world information that is current and up-to-date.
This is particularly true when you compare Big Data to stale household survey data or models. Surveys are valuable in that they can provide much more context about transportation behavior than mobile data alone. However, surveys are difficult to design statistically, the sample sizes are small, and they cannot tell the “full story” of travel behavior objectively because they are respondent-dependent. While models are important for forecasting future conditions, they have to be calibrated with accurate input data to be effective. Using a model that was built with survey data from five years ago is not the best way to model the impact of future transportation decisions.
When you use Big Data, your forecasts are based on real-world location records that reflect current travel patterns. This eliminates the subjectivity inherent to most surveys and yields better modeling results.
2. Big Data is more complete than some traditional methods.
It’s based on comprehensive and measured real-world behavior instead of limiting surveys or sensors. New York City, for example, has a sensor network of 600 cameras installed throughout the city. These sensors can tell city officials a lot about traffic patterns, but the network is primarily used for real-time operations. The network does not provide the origin-destination data required to design and implement effective, long-term transportation plans and strategies, and it doesn’t provide data on the hundreds of other corners not covered by the cameras.
For long-term solutions, it is vital to know where travelers begin and end their trips. It’s also vital to cover travel patterns across an entire busy city or region comprehensively. That’s where Big Data comes in. By supplementing the data generated by stationary sensors with Big Data, we can find solutions to traffic congestion and similarly problematic transportation issues.
3. Big Data lets you collect data more quickly.
You can spend less time gathering data and more time analyzing the complex challenges you uncover with the new information. That’s because Big Data allows you to empirically measure behavior that was previously impossible or too expensive to effectively utilize – and you can access that data much, much faster. For example, with our unique StreetLight InSight® platform, you can run a customized transportation study in just a few mouse clicks right on your computer.
With Big Data, it’s simple to run the same study several times in rapid succession with different parameters. This gives you the flexibility to keep analyzing transportation patterns until you have the information you need. When you use conventional tools, running a transportation study is something that takes weeks, months, or even years to complete at great expense. With StreetLight InSight, it takes less than a day and all you need is a computer and an Internet connection.
4. Big Data helps you understand what projects and policies are most effective.
Big Data allows planners to analyze project performance – even if they didn’t collect the data to begin with. Planners can go “back in time” to see what projects were successful in the past, and whether new initiatives are meeting objectives. This type of critical evaluation leads to deeper trust between decisions makers and constituents. When lessons learned are taken into account, it also enables better cost-benefit analyses for major plans.
When we make decisions using real-world data instead of modeled assumptions, our policy, and infrastructure decisions are far more likely to perform well.
Putting It All Together
Let’s look at why using Big Data to measure project performance can lead to better transportation plans. With Big Data, you can easily and cost-effectively evaluate the impact of decisions – and that leads to better policies and project and prioritization.
By accessing and comparing archival data from different time periods, transportation planners can clearly show the results of their work in terms of:
- Travel time
- Trip speed
- Vehicle-miles travelled
- Route choice
- Impact by demographic group, neighborhood and trip purpose
It’s clear that Big Data presents several key advantages for transportation planning when compared to traditional data collection tools. While surveys and sensors have their merits, they are not enough to measure and diagnose the transportation challenges we face today.
Big Data and Air Quality: Understanding Vehicle Emissions
Big Data and Air Quality: Understanding Vehicle Emissions
This year, the Eastern Research Group (ERG), Coordinating Research Council (CRC), and StreetLight Data teamed up to validate one of the big as yet unmet promises for Big Data – the ability to better model and thus manage criteria pollutant air emissions from vehicles.
The results of our work show that using Big Data to model emissions at the county level is more accurate than industry-standard practices today. Of three different counties we analyzed, we found that:
- Two counties would have overestimated their emissions if they used the industry-standard approach, and
- One would have underestimated emissions by as much as 14% for a typical day and up to 110% in an individual hour.
Modeling emissions accurately matters: It allows air quality models to better predict concentrations of the regulated air pollutants ground-level ozone and particulate matter in different counties, which informs air quality planning and control strategies at the local level. In this blog post, we will walk you through the new methodology and some of our key findings.
Here’s how modeling vehicle emissions in the US works today. The Environmental Protection Agency developed a model named the MOtor Vehicle Emission Simulator (MOVES) that counties in all states except California use to estimate emissions from mobile sources. The input data for vehicle speed and distributions of vehicle-miles traveled (VMT) by hour, day type, and month for this model comes from one of two sources:
- National averages provided by the EPA via the MOVES model database, or
- Local survey work, which can be costly – particularly for vehicle speeds.
The distribution of VMT is automatically monitored by a nationwide network of under-road monitors known as the Highway Performance Monitoring System (HPMS). There is no such centralized monitoring system to capture speeds,and because of that, most vehicle emission inventories rely on the national average speeds contained in the MOVES model.
We wanted to see if Big Data could help capture the granularity and local elements of survey work but in a systemic, nationwide, and cost-effective manner. Simply put, we wanted to develop a new method for communities to get more accurate results without conducting their own expensive, time-consuming local data collection studies.
Study Justification and Set Up
First, a little more background on NEI. NEI is compiled by EPA every 3 years. It aims to provide the estimated volume of major pollutants at a local level in all sectors and counties of the US. In everywhere but California, NEI now relies solely on MOVES for on-road emissions estimates.
When NEI is updated, each state is given the option to submit its own complete mobile emissions estimates or to use the EPA’s default MOVES County Database (CDB) inputs. Default estimates are used in states that do not supply their own data. Historically, many defaults are simply uniform national averages – there is no geographic variation. These average values include average speed commonly, and less-commonly the VMT distribution by hour, day type, and month. The result is that many local areas have poor estimates of mobile source emissions because of the use of nationwide averages.
The goal for the CRC and ERG was to use Big Data derived from mobile devices such as connected cars and smart phones to develop new default average speed and VMT distribution inputs for the next version of the NEI. We wanted inputs with as much geographic detail as possible. In addition, we wanted to see if we could populate the very granular inputs that are used in the MOVES model, including:
- 16 average speed bins
- 4 road types
- 3,109 Counties (contiguous U.S.)
- 12 Months
- 7 Days of the Week (to support AQ modeling)
- 24 Hours of the Day
- 3 Vehicle Types (Light duty passenger vehicles, medium duty trucks, heavy duty trucks)
We note that with all these divisions, there were over 1 billion possible bins!
StreetLight Data provided average speed and VMT distributions data for all bins using navigation-GPS data. Of course, with over 1 billion possible bins, plenty were empty at particular speeds, so some bins were dropped or aggregated. For example, there are no trucks driving at 1 mph on a highway at 3am on most Tuesdays.
As part of mapping the individual vehicle trips to the 4 road type categories required by MOVES, StreetLight performed a GIS analysis to assign trips to the nearest road segment shown in Figure 1 below – nearly 19 million road segments. These road segments were overlaid with major urban clusters to further categorize the road types as Urban or Rural, to mesh with the MOVES model roadway classifications.
Figure 1: The maps above show the 18,644,352 road segments that were analyzed in continental US. This number includes partially as well as fully overlapping (i.e. duplicate) segments (left image). The team analyzed these segments and differentiated roads in 3,601 urban cluster areas from rural areas (right image).
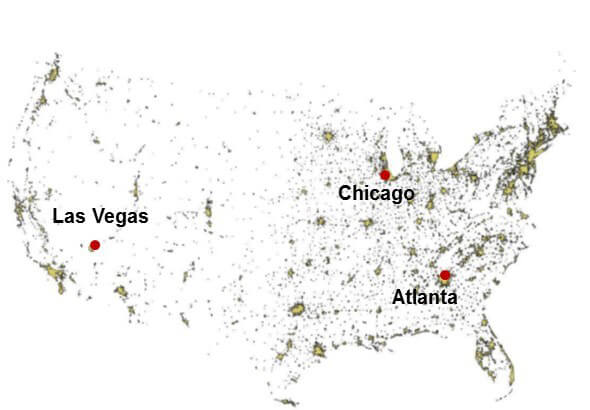
In addition, the team did deep validation on three counties: Fulton County (contains Atlanta), Cook County (contains Chicago), and Clark County (contains Las Vegas).
Results
In general, the Big Data derived outputs were different than the MOVES defaults for all three types of vehicles (light duty, medium duty trucks, and heavy duty trucks). Overall, the medium and heavy duty trucks tended to move at faster speeds than the light duty vehicles. We hypothesize that this is because trucks tend to choose major roads with faster speeds more than personal light duty vehicles.
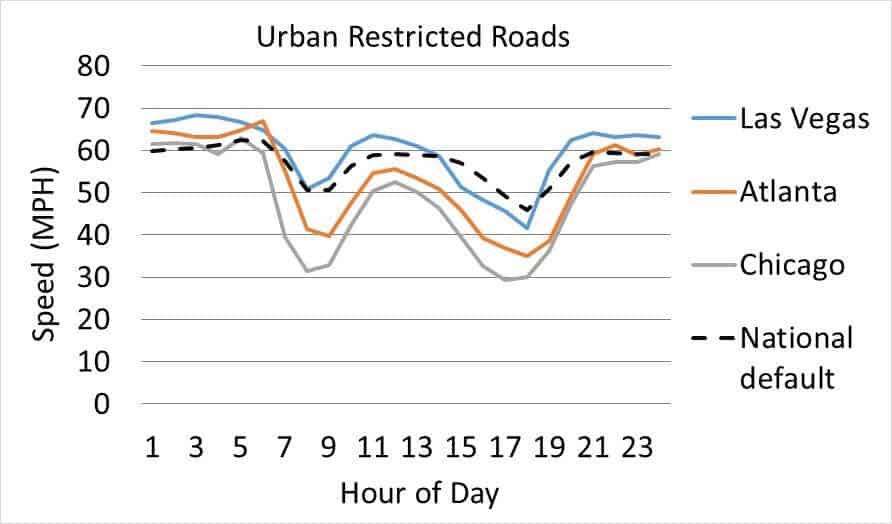
Differences between the EPA defaults and the three case study counties emerged in many different ways. For example, as shown in Figure 2, for Urban Restricted Roads (like highways), vehicles in Atlanta and Chicago move significantly slower than the national default. This is not surprising because these are congested locales. This result matters because emissions factors are higher at congested, slow speeds, and thus Atlanta and Chicago vehicle emission inventories would be underestimated if they used national defaults.
Figure 2: Average speed by hour of the day on weekdays for light duty vehicles on restricted urban roads.
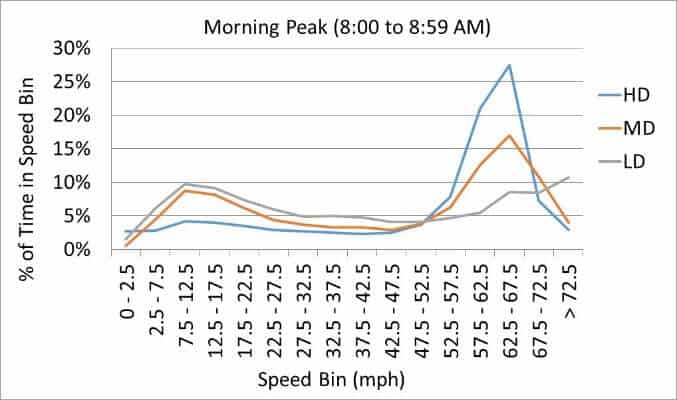
In addition, we found interesting nuances when looking at different speed bins. Between 8:00am and 9:00am on restricted roads in Fulton County (Atlanta), the heavy duty vehicles are far more likely to be going at top speed bins than the medium and light duty vehicles. This also leads to different emissions factors per mile of travel.
Figure 2: This graph shows the distribution of vehicle speeds by vehicle type in Atlanta between 8:00am and 8:59am. Heavy duty trucks spend more time traveling at higher speeds than medium duty trucks and light duty passenger vehicles.
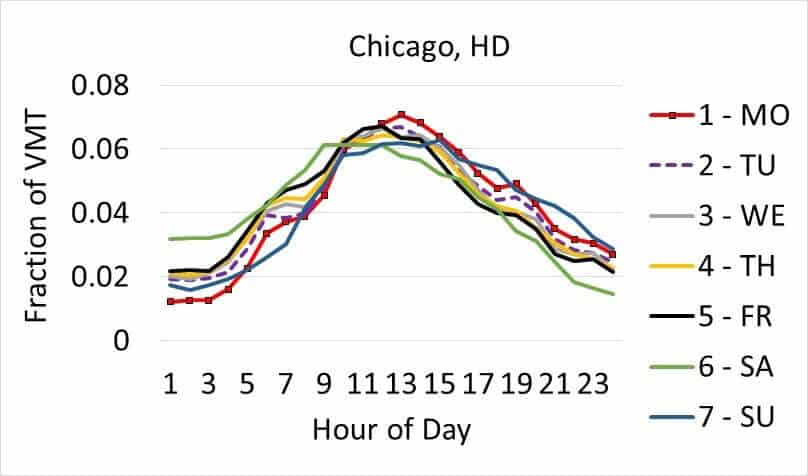
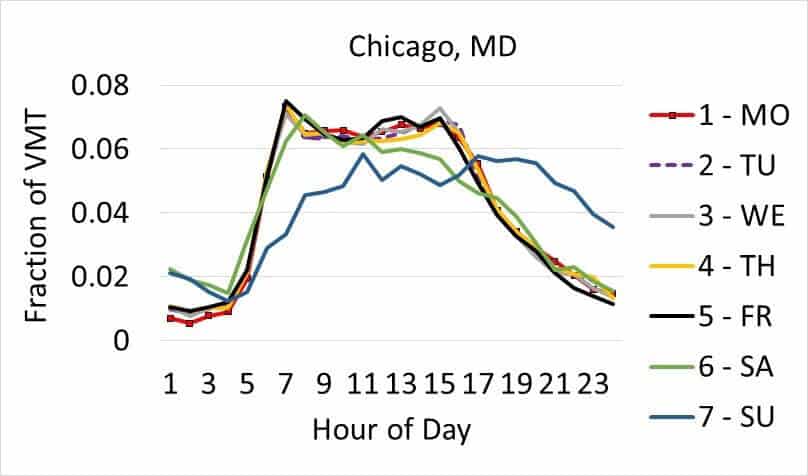
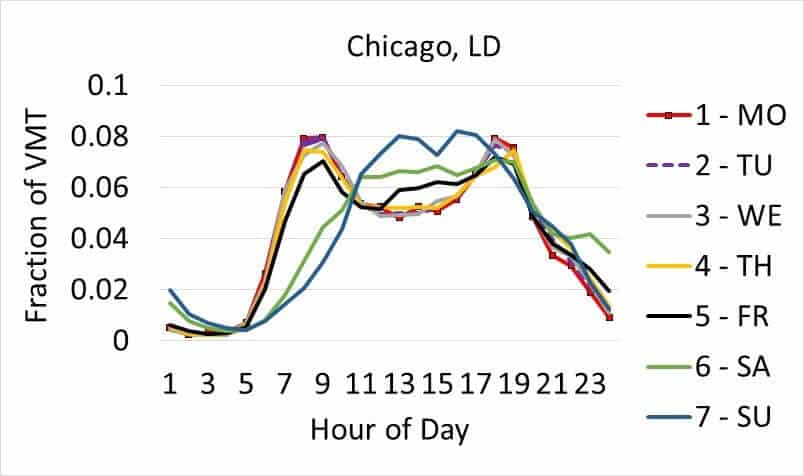
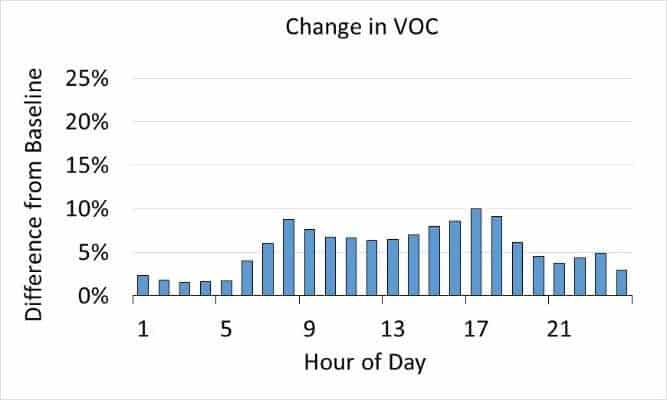
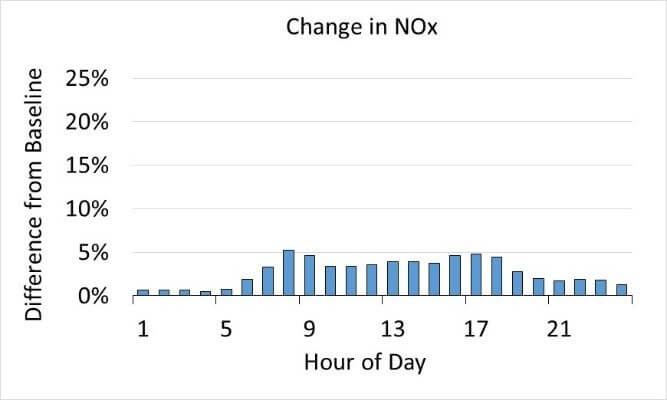
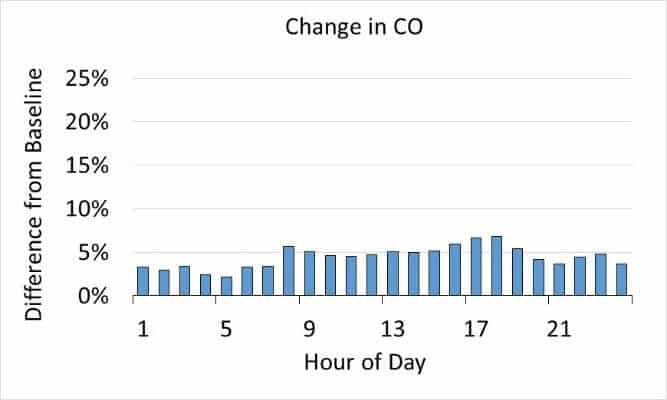
Finding different VMT distributions across the day was also a key goal. Some health-damaging emissions have a variable impact on citizens depending on time of day because folks are out and about at different times. Furthermore, the overall concentration of certain pollutants in the atmosphere depends on timing emissions released due to interactions with sunlight, mixing and dispersion from wind, and interactions with other chemical species that have established diurnal patterns. As shown in Figure 3 (below), different vehicle types and days of the week have very different load curves in terms of VMT.
Figure 3: The graphs above show the relative distribution of VMT by hour of the day for three different vehicle types in Chicago. This nuance matters as some health-damaging emissions will have more impact if they occur when people are out and about.
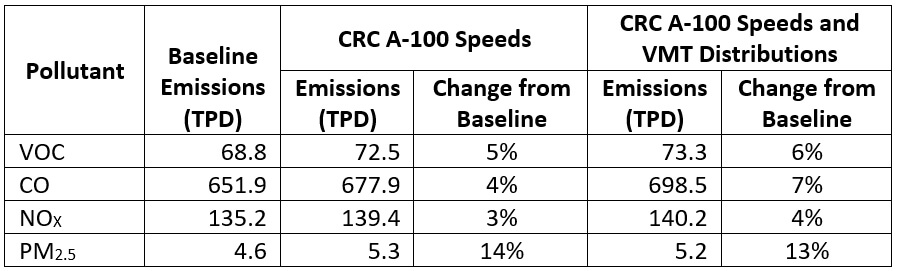
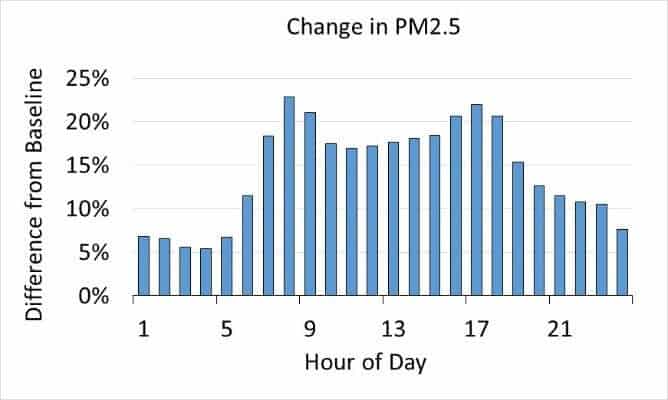
Overall, using the more granular Big Data had a big impact when the full MOVES simulation was complete. As shown in Figure 4 (below), Cook County probably would underestimate emissions, especially of PM2.5, if they used national averages. The hourly differences were especially significant, as shown in Figures 4 and 5 below.
Figure 4: This chart shows the difference in overall Cook County emissions when using the national default for VMT and speed vs. using StreetLight-derived inputs.
Figure 5: The graphs above show that hourly changes in emissions levels for Cook County changed more significantly than overall emissions when the improved inputs from Big Data were used in the MOVES.
Conclusions
NEI relies on MOVES inputs at the county level. However, national average defaults are used in many counties where data are lacking, especially for average speed. Using telematics data, such as that provided by StreetLight InSight, to obtain county-level inputs for average speed and VMT distributions in 2014 NEI v2 is an important step forward. This Big Data approach appears to be more robust in contrast to traditional sources of speed data (e.g., 4 Step Model), because of:
- Better spatial/temporal resolution
- Differences unique to individual cities
- Truck trends not seen in other datasets
This has a consequential impact on emissions for different counties, especially on hourly emissions trends.
How to Get the Data
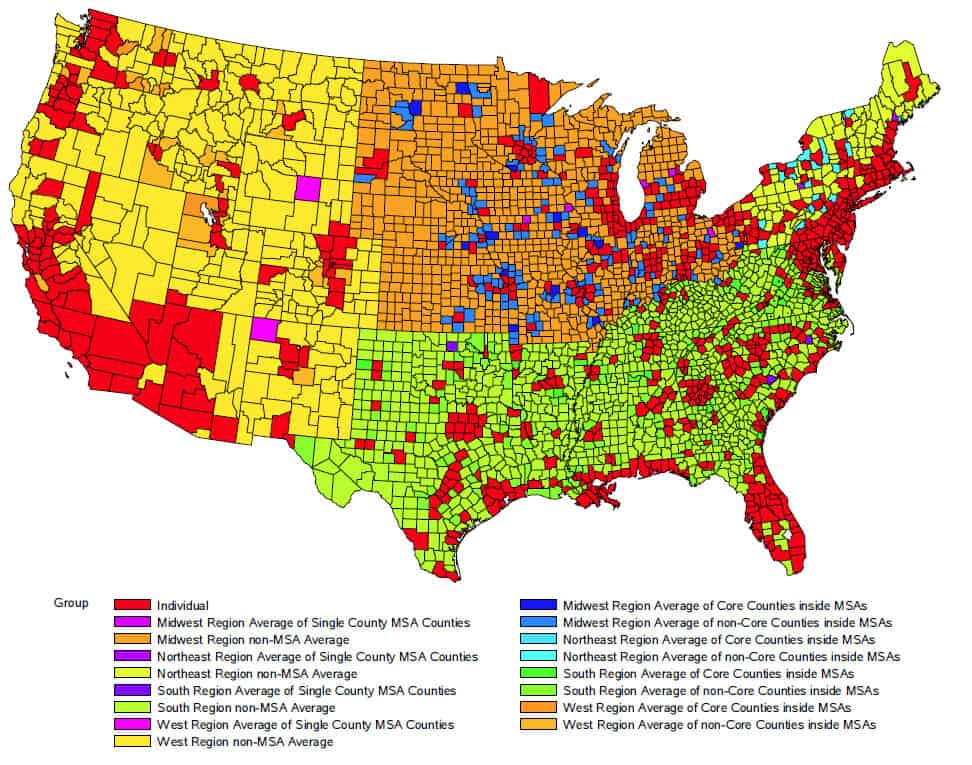
Thanks to the CRC, these new and improved county level input data, as well as more detail from this report, are available for counties either individually (red counties in Figure 6) or as a regional group (non-red counties) to use in both the MOVES model and the air quality model pre-processor known as SMOKE. You can access them at www.crcao.org. Counties can also work with StreetLight to create their own cuts of the relevant VMT and vehicle speeds.
Figure 6: For red counties, data is available for each county. For other colors, data is available as an aggregated group.
Note: This blog summarizes the findings presented at the MJO MOVES working group in March. This work was funded by CRC. The full report can be found here. The navigation-GPS used for this analysis was provided by INRIX.
Measuring Big Data’s Impact: Siemens SCOOT Adaptive Traffic Signal Control Technology
Measuring Big Data’s Impact: Siemens SCOOT Adaptive Traffic Signal Control Technology
Note: This is a guest blog post from Wendy Tao, the Head of Business Development and Strategy of the Intelligent Transportation Systems Group at Siemens Mobility. Wendy helps communities develop Smart Cities solutions related to advanced traffic management systems, adaptive signal control, connected vehicles and multi-modal applications.
From Intelligent Transportation Systems (ITS) to Massive Mobile Data, innovative technologies are tackling decades old challenges and creating new opportunities in the transportation industry. And it’s not just an idea. We’re seeing significant impacts derived from in-depth evaluations on project performance and cost-effectiveness. Siemens recently partnered with StreetLight Data to measure the impact of a Siemens’ SCOOT adaptive signal control implementation in Ann Arbor, MI. Our empirical before-and-after study showed that SCOOT can reduce travel times by 10 to 20 percent. The study used archival navigation-GPS data from connected cars.
Historically, measuring the impact of transportation infrastructure projects and policies has been difficult for public agencies and private companies alike. The high costs and complex statistical challenges associated with conventional travel data collection were the chief obstacles. Our Ann Arbor case study proves the value of ITS technology for reducing congestion, and it also demonstrates why performance evaluations are useful for a broad range of stakeholders. Companies like Siemens can benefit from knowing how well (or not) a project performs.
Why We Partnered with StreetLight Data
We decided to team up with StreetLight Data because very few before-and-after studies of adaptive traffic signal controls such as SCOOT have been conducted, even though the technology has been in use the 1980s. Unlike traditional signals, SCOOT responds dynamically to congestion (it stands for Split Cycle Offset Optimization Technique). Thanks to sensors located ahead of intersections and intelligent software at the traffic control center level, SCOOT can automatically adjust timing in response to real-time travel patterns. Although there we had plenty of anecdotal and qualitative evidence that SCOOT is effective, the majority of North American studies were conducted back in the nineties. The technology has matured significantly since then, so we wanted up-to-date, empirical evidence of SCOOT’s effectiveness – not stale data that described a much older product.
It was important for us to work with StreetLight Data for this study because travel behavior data was not collected prior to SCOOT’s implementation in Ann Arbor. Without a record of travel times prior to deployment, it would be impossible to measure the difference SCOOT made. Because StreetLight Data’s analytics are derived from archival data going back to January 2014, we could run analyses retroactively. In effect, we “went back in time” to gather information that we had no other way to obtain.
What We Learned
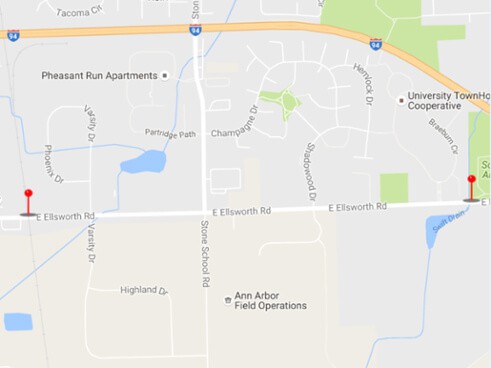
Using the StreetLight InSight® platform, the StreetLight Data team helped us run a corridor study that measured travel times down an Ann Arbor corridor before and after SCOOT was installed in November 2015. Figure 1 (below) shows how the study was set up.
Figure 1: The above map shows the 2-mile segment of Ellsworth Road that was analyzed in StreetLight InSight. We measured the duration of trips between the two pins. Ellsworth Road has a single lane in each direction, but it has high traffic volumes because drivers who want to avoid congestion on I-94 often use it as a bypass. Because Ellsworth Road is located near University of Michigan, it is particularly congested when special events are held on campus.
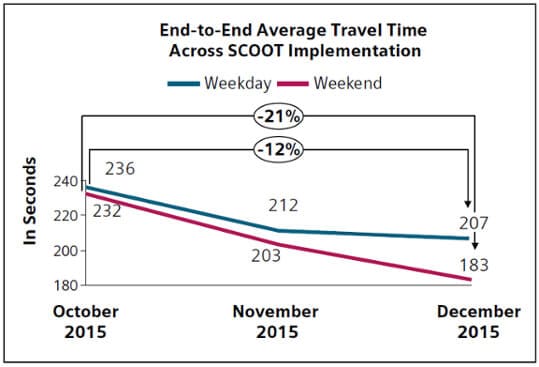
More than 11,000 complete trips traveling along the entire length of the 2-mile corridor were measured. An additional 30,000 trips that traveled along a portion of the corridor, but not from end to end, were also studied. As shown in Figure 2 (below), the before-and-after study showed that travel times improved by 10 to 20 percent depending on the type of day (weekends and weekdays were analyzed separately). The biggest difference was observed on weekends.
Figure 2: This chart was created using StreetLight InSight Trip Attributes Metrics, which include trip duration in seconds as well as trip length, trip speed, and circuity. Thanks to SCOOT, weekday trips along the corridor took 12% less time and weekend trips took 21% less time than they did previously.
The Value of Performance Measurement
For Siemens, the value of this project was clear. We now have recent, empirical evidence of SCOOT technology’s positive impact. It clearly demonstrates SCOOT’s advantages using measured, real-world trips. We’re optimistic that the ability to conduct timely and cost-effective studies should make governments more open to adopting these systems, since effectiveness and Return on Investments (ROI) can be more easily demonstrated.
These types of studies could also be useful to anyone implementing transportation policies, technology, and infrastructure who want to evaluate the impact of their work. Consulting firms are one example that comes to mind. These types of evaluations can also help the industry set benchmarks for success.
When we in the transportation industry evaluate project performance empirically, we can more reliably forecast the policies and projects that will make the most positive impact. With easy-to-understand, real-world data in-hand, transportation experts can more effectively build public support for their plans and more effectively lobby public officials for much-needed funding. Furthermore, these evaluations can help us conduct more accurate and complete cost-benefit analyses so cities can confidently allocate their taxpayers’ valuable dollars to the most beneficial projects.
But the ultimate beneficiaries of these types of studies are not companies or government entities – the communities that we serve who stand to gain the most in the long run.
Autonomous Vehicles, Big Data, and Our Transportation Future
Autonomous Vehicles, Big Data, and Our Transportation Future
Autonomous vehicles (AVs) are beginning to dominate much of the public conversation about our transportation future. This was certainly the case at South by Southwest, where I participated in an excellent panel discussion at the C3 Smart Mobility Showcase: “Smart Cities and Data-Driven Deployment of Autonomous Vehicles.” Nearly every single panel at the showcase was related to AV technology. People in that tent were very excited about AVs. However, I found myself thinking back to the 12-lane urban highway that my taxi driver took from my hotel to the event. The local bus would have taken over three times as long, and the drive reminded me that AVs are not a panacea for all that ails our transportation system.
Don’t get me wrong: Talking about AVs at an event like SXSW makes sense, and I’m glad we’re having these conversations. But I think the broader discussion around AVs needs to be focused on accountability. The impact of AVs could be very positive or very negative, as many transportation experts have suggested. In this blog post, I’ll explore how a data-driven approach can help us strike the right balance with AVs, and hold ourselves accountable for achieving a positive outcome for all.
I often imagine happily snoozing on the way to work in my self-driving “bed-mobile,” or “autonomous RV” – an “A-RV,” if you will. With my A-RV, I could live far from the city on a secluded mountaintop, but still easily commute to my job as the CEO of a tech company in San Francisco. It’s a pretty magical scenario: Quiet country living and a high-powered job, no telecommute required. But imagine if everyone who currently rides public transit into San Francisco like I do also started “driving” A-RVs instead. The result would be even more congestion than Bay Area residents face today – and traffic is already pretty terrible. Plus, I expect that this luxurious sleeping commute might be more available to CEOs than to waiters and teachers, who would suffer from the congestion.
What Our Transportation Future Could Be
Before considering accountability, let’s outline three potential outcomes of autonomous vehicles for our transportation future. Of course, these are largely simplified but they illustrate the trends:
- Transportation Utopia
Clean, electric, multi-passenger AVs shuttle everyone from point A to B in data-optimized carpools. They’re affordable and pleasant to ride in, all communities have equal access, and riders chat with their neighbors, building community cohesion. AVs effectively expand our public transit systems by linking up the neighborhoods that lack options today to workplaces and recreation. VMT goes down because people rarely ride in single-occupancy vehicles. Everyone benefits from reduced congestion, faster travel times, and streets that are safer to walk and bike on.
- The Status Quo Plus
A mix of privately owned electric and gas-powered AVs drive their owners from point A to point B. They travel alongside automated taxis, ride-hailing fleets, and public buses. Over time, congestion and VMT increase due to reduced cost of transportation. AVs operate on a consistent platform and excellent car-to-car communication prevents accidents, so our roads are safer. However, investment in rail and light-rail drops. Less-affluent communities that cannot afford to invest in AVs are more isolated, especially low-income residents. People walk and bike less, so obesity rates continue rising.
- Dirty Doomsday
Our roads are clogged with mostly gas-powered, car-sized AVs that circle city blocks endlessly looking for riders. While fewer car accidents occur, obesity and isolation continue to increase as single-occupancy AV ridership climbs. A dizzying array of AV software platforms that vary by manufacturer cause major car-to-car communication challenges. Systems are easily compromised by criminal hackers. A poorly managed roll-out has created a patchwork system of AV ownership. Affluent families purchase their own AVs vehicles while the less-affluent do without, often relying on aging transit systems.
Our jobs as transportation experts, civic leaders, and policymakers must be to put us on track to ride the wave of AVs as close to “Transportation Utopia” as we can. This will require education of citizens and leaders, alongside rigorous accountability relying on hard data.
A Data-Driven Approach to Accountability
Here are three ways that we can use data to ensure we drive the first scenario forward:
1. Measure What’s Happening Today
We cannot determine if AVs are moving us in a positive or a negative direction without a complete understanding of the status quo. Unfortunately, too many localities today lack the resources for regular, empirical travel studies, and they rely on infrequent and overly broad data sources that fail to account for the impact of new technologies on different neighborhoods.
Before rolling out AVs, communities must complete comprehensive, empirical transportation studies and reach a consensus on current travel behavior. They should zero in on the travel behavior in the topic areas that are most important to the community, such as:
- Equitable access to transportation
- Safety levels of particular streets and areas
- Current average VMT per day
- The corridors that are most congested
- Levels of public transit ridership
Planners and policymakers should then set goals for AVs to improve key metrics for each of their focus areas. As is typical for major planning initiatives today, communities should hold stakeholder meetings to ensure that community members share a common vision for AV deployment and agree on its goals.
2. Measure Persistently Over Time
As AVs are rolled out, the community should proactively monitor their impact on each of the previously identified focus areas, and track progress towards their established goals. This requires early, binding agreements with automakers and AV network providers to share data (in an appropriate manner) about usership. That’s something which has not happened with other technologies, such as ride hailing apps.
Local public agencies must be able to publicly report on the impact of AVs on a regular basis so that issues are uncovered quickly. This will help keep the community engaged in the AV roll-out. It will also help ensure that all stakeholders remain invested in the transportation future that meets their community’s needs. 3. Identify and Fix Problems as They Are Identified
Thanks to frequent monitoring of changes over time, transportation experts will know when AVs are not helping the community reach its goals – or are even causing a backward slide. Transportation planners can then act quickly to resolve these problems before they snowball, and learn from other communities’ successes and failures.
For example, if a community notices that AV adoption is causing increased congestion on a particular corridor, they could mandate that only AV shuttles be allowed to use that corridor instead of single-occupancy AVs. If there is an increase in accidents, they could pause the program to examine why accidents are on the rise, examine software and hardware issues, and prevent future accidents. But without a full understanding of the status quo and established goals, it will not be possible for communities to quickly identify potential problems.
How We Can Help
One of our top goals at StreetLight Data is to make it quick, easy, and affordable for communities to collect transportation data. Our Regional Subscription to StreetLight InSight® can reduce communities’ data collection costs by 50%. It makes comprehensively measuring travel behavior on a monthly basis a cost-effective option for public agencies.