COVID-19 is impacting transportation in unprecedented ways. Get empirical data for your geography from the safety of your home office and start diagnosing the situation.
Access on-demand Metrics to run these analyses from your computer
Vehicle volume trends
Assess changes in vehicle traffic during peak and off-peak hours
Changes in VMT
Understand VMT fluctuations and the potential impacts on budget funding and congestion
Urban to rural travel patterns
Study top routes to identify destinations for people leaving urban areas
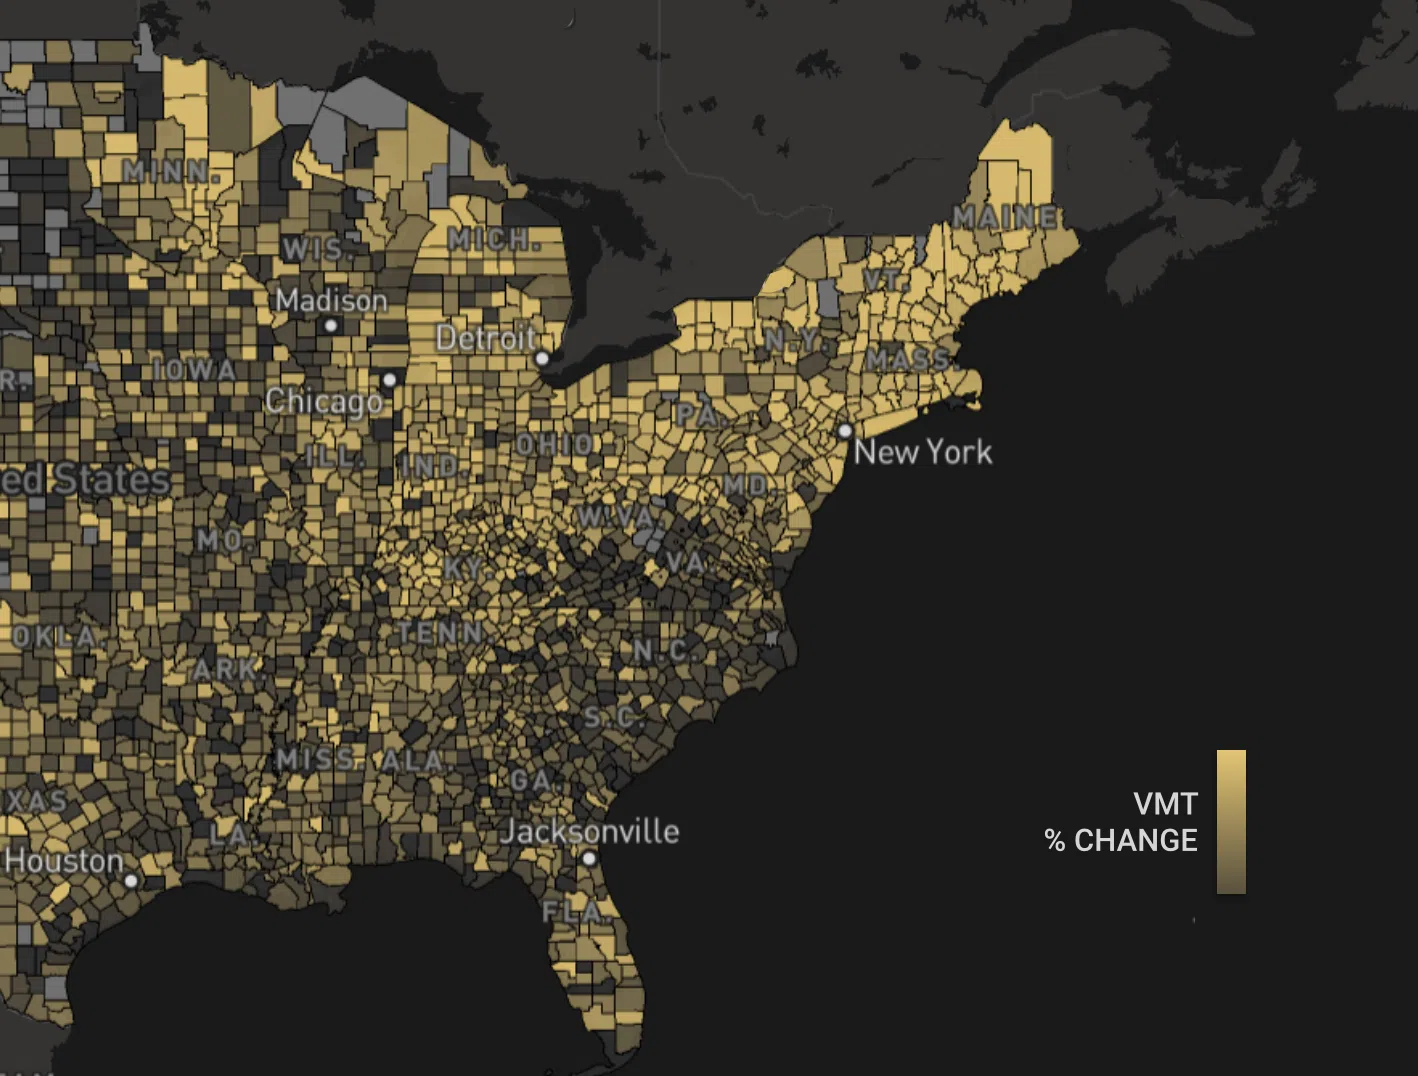
VMT Metrics shed light on daily travel fluctuations in your regions
Our vehicle miles traveled (VMT) Metrics inform travel demand forecasts, road maintenance planning, impact analyses, traffic mitigation, and analysis of greenhouse gas emissions, gas taxes and more. Subscribe to StreetLight InSight® to calculate VMT for any road or region. Or get county-level VMT for the pandemic period using our VMT Monitor.
Zone Activity analyses and Trip Attributes pinpoint activity in your community
Use StreetLight® to understand changes in mobility patterns in specific neighborhoods. Run Zone Activity analyses to see how communities are isolating and responding to the social distancing policies over time. Layer on traveler attributes such as inferred trip purpose and demographics to study which populations are impacted the most from an equity perspective.
GET STARTED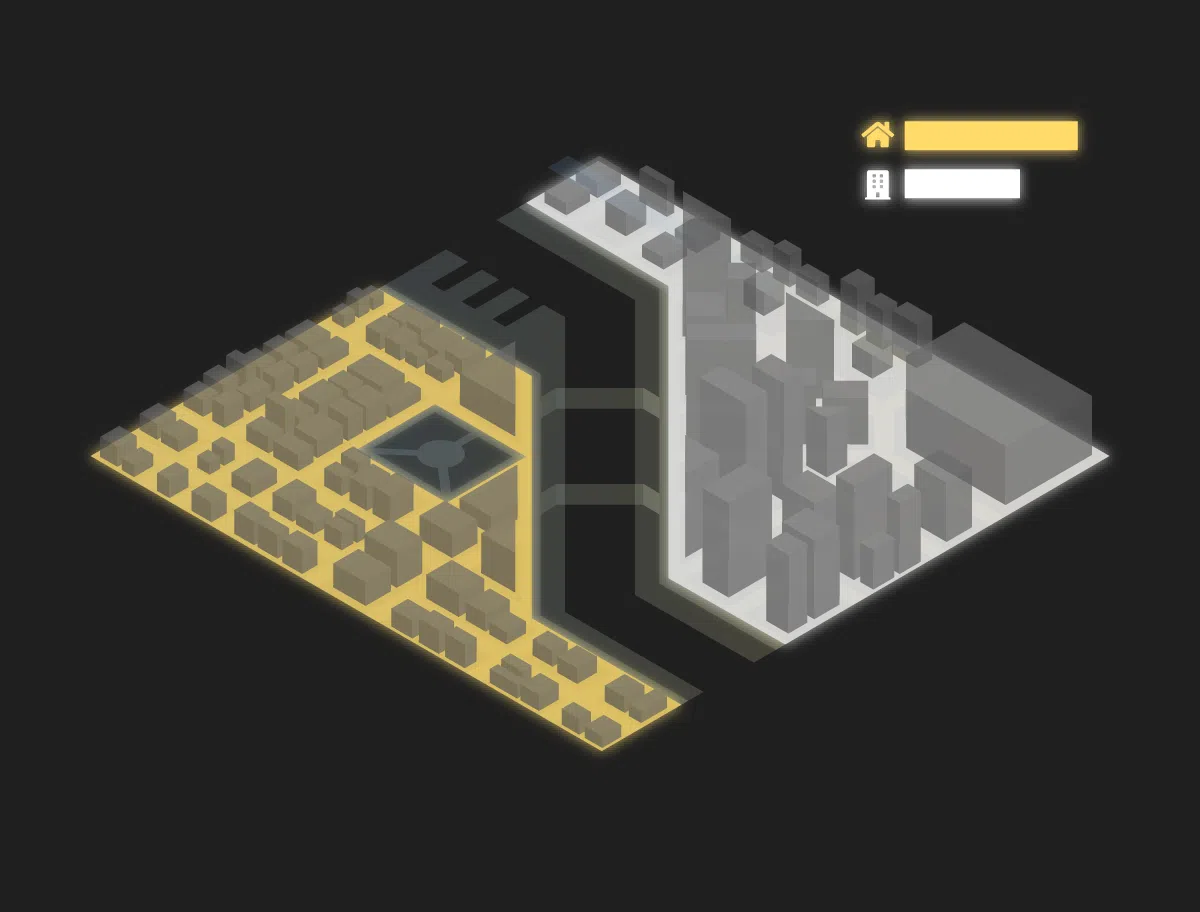
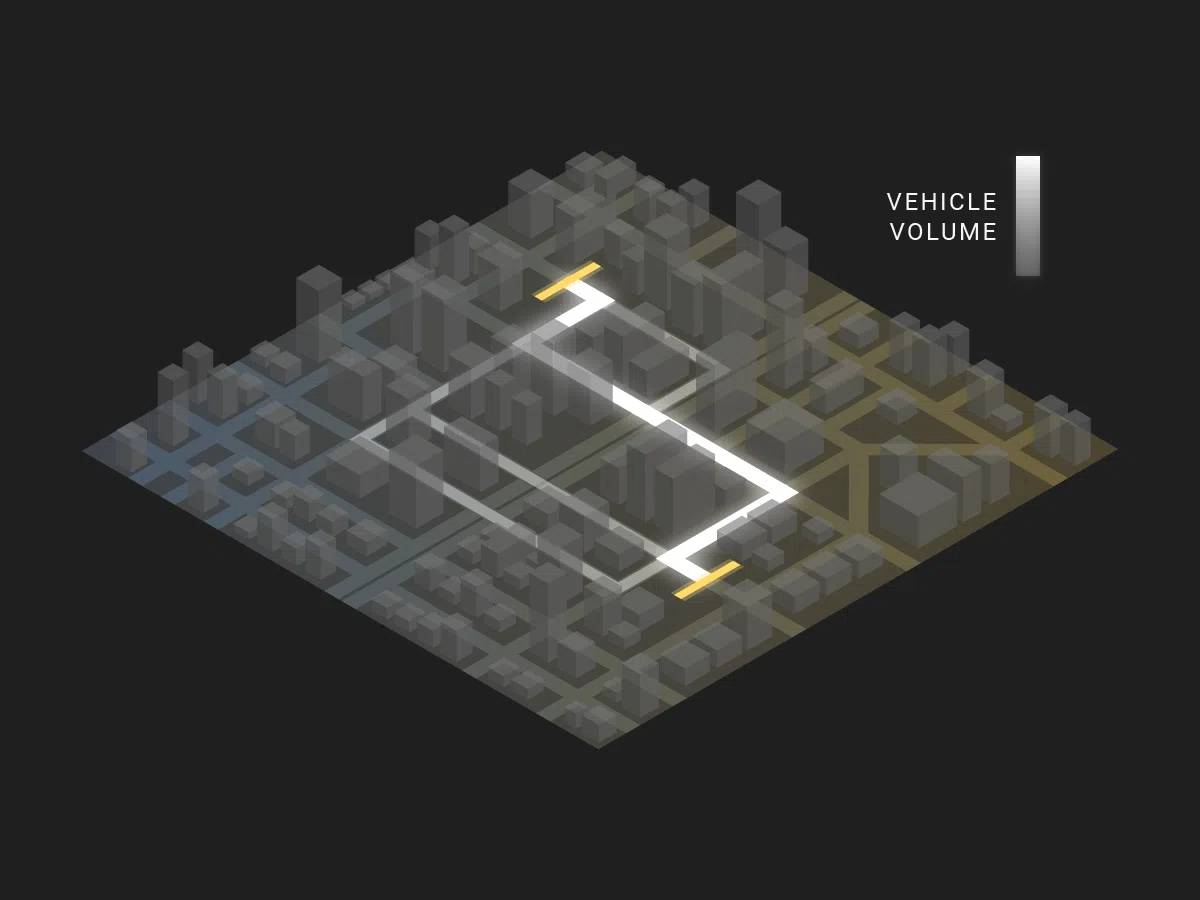
Origin-Destination and Top Routes analyses can shed light on public health insights
Study travel trends originating or ending at hospitals to project areas where patient populations may be coming from in order to understand how hospitals are serving specific communities. For cities that are converting event spaces and hotels into hospitals, use StreetLight® Top Routes Metrics to understand how people are getting to those locations.
GET STARTEDBefore and after studies help you analyze the unparalleled changes happening on roads, streets, highways, and more
Compare historical Metrics to activity today using Origin-Destination or Zone Activity analysis to understand how people are moving and driving economic impact of COVID-19. Pinpoint the reduction in traffic on toll roads, the decline in bridge traffic during commuting hours, and more.
GET STARTED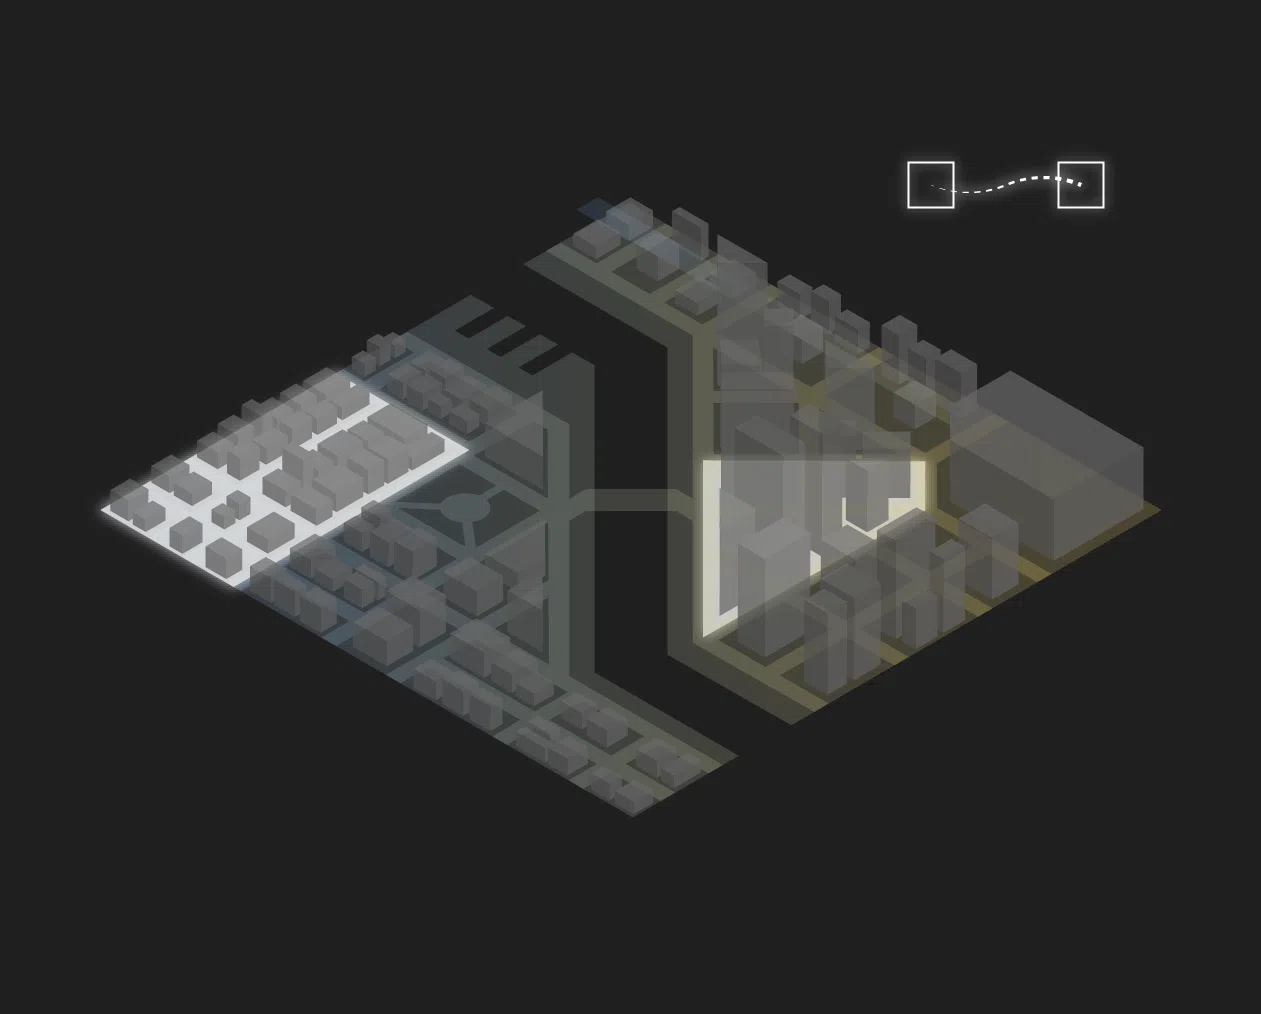
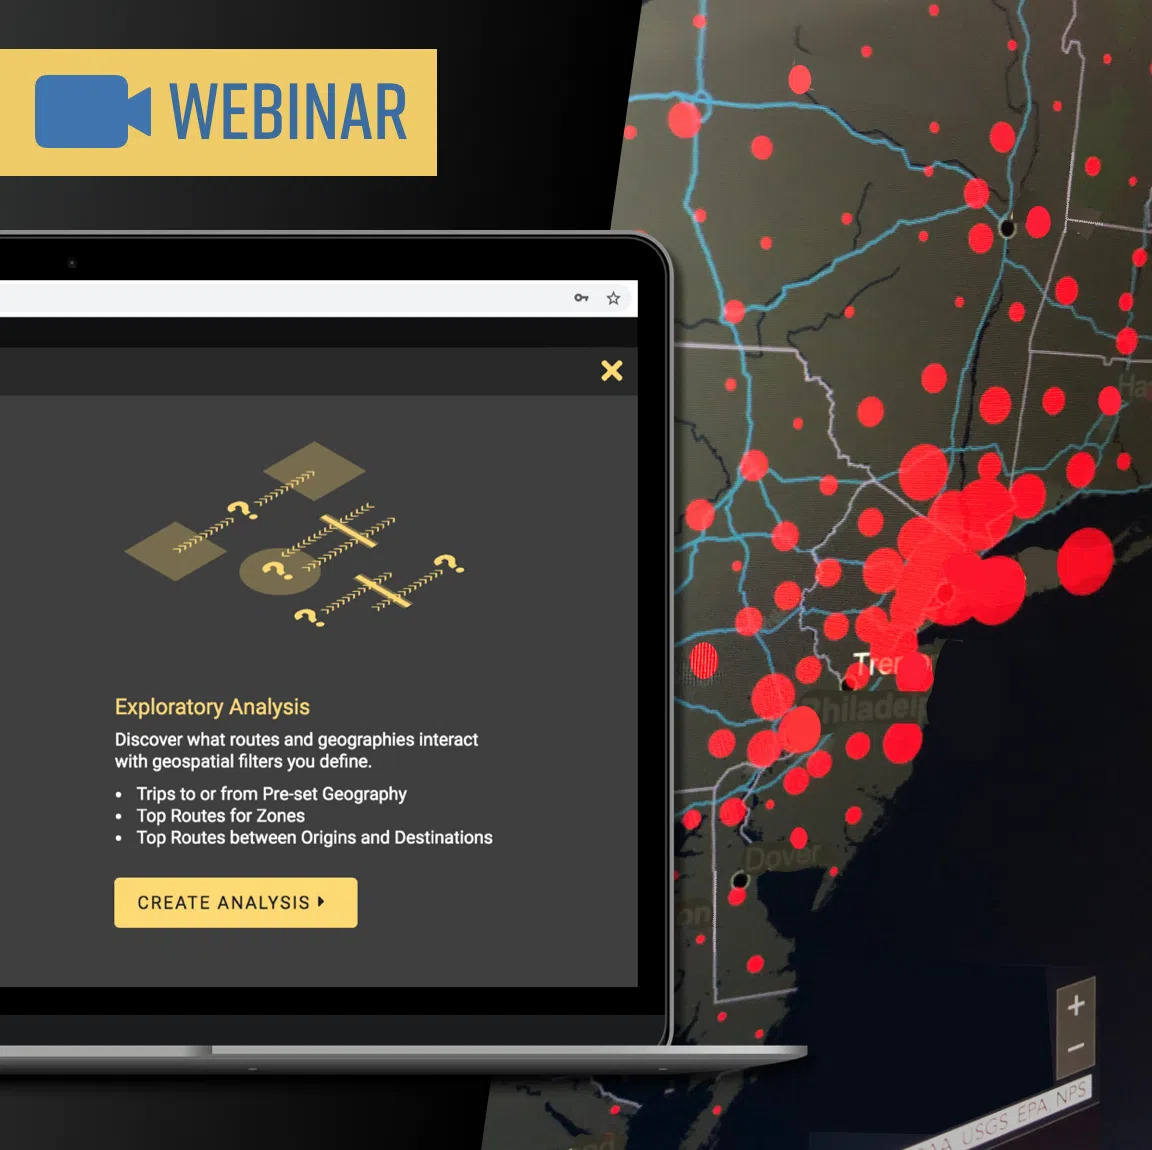
Use Big Data to Understand COVID-19's Impact on Transportation
COVID-19 is impacting transportation in unprecedented ways. Get empirical data for your geography from the safety of your home office, and study the impact of COVID-19 on traffic, travel patterns, toll revenues, and more.
Watch our webinar with Laura Schewel, CEO of StreetLight, to learn more.
Help cities adapt to new social distancing efforts by optimizing curbside pick-up
Analyze trends and activity around zones such as restaurants, grocery stores, or pharmacies in order to optimize delivery and curbside pick-up zones in accordance with required social distancing measures.
Talk to Us
Get on-demand data to empower your transportation decisions
