
Measuring Travel Behavior for Special Events: Who Goes to Warriors Games at Oracle Arena?

2017 has been a really busy year for the StreetLight Data Engineering team – and as Sr. Sales Engineer, I really appreciate their hard work. In today’s blog post, I’ll give you an in-depth introduction to one of my favorite new features in the StreetLight InSight® platform – “Customizing Your Own Data Period.” (For those that don’t know: StreetLight InSight is our easy-to-use web application for transforming Big Data into transportation analytics).
When we launched this feature, I was immediately reminded of the work I used to do at San Francisco Bay Area Rapid Transit District (BART), the regional heavy rail transit system that many Californians rely on everyday. Ensuring we had sufficient capacity in the system to accommodate special events was important – and it could be a challenge. We would regularly develop new service plans and even add special event trains to the schedule to deal with the crows and their unique travel patterns.
To show you how this new feature works, I’ll walk you through an analysis I did on home games for the Golden State Warriors basketball team in March 2017. I was working at BART at this time, and it was a big year for the Warriors – they won the NBA championship, and they also made a major decision to relocate from their home in Oakland’s Oracle Arena to a new venue in the Mission Bay neighborhood of San Francisco, California. That move is anticipated in 2019, and it promises to change the travel behavior of home game attendees.
Keep reading for all the details on our new Customize Your Data Period feature – and to find out about what the Warriors’ move might mean for travel patterns on game days in the San Francisco Bay Area.

Customize Your Data Period for Transportation Analyses
Here’s what our new feature means in a nutshell: You can now fine-tune your “Data Period” – that refers to the specific time period that you want to analyze – down to exact dates in StreetLight InSight. While this was always technically possible for our clients, it wasn’t convenient. They had to worked behind-the-scenes with our Engineering team to do it. If our clients wanted to run their own analyses in StreetLight InSight, the smallest data period available was a single month.
This new feature is incredibly useful if you’re trying to understand travel patterns for specific day or set of days, whether it’s a gameday, a holiday, or a natural disaster. It’s possible to get really precise analytics for that time period in just a few minutes with StreetLight InSight, and it’s really easy.
As always, you start by defining your Data Period in the Project Options menu located in the “Create Projects” Tab in StreetLight InSight. The first step is to choose the set of months that your specific dates fall in.
Next, you move to a new Tab that we just added to the Project Options menu: “Specific Dates”. Simply, you choose which specific days you want include or exclude from the analysis. (See Figure 1 below).
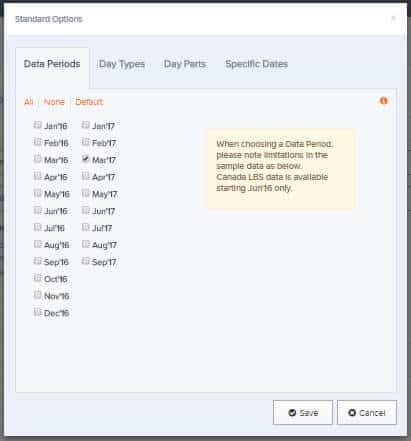
Figure 1: First, choose the months you want to analyze from the Project Options menu as shown in the first image. Then, choose the specific dates you want to include or exclude from the study.
As you can see in the Figure 1, I isolated five Warriors home games in March 2017 for this study. These games took place in the lead up to the play offs. I ran two studies with this Custom Data Period:
- Visitor Home-Work Analysis with Demographics using Location-Based Services (LBS) Data as my data source. This study provides aggregate home and work locations, census demographics, and the relative volume of visitors to Oracle Arena.
- Origin-Destination to Pre-set Geography, using Transportation Analysis Zones (TAZs) as my Pre-set Geography and Navigation-GPS Data as my Data Source. This analysis provides the origin and destination TAZs of vehicle trips to and from the Oracle Arena.
Visitor Home-Work Analysis
When looking at the Visitor Home-Work Analysis Project results, one of the first insights I gathered was that a lot of the attendees of these games live in the East Bay, closer to Oakland. However, the attendees are geographically distributed around the Bay Area, with folks distributed to South, North, and far East Bay, and relatively faraway towns like Modesto and Stockton. While there are some San Francisco residents travelling across the Bay to see games, I was surprised that we didn’t see higher numbers.
Figure 2: These are the aggregate home locations of Warriors game attendees in March. They are coming from all over the Bay Area but are concentrated in the East Bay. When I zoomed out the map even further in the platform, I saw ~<1% of attendees came from even further afield locations – towns in Arizona, Florida, and Las Vegas. These outliers would also appear in Metrics .CSV file downloads.
To see how these results compared to the typical day in March, I ran a second Visitor Home-Work Analysis for the entire month of March 2017. As you can see in Figure 3 before, the profile is different in a few key ways. First, the geographic reach is not as large. Fewer attendees are coming from the North, South, and far East Bay. Second, visitors are more concentrated in the Oakland area close to the stadium.
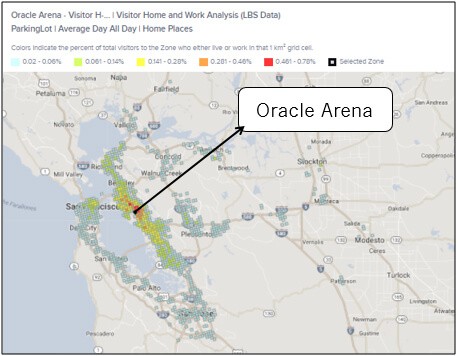
Figure 3: Aggregate home locations of all visitors to Oracle Arena in March ’17. They generally live closer to the Oracle Arena than game attendees.
Another interesting insight is that 75% of game attendees live or work 10+ miles from the stadium (See Figure 4 below). With the changes in location of the stadium, we would want to consider how those travel patterns would change.
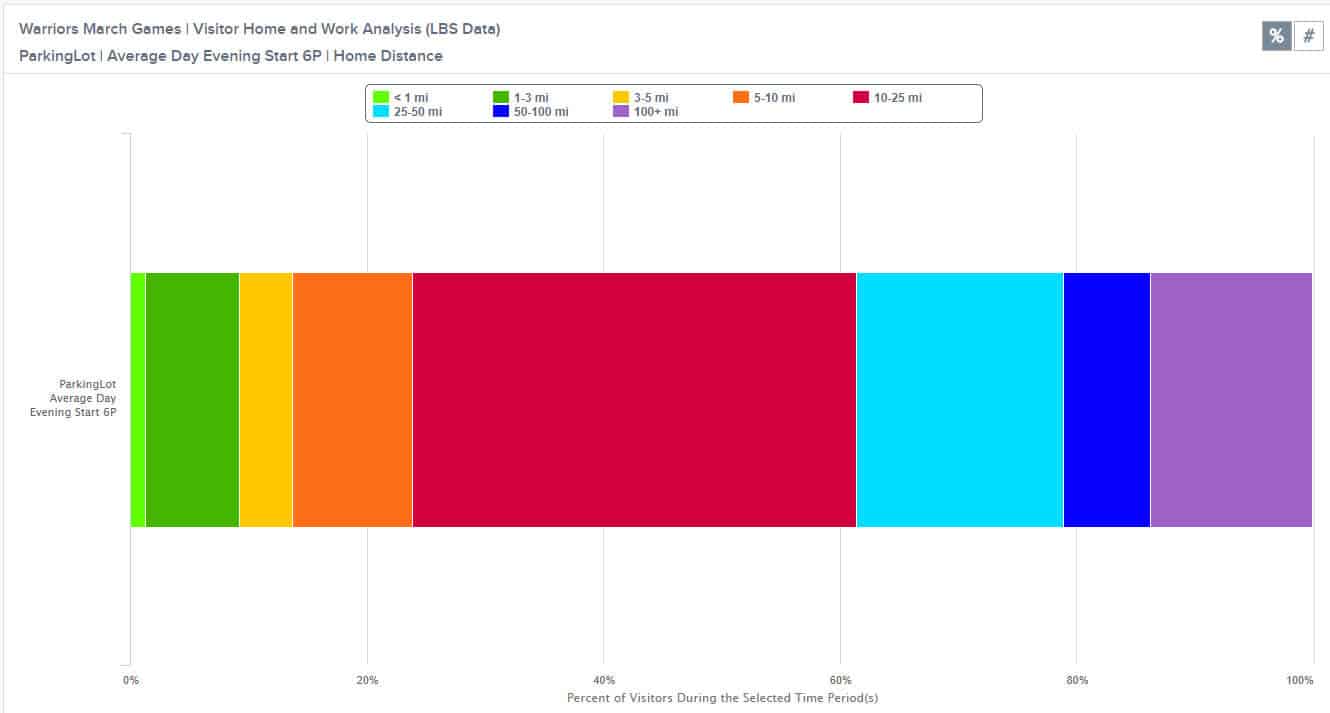
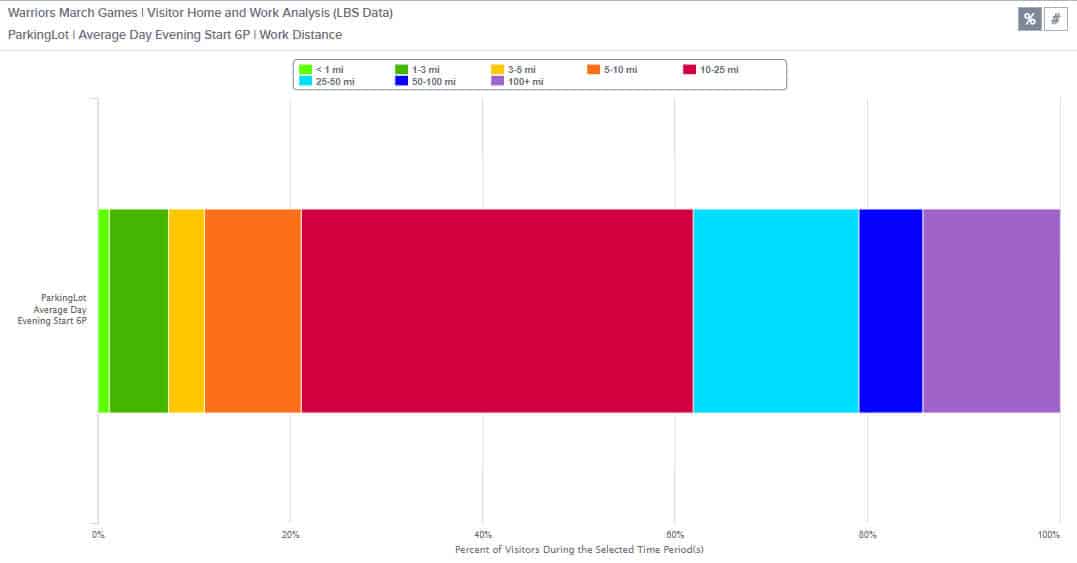
Figure 5: Distances of visitors’ home and work locations to the Oracle Arena on Warriors game days. As you can see, more than 75% of stadium visitors live or work over 10 miles from Oracle Arena.
What this means is that people are usually traveling long distances to get to these games. For the most part, these long-distance travelers are probably driving or taking BART (the regional transit provider) to the games. As shown below, typical March 2017 visitors to Oracle Arena live and work closer. Just over 60% are traveling more than ten miles from their home or work location to reach the venue compared to 75% of Warriors game attendees (See Figure 6).
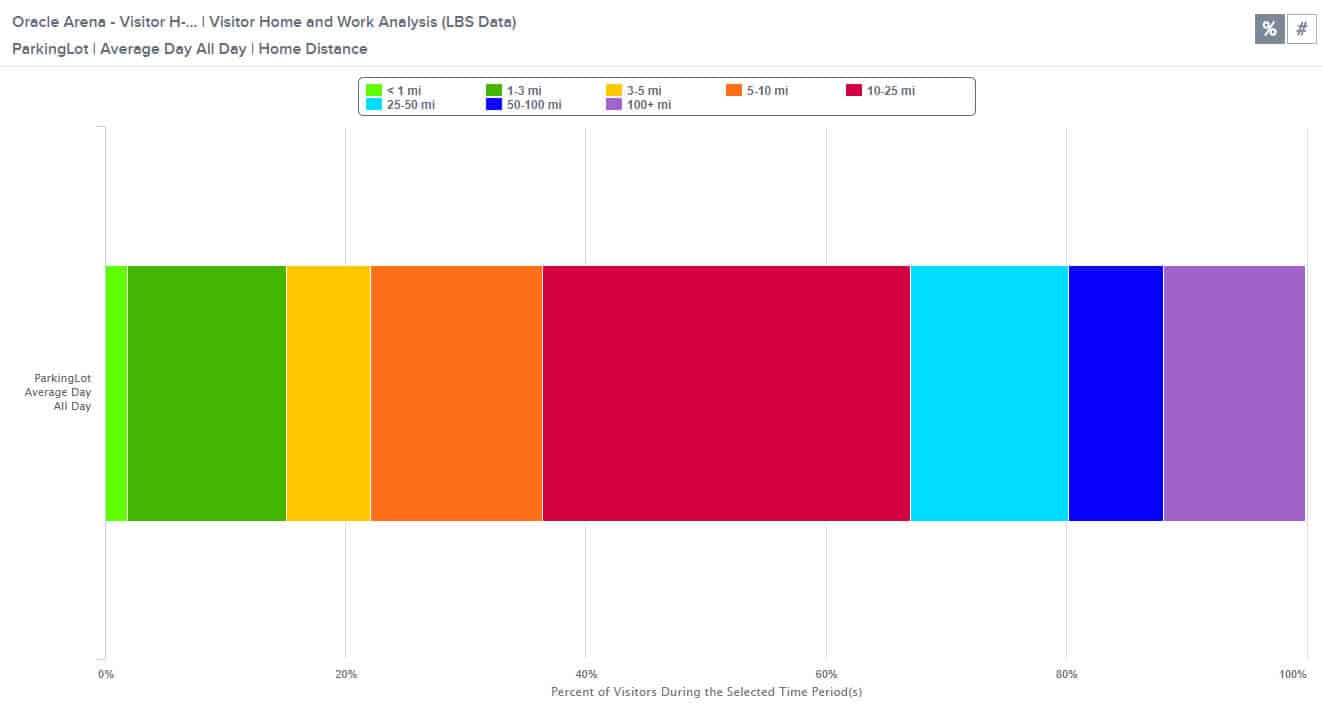
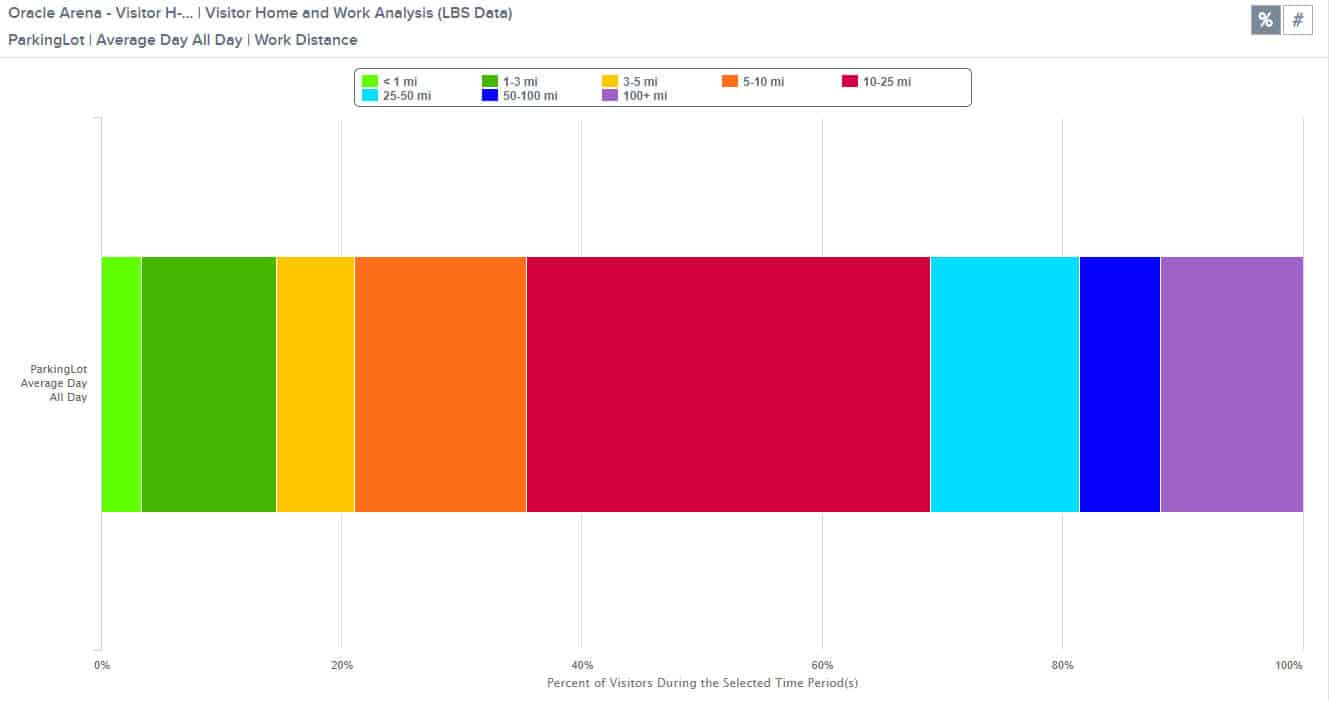
Figure 6: Just over 60% of attendees live or work more than 10 miles from Oracle Arena on the average day in March 2017.
Next, I decided to drill down on income levels (See Figure 7). Not only are Warriors games attendees geographically diverse, but they’re also economically diverse. If the stadium were to change locations, would this change as well? Would there be different income levels attending games in San Francisco? One factor to consider is that while the Warriors attendees income levels skew slightly higher than the typical attendee, the overall distribution is fairly similar (See Figure 8).
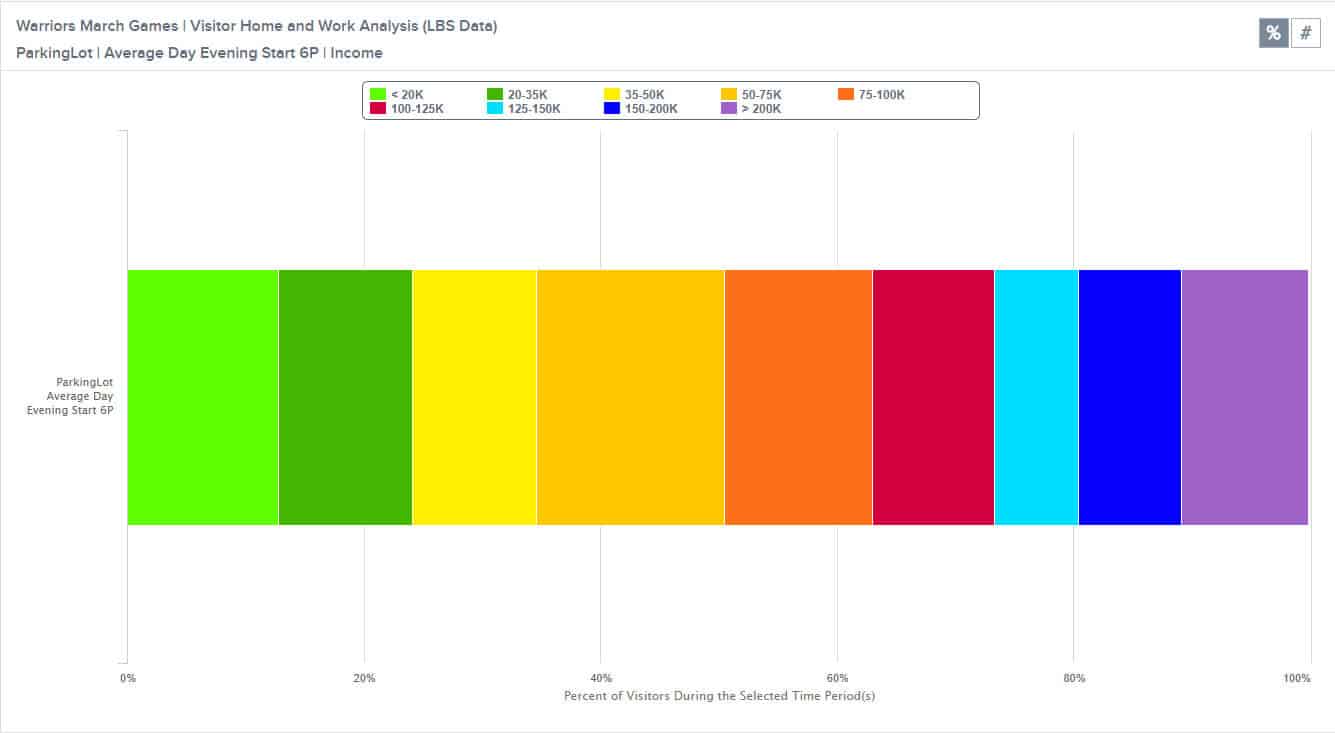
Figure 7: This shows the percentage of Warriors games attendees in each income bracket. It shows that there is a broad range of income levels among attendees.
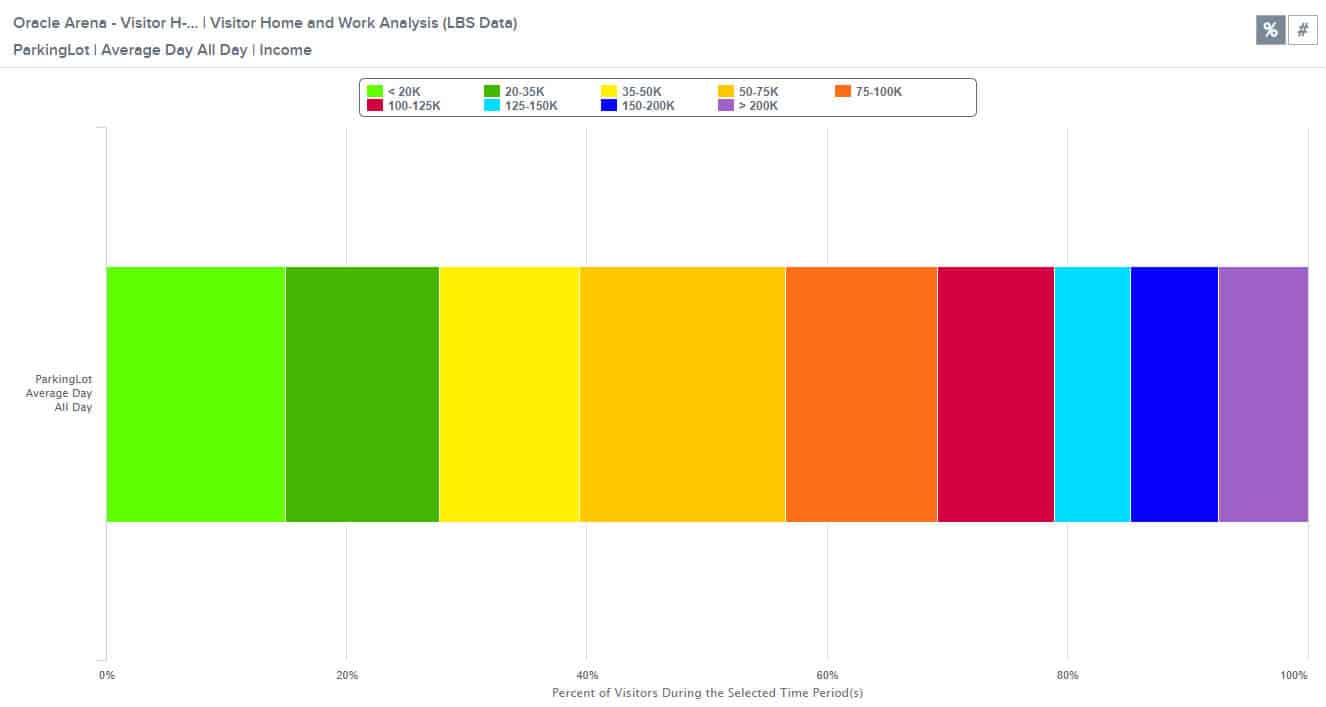
Figure 8: This chart shows the percentage of visitors in each income bracket for the Oracle Arena on a typical day in March 2017.
Origin-Destination to Pre-set Geography Analysis with Transportation Analysis Zones (TAZs)
I was also very interested to see who was driving to the stadium, so I decided to run an O-D to Pre-set Geography Analysis with TAZs and navigation-GPS data. Our navigation-GPS data is created by connected cars and turn-by-turn navigation tools, so it allows me to zero in on vehicle travel. You can see all the origin TAZs for game attendees in Figure 9 below.
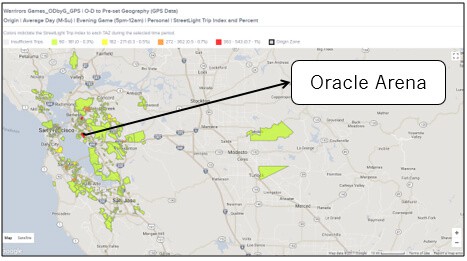
Figure 9: The heatmap above shows the origins of vehicle trips to Oracle Arena on Warriors game days in March 2017. While there are plenty of vehicle trips that make sense, a significant volume of vehicle trips are originating in areas with good transit options.
Some of these vehicle trips make a lot of sense. The drivers are coming from far away places that lack transit options – for example, it would be very time-consuming if not impossible to get to the stadium on transit from the Turlock area. However, there are also a lot of vehicle trips originating in places with great transit access (see Figure 10).
Figure 10: This is a zoomed in version of the heatmap in Figure 9. It shows the highest volume TAZs for vehicle trips to the Oracle Arena on game days. There are actually good transit options, including BART, in each of the red TAZs that light up for vehicle trips to the stadium.
I was surprised to see some areas that are on transit light up darker red. For example, San Francisco downtown has excellent transit to Warriors games, but it still lights up bright red. There’s also parts of the E. Bay with good transit options that lights up orange or red. While this is surprising, it’s also a good opportunity.
There’s clearly an opportunity to shift those vehicle trips to the arena over to BART or other transit options. BART could focus efforts on telling people in those areas to use BART as part of a highly targeted marketing effort. They would have a good chance of displacing at least some of those vehicle trips.
Customizing Data Periods: Putting it All Together
As you can see, the ability to customize our own Data Period down to the day in StreetLight InSight is really helpful for special events. I completed the entire process of setting up these analyses and running several studies in less than 30 minutes or so. The results provided a ton of useful insights that would be helpful for both managing travel patterns to home games at the Oakland Arena next year, and for identifying key focus areas and areas for further research in preparation for the team’s move to San Francisco.