
Planning Louisiana’s Bridges: 3 Big Data Case Studies
Big Data has become a flashy buzzword in the transportation industry: It’s a hot topic at conferences, and everyone is talking about the potential of new location data resources. But just talking about Big Data doesn’t accomplish anything. Here at StreetLight Data, we think it’s time to go beyond the buzzword. That’s why we tapped transportation engineers Thomas Montz and Luis Alvergue of Arcadis in Baton Rouge, Louisiana to share their experience using Big Data for transportation planning on our blog.
In the article that follows, Thomas and Luis will explain how they used StreetLight InSight® for three different bridge-focused projects in Louisiana. (New to StreetLight Data? StreetLight InSight is our platform for transforming locational Big Data from mobile devices into actionable transportation analytics.)
– The StreetLight Data Editorial Team
What Makes Big Data Useful to Arcadis
Let’s set the stage before we dive into the case studies. As traffic engineers, we typically start a project by analyzing traffic counts collected with traditional technology such as road tubes, video detection systems, radar, and other sensors. These are measurements that are taken at a point on a existing roadway, such as AADT counts, classification counts on interstates, turning moving counts at individual intersections, or peak hour factors. The studies we conduct to obtain traditional traffic counts are usually short-term, although this depends on the project location.
For example, some locations may not have a permanent count station (recording data 24 hours a day, 7 days a week) installed nearby. For a short-term count program, seven days is usually the maximum amount of time available to collect data with a tube count; however, the amount of time will vary according to AADT and travel conditions on the road. The amount of time it takes to receive data also varies, but it’s typical to wait one or two weeks for the results of a tube count since usually counts at several locations are collected at a time. Additionally, there is no guarantee that the tube stayed in place on the road the entire time or that it didn’t get ripped in a high-volume location, especially if it is a location with a large percentage of heavy vehicles.

In addition to traditional counts, we also use origin-destination matrices for our work. The typical method of gathering origin-destination data in the field is license plate matching. This requires photographing license plates in one location and matching them in a secondary location. This process is also constrained by short time periods for data collection and extended turn-around times for results.
So, what motivated us to use Big Data for these projects in the first place? We know traditional traffic counts and data collection methods can provide valuable information – for example, in-road sensors truly are the best way to get an extremely accurate count of the number of vehicles on a road. However, they do have their limitations. Big Data resources are exciting because they help us overcome those limitations in three specific ways:
- We expanded the amount of time for collecting data from ~7 days to 1+ years.
- We obtained results faster.
- The origin-destination analytics we obtained from Big Data are very robust.
In the case studies that follow, we will explain our process and the results of using transportation analytics from StreetLight InSight for three different initiatives.
Case Study 1: The Florida Avenue Expressway
Florida Avenue is a route being studied in New Orleans, Louisiana for a potential bridge upgrade. Arcadis was responsible for conducting an environmental assessment (EA) and engineering study for the bridge upgrade and possible extension of Florida Avenue from Chalmette, a suburb, into St. Bernard Parish.
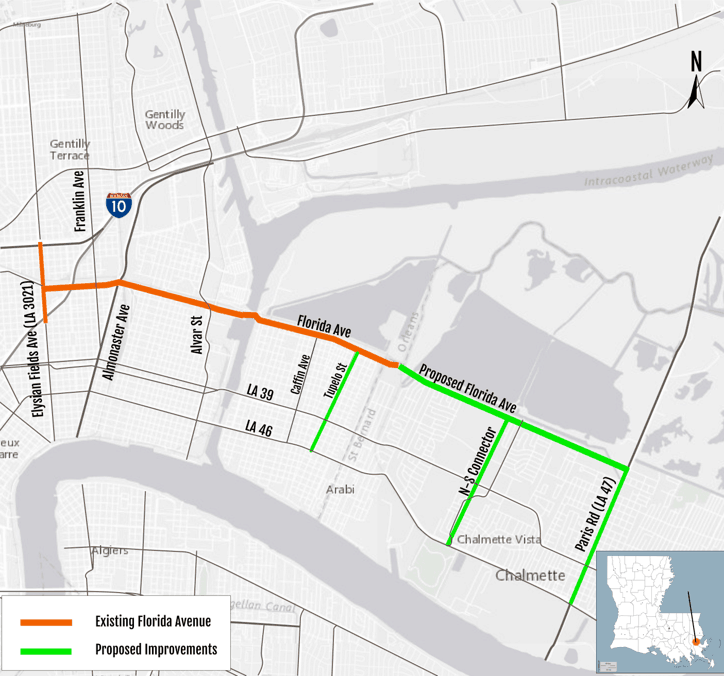
Figure 1: The route highlighted in the map above shows the existing Florida Avenue Expressway and its planned extension. (Image Courtesy of Arcadis)
The vision for the Florida Avenue extension is to create a more convenient and efficient route that connects New Orleans to Chalmette and other suburbs further south. This area is separated from New Orleans by the Inner Harbor Navigation Canal (IHNC), a channel that runs from Lake Pontchartrain to the Mississippi River. There are only three vehicular crossings over the IHNC today, the proposed improved route would run parallel to two existing routes: LA 39 and LA 46.
Our role was to evaluate the proposed improvements and upgrade of the Florida Avenue Bridge. To do so, we needed to answer several key questions:
- Where do users of the Florida Avenue Bridge begin their trips?
- Where do users of the Florida Avenue Bridge end their trips?
- What share of traffic does the Florida Avenue Bridge capture relative to the other bridges in the area?
To answer these questions, we ran two analyses in StreetLight InSight: An Origin-Destination and an Origin-Destination with Middle Filter Analysis. Our first step was to establish our analysis Zones as shown in the map below.
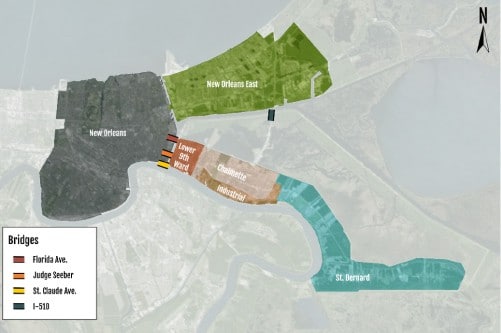
Figure 2: The map above shows the study area and analysis Zones for the Florida Avenue Expressway project. (Image courtesy of Arcadis)
We studied travel patterns on average weekdays during Peak AM and Peak PM periods using eighteen months of travel data, from January 2015 to June 2016. Using more than a year of data gave us a good understanding of average travel activity, especially because it included times of year when school is in session as well as when it is out of session.
Our first step was to look at origin-destination patterns for trips between all of the analysis Zones in our study. We broke out the percentage of personal and commercial trips that traveled between each origin-destination pair during peak AM and peak PM hours. The results confirmed that New Orleans was the most popular destination for personal trips from Chalmette. The study also gave us a better understanding of travel flows and activity overall in the study area.
Next, we analyzed the share of commercial and personal trips that used each bridge. The results confirmed that the I-510 bridge was much more heavily utilized by commercial vehicles than personal vehicles. This was a key insight for our study: There is an industrial area along the Mississippi River by Chalmette, so there was a lot of concern in the Ninth Ward area that improving the Florida Avenue bridge would funnel commercial truck traffic through local streets. The results showed that commercial truck activity is already focused on I-510, and suggested that it is likely those commercial trips will continue to use the I-510 route moving forward.
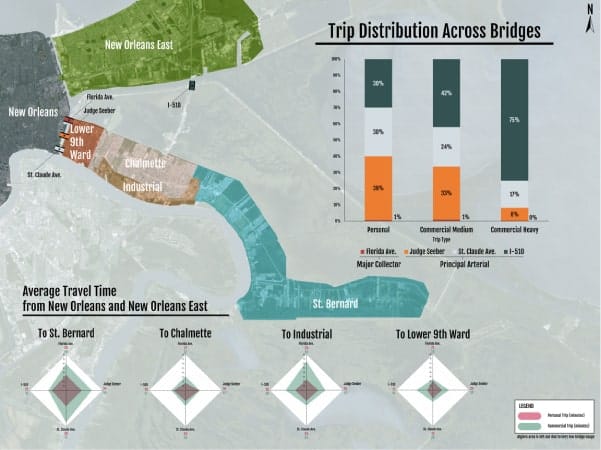
Figure 3: The charts above show the percentage of traffic and average travel times for trips across each these bridges. (Image courtesy of Arcadis)
Using Big Data analytics for this project was helpful not only for data collection, but also for communications. We shared StreetLight’s transportation analytics when engaging with the public and our clients, which was effective for both technical and non-technical audiences.
Case Study 2: I-49 Environmental Impact Statement
This project was for an environmental impact assessment for a proposed corridor that will extend an existing freeway to connect Lafayette, Louisiana and New Orleans. As shown in Figure 4, there are currently two routes between Lafayette and New Orleans: I-10, an interstate which includes the 18-mile Atchafalaya Basin Bridge, and US-90, a highway. The plan is to upgrade US-90 to an interstate-level freeway, I-49.
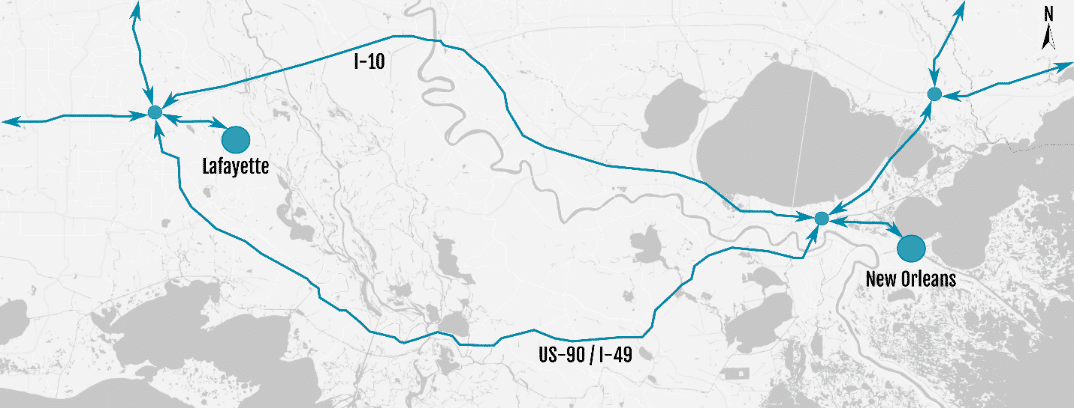
Figure 4: The map above shows I-10 and US-90, which both connect Lafayette and Orleans. The plan to upgrade US-90 to an interstate-level freeway is known as the I-49 Lafayette Connector Project. (Images courtesy of Arcadis)
Our goal was to determine the impact of the proposed upgrade on travel conditions. When a highway is upgraded to an interstate, you can usually expect drivers who currently use other routes to switch to the new interstate. This is due to “latent demand” (also known as “induced demand”) for the interstate. Our goal was to estimate the volume of latent demand for the upgraded US-90/I-49 corridor. Since we did not have a travel demand model available for this work, we turned to StreetLight Data to help us build a forecast.
To measure the volume of travel on both I-10 and US-90 between Lafayette and New Orleans, we used the StreetLight InSight Origin-Destination with Middle Filter Analysis. We used a whole year of data (every month in 2016) to obtain transportation analytics that describe travel conditions on an average weekday.
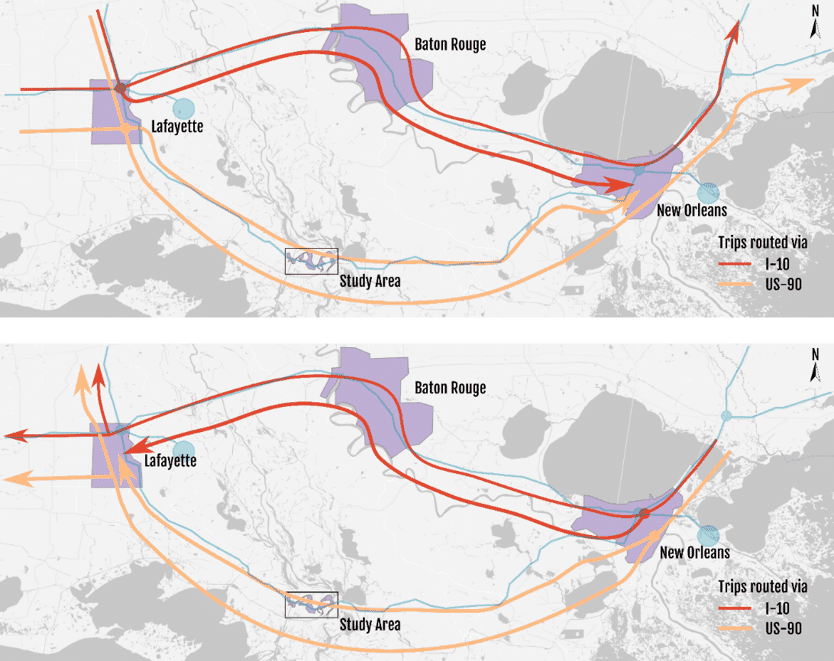
Figure 5: In the maps above, the red lines show traffic taking I-10. The Orange lines show traffic taking US-90. The arrows indicate the direction of traffic. The circles near New Orleans and Lafayette represent Origin and Destination Zones. (Images courtesy of Arcadis)
This analysis provided us with Metrics that describe the volume of trips on each roadway. Most StreetLight InSight Metrics are provided as index values by default: These values indicate the relative volume of trips on the road, not the exact number of trips. Therefore, our next step was to compare these index values to traffic counts. The counts came from 9 different permanent count stations along I-10 and US-90 that are operated by Louisiana DOTD. When we plotted those counts against the StreetLight Index, we saw a nice linear fit as shown in the Figure 6. Because there is a tight correlation, it was easy to scale the StreetLight Index to estimated counts.
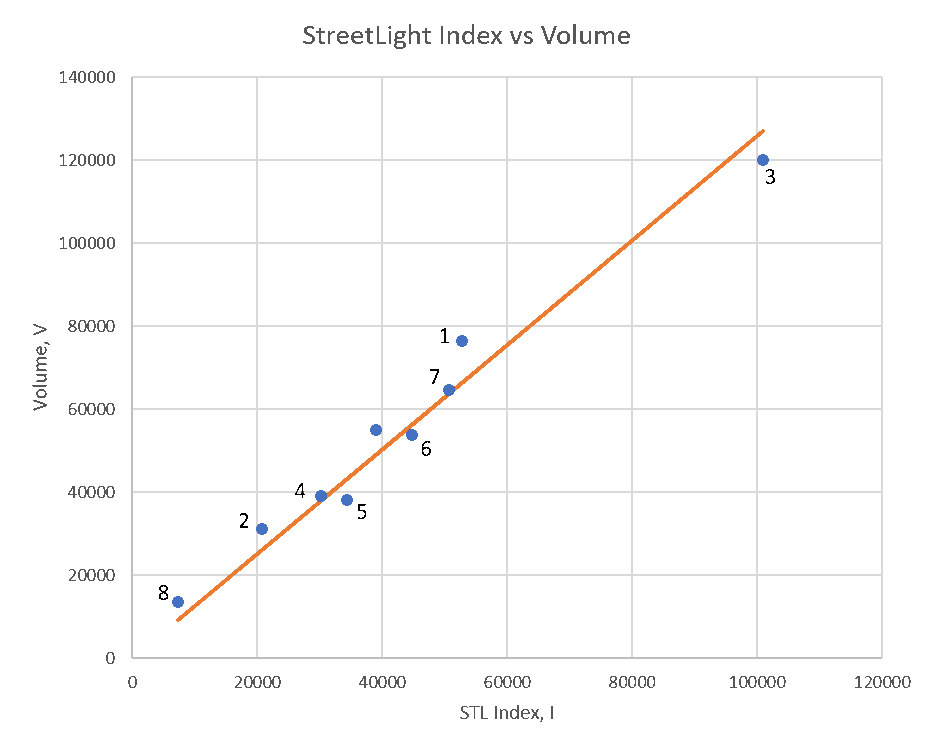
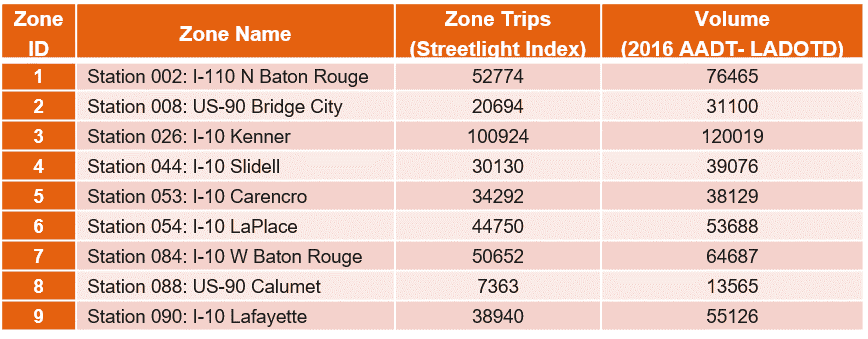
Figure 6: The graph and chart above show a tight linear correlation of StreetLight Index values and traffic counts provided by Louisiana DOTD for US-90 and I-10. (Images courtesy of Arcadis)
Overall, the transportation analytics revealed that about 88% of eastbound trips from Lafayette to New Orleans used I-10 and about 12% used US-90, as shown in Figure 7. A very similar proportion also hold for westbound trips, but we leave that out due to space constraints.
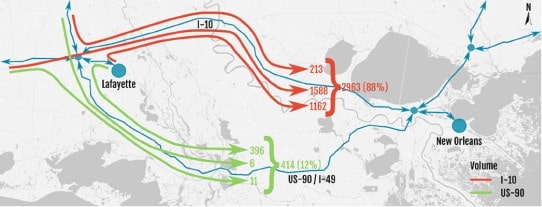
Figure 7: The figure above visualizes the number and share of trips that use US-90/I-49 and I-10 to travel from Lafayette to New Orleans. (Image Courtesy of Arcadis)
Based on the current breakdown, we expect that if US-90 is upgraded, we can reasonably estimate that roughly 30% to 40% of trips will use US-90/I-49 instead of I-10. Of course, this is simply an estimate or projection of future conditions. However, we are more confident in this projection of induced demand because it is informed by transportation analytics derived from real-world mobile device data – it’s not a random guess. With StreetLight Data’s analytics, we could make predictions about travel behavior even though we did not have a travel demand model.
Case Study 3: Mississippi River Bridge on I-10
This study was focused on a bridge located right outside of the Arcadis office in Baton Rouge. This bridge frequently becomes very congested during the peak AM and peak PM periods. As a result, the State has considered building an alternate route for this bridge. Our question for this very preliminary study was, “What is the best location for an alternate route? Where would it serve the most people?”
To do this, we ran an origin-destination analysis in StreetLight InSight. First, we drew Zones as shown in Figure 8. We wanted to determine the proportion of trips using the bridge that went to and from different areas of Baton Rouge, as well as trips that are just passing through the area. The goal was to better understand the most popular origins and destinations for users of this bridge.
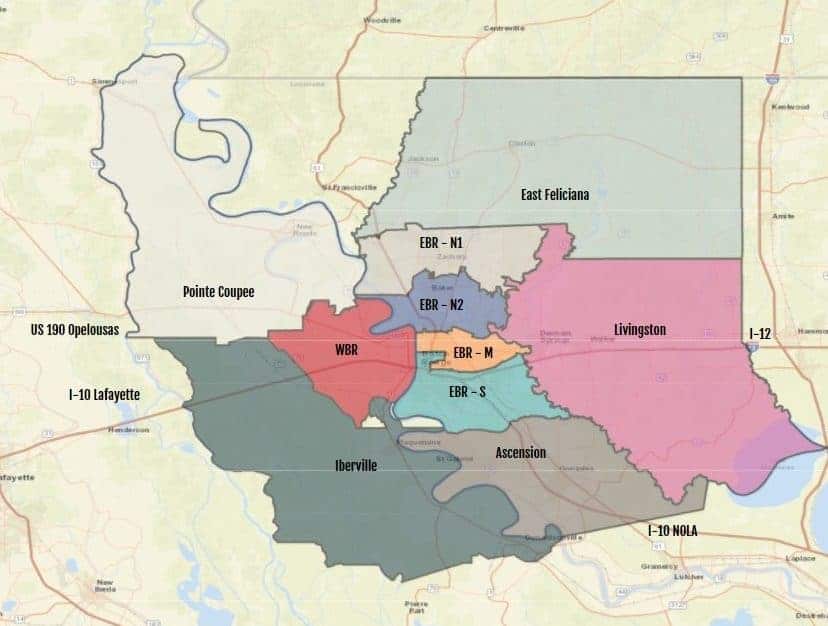
Figure 8: The map above shows all of the Zones analyzed in this Origin-Destination analysis. (Image courtesy of Arcadis)
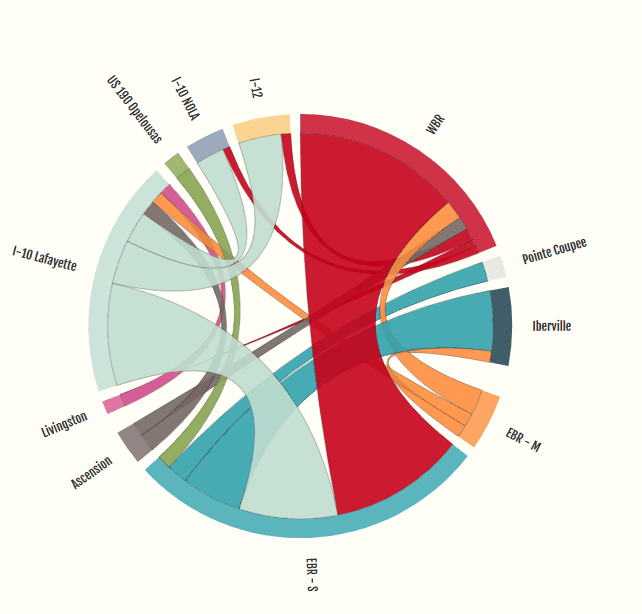
Figure 9: The chord diagram above shows the volume of trips on the bridge between each Origin-Destination pair. All of the Zones on the map are shown in the circumference around the circle. The width of the arc indicates the relative volume of trips between each pair. (Image courtesy of Arcadis)
The results indicated that most trips go from West Baton Rouge to East Baton Rouge. The next largest share is from trips starting west of Baton Rouge (traffic on I-10 coming from Lafayette) to East Baton Rouge. Pass-through traffic is the next largest share and then we see smaller flows between the other areas. Ultimately, the data and the chord diagram that we developed with the data are a good starting place for analysis of potential locations for a new bridge.
This also illustrates that, once you download all the transportation analytics and data that you need from StreetLight InSight, you can plot and visualize it in basically any want you want. You can use almost any type of visualization tool, which provides transportation engineers with a lot of flexibility for analyzing results.
Conclusion: Putting Big Data To Work in Louisiana
In sum, StreetLight InSight analytics provided important insights for these three bridge-focused projects that can help guide transportation planning efforts. We hope that this article has helped illustrate a few practical ways that you can use Big Data for transportation planning. If you’re interested in exploring these projects in more detail, you can watch our recorded webinar on this topic here.
About Our Guest Authors:
Thomas Montz, PE PTOE PTP, and Luis Alvergue, PE, are both based in Baton Rouge, Louisiana where they work for Arcadis, a “leading global design and consultancy firm for natural and built assets.” Thomas currently serves as an Engineer and Project Manager specializing in traffic analysis, transportation modeling, and intelligent transportation systems. He holds a BS and an MS in Civil Engineering from Louisiana State University. Luis currently serves as a Transportation Engineer. He holds a BS in Engineering from McNeese State University as well as an MS and a PhD in Electrical Engineering from Louisiana State University.