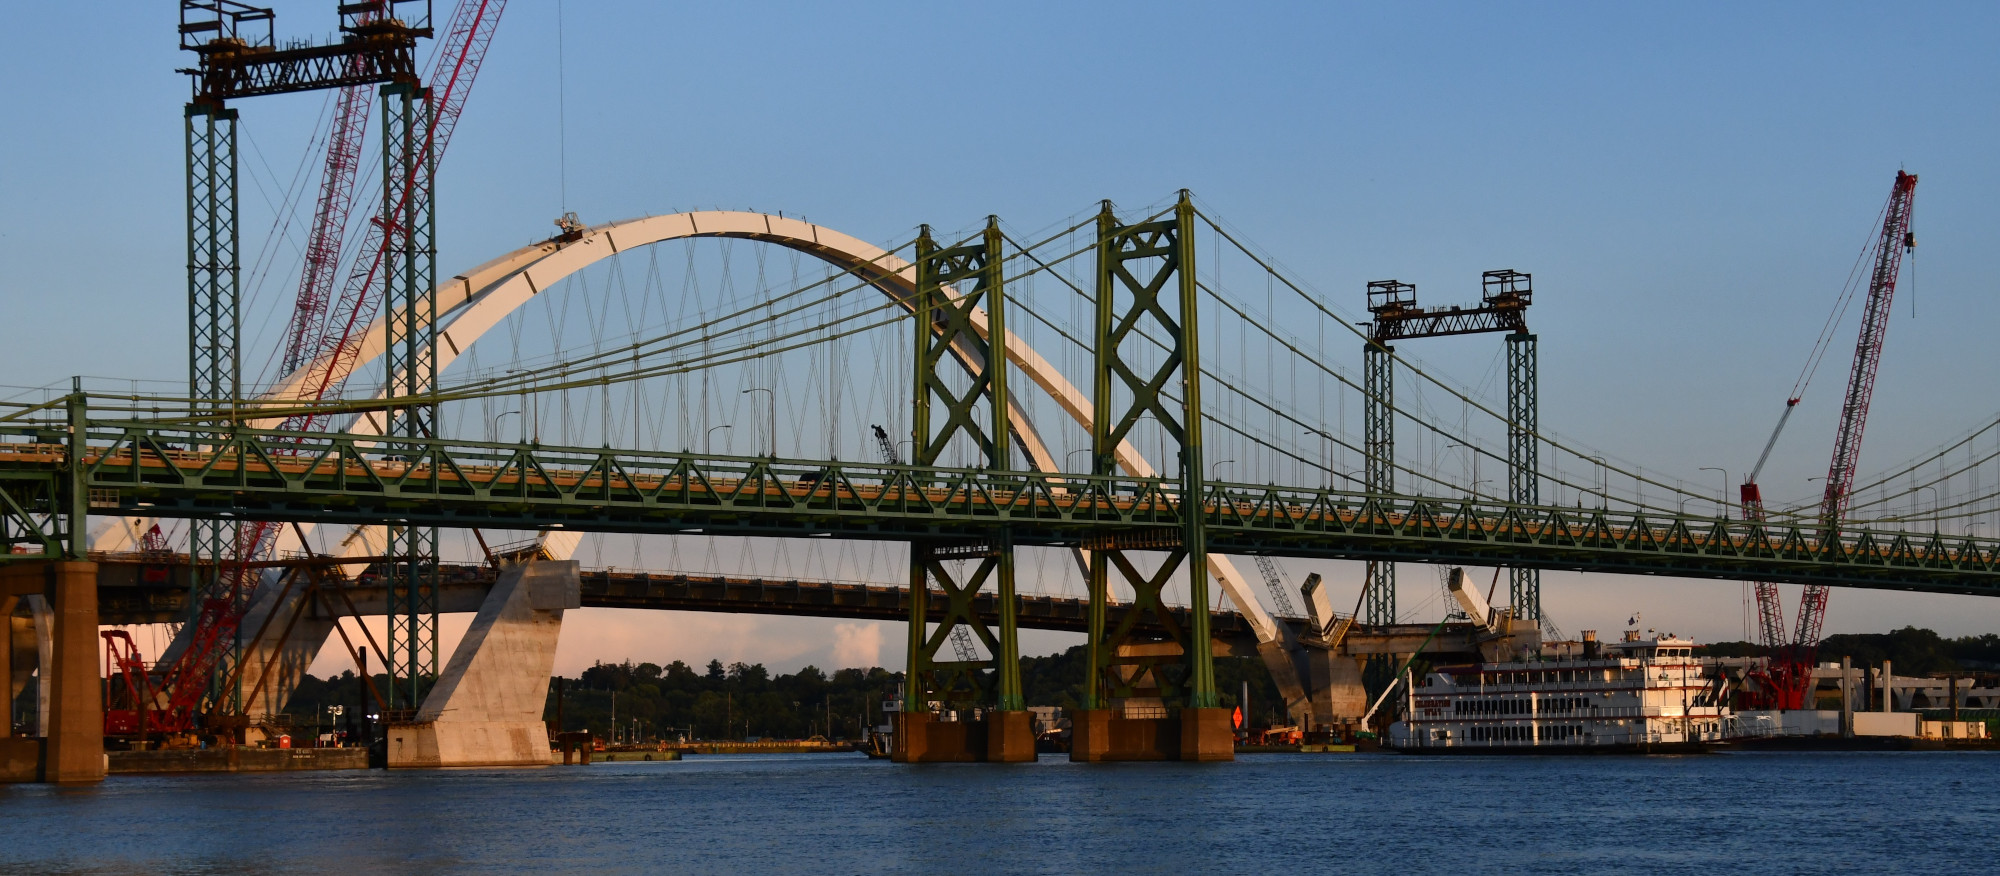
After moving to Davenport, Iowa, a month ago, I started exploring the area with trips southeast across the Mississippi River to Moline, Illinois. The drive is only five miles one way, but the massive I-74 bridge construction project creates some detour challenges, and this sparked my curiosity. A few minutes in StreetLight InSight® answered my questions about where traffic was detouring (surprise: not the suggested route), and what impact that might have for several of the other aging bridges across that section of the mighty Mississippi.
One lane of the new bridge is open now, but when I first moved to the area there was a detour both ways. Going southeast, to Moline, the suggested detour was easy to take. On the way back, however, my GPS always avoided the suggested detour, and sent me across three different bridges for the return northwest trips to Davenport.
I wasn’t the only one. My analysis showed that local trips were taking the I-74 detour southeastbound to Moline, but northbound trips to Davenport via the recommended detour dropped by ~17%. These northbound trips seemed to be primarily distributed between the Centennial and Arsenal Bridges.
The Arsenal Bridge is particularly interesting because the published AADT from Iowa DOT (IDOT) for the bridge is 7,500, which means more than 1,200 northbound trips crossed the Arsenal Bridge daily. Understanding the increased wear to a bridge like the Arsenal can be important, as it is an older bridge built in the late 1800s.
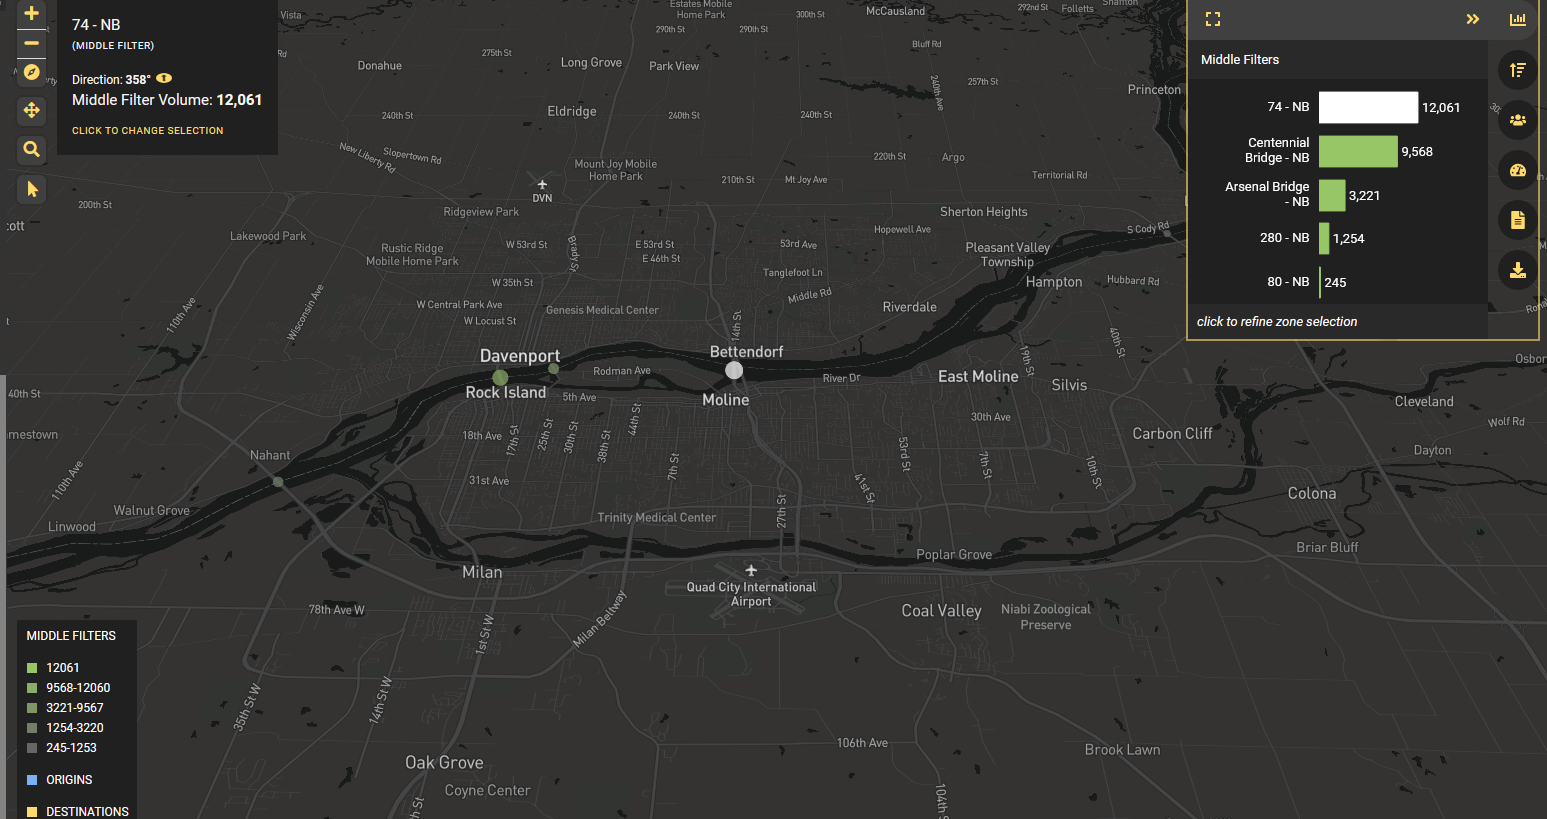
Figure 1: Using StreetLight InSight® to select origin and destination zones for analysis.
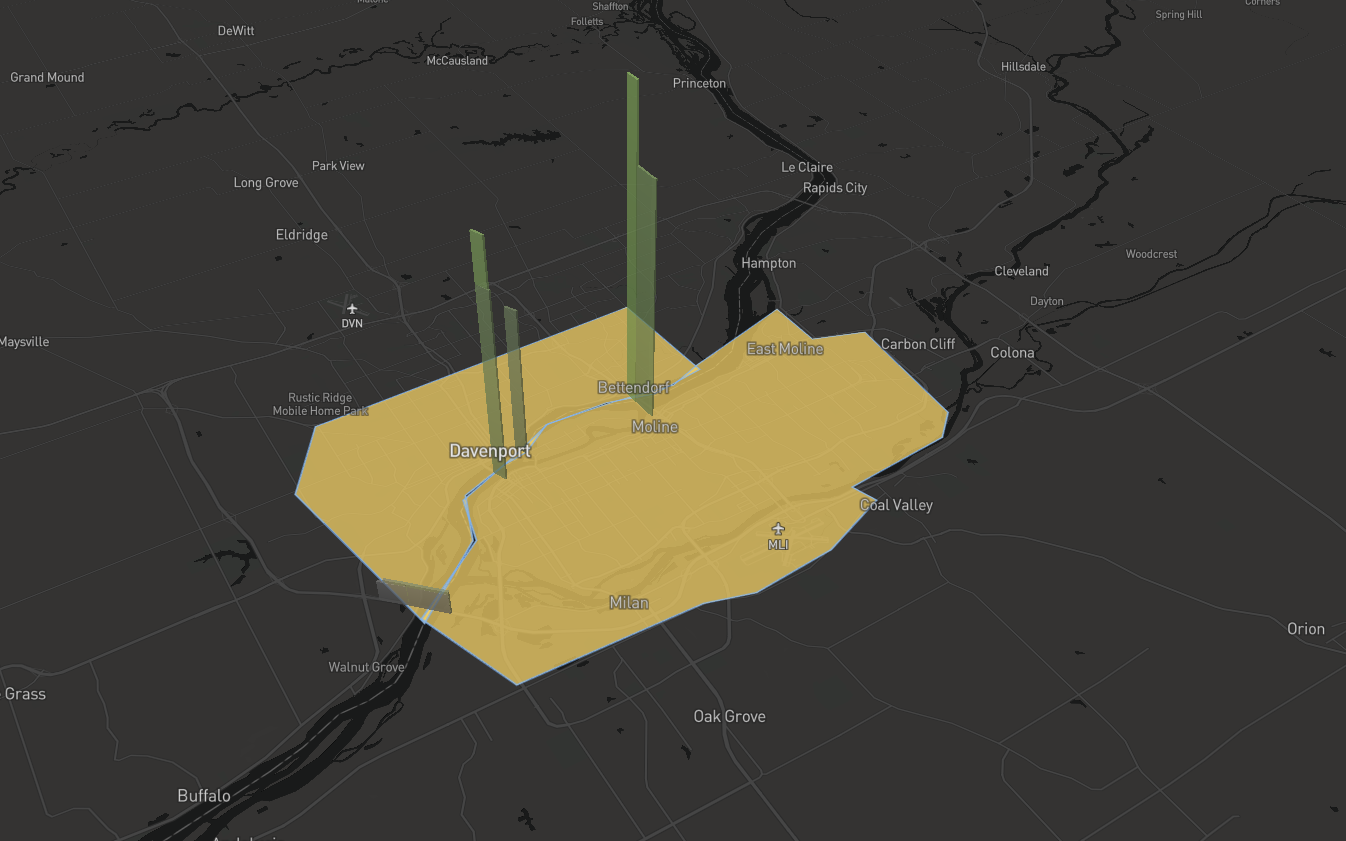
Figure 2: Middle filters on the bridges between origin and destination zones capture travel across each bridge.
To run the analysis, I geofenced the Moline and Davenport areas to identify local trips, adding the bridges to identify all alternate routes taken. Moline and Davenport were used as origins and destinations, and gates on the bridges were used as middle filters.
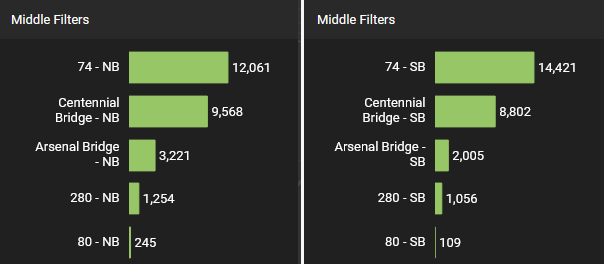
Figure 3: Statistics for northbound and southbound travel via five middle filters.
On the left are northwestbound movements affected by the poor detour access and on the right are southeastbound movements. Looking at a typical weekday in 2019 (to capture average traffic pre-pandemic), there are about 2,500 northwest trips displaced to other bridges to avoid the detour. These vehicles are choosing routes that add miles to their trip distance, potentially adding more congestion on local roads.
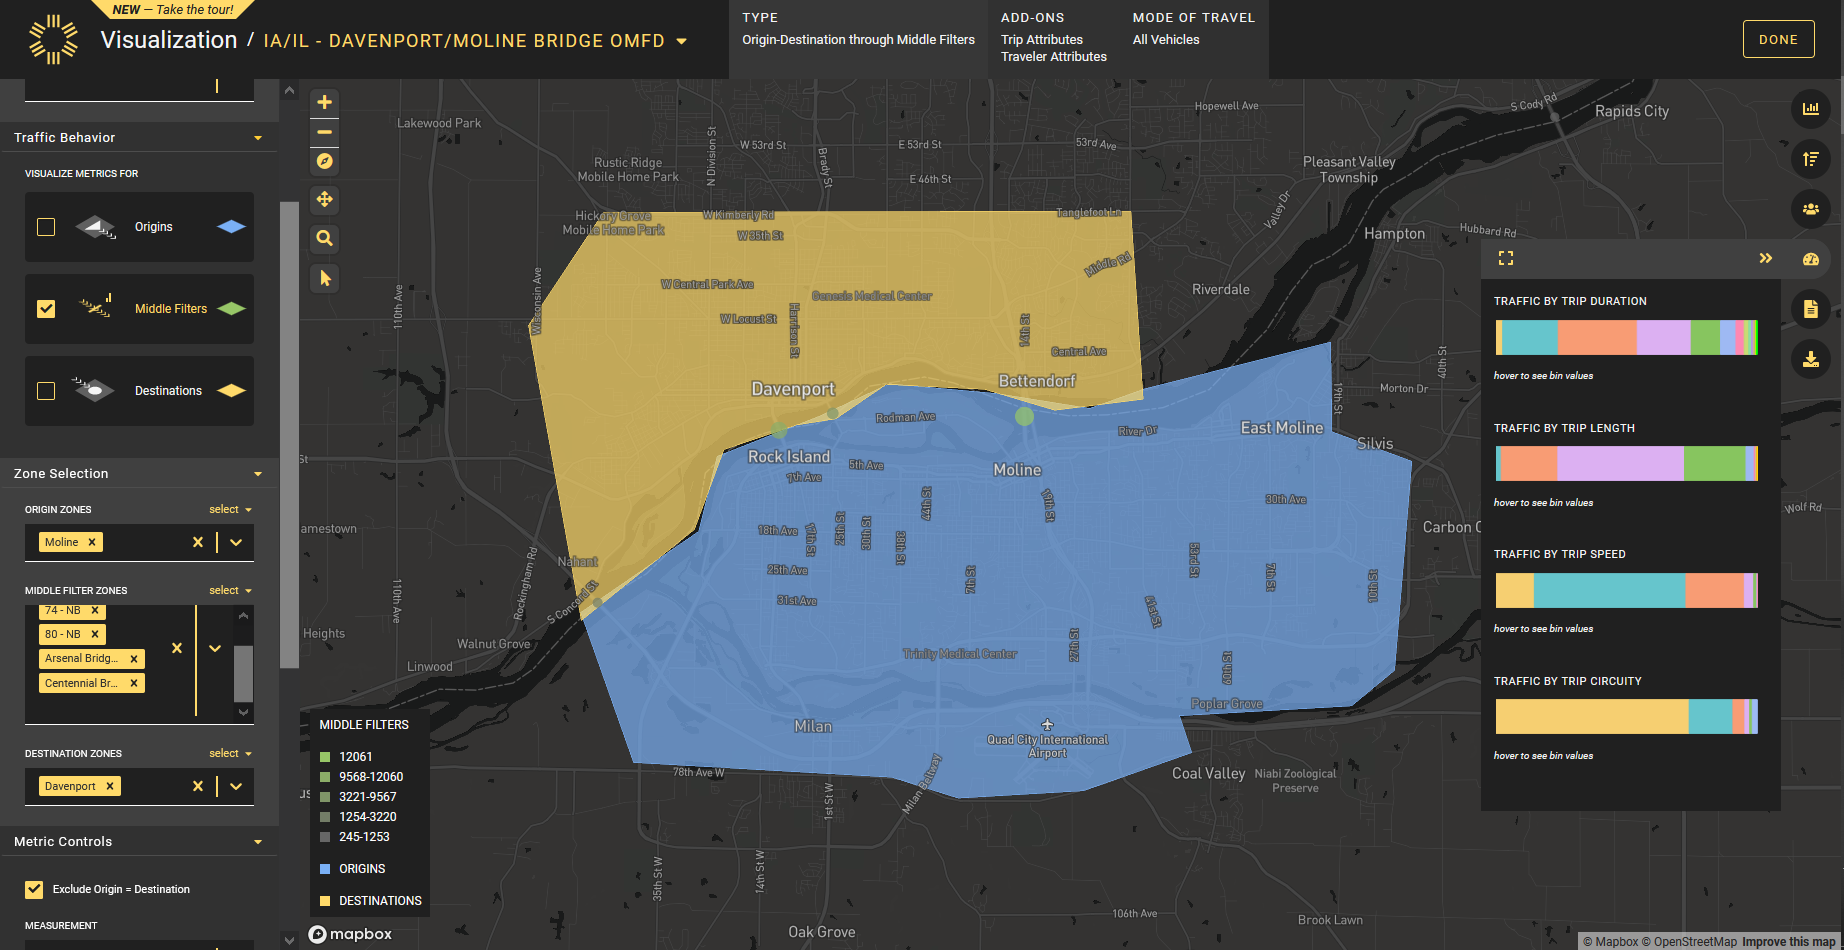
Figure 4: The analysis delves into trip attributes including trip length and trip distance.
Arsenal Bridge is the most affected bridge – average trip duration via that bridge is 27 minutes heading southeast, and almost 29 minutes going northwest, a pretty significant impact on trips taking the bridge.
Why does this matter?
Travelers choosing longer routes over a marked detour will create more VMT for a region, which raises emissions. And more driving on older bridges will create more wear and tear, requiring more maintenance.
Agencies armed with this data may be able to adjust detour routes, identify traffic sources, and adjust resources to maintain affected roads and bridges. Me, I’ll just be happy when the I-74 bridge project is finally completed!