This blog is for people who really enjoy getting into the weeds about data methodologies!
With StreetLight’s end-of-year product updates (if you’re an existing customer you can see release notes here) we included even more new data months, and we updated some of our methodologies for processing data. Our methodologies are documented in detail on our white papers page but we thought it would be helpful to summarize the updates here and discuss how the methodology changes might affect results of certain analyses, using some of our own previous blogs and ebooks as examples.
While these changes make our results better, we know methodology updates can be tricky for customers, so we want to be as transparent and helpful as possible, so customers can better navigate and understand any differences they may see. If you have questions about any of your own analyses, please contact our support team by visiting help.streetlightdata.com and selecting “Contact Support” or clicking the “Contact Support” link under the Help menu in your StreetLight InSight® account.
TL;DR: Overall the changes are moderate and the updates mean our results more accurately reflect the real world. The most significant impacts are:
Improved spot speeds and sample sizes for road segments analyzed with Network Performance in lieu of Segment Analysis.
Improved All Vehicles Volume estimates for data periods in 2019 nationally, as well as volume estimates for late 2023 for select states.
Improved differentiation between weekday and weekend vehicle volume metrics.
For Analyzing Speeds and Volumes on a Road Segment – Moving to our New Network Performance Analysis Type
During 2024, many users will have seen a new analysis type called “Network Performance” in StreetLight InSight®. This offers many of the same outputs as “Segment Analysis” but with improved methodology and data inputs, ultimately yielding better results. We are now recommending that clients analyzing vehicular movement on road segments transition to Network Performance, in particular for use cases involving measuring changes across time.
What’s Different: Network Performance relies on Aggregated GPS data (AGPS) as its underlying data source. Segment Analysis relies on a combination of Connected Vehicle Data (CVD) and Location-Based Services (LBS) data sources, both of which have smaller sample sizes than AGPS.
AGPS data has a few benefits, including a very high sample size (18-40% of vehicles on the road) and availability in both the US and Canada. Most notably, AGPS data has been continuously available since 2019, allowing for a better comparison across time since “data source” is no longer a variable that could account for differences measured. In addition, Segment Analysis metrics are not available beyond May 2023.
NOTE – As of January 2025, Network Performance can only be run on OpenStreetMap (OSM) segments. While it cannot currently be run on a customer’s LRS if they’ve uploaded that to the system, we are working on adding this capacity as soon as possible. Additionally, you can always work with our services team for a custom analysis that matches the metrics to your LRS.
Exploring Impact: Taylor Swift’s Eras Tour analysis
To explore the impact of shifting to Network Performance, we reran the results of our all-time-most-popular blog, which originally analyzed the Taylor Swift Eras Tour traffic jams using Segment Analysis (you can read the updated Eras Tour analysis here).
The analysis of congestion on typical days across each of the cities shows almost no difference between the two methodologies (Segment Analysis and Network Performance). The only notable difference where Network Performance shows less delay on a typical day is in New York City. We think this reflects Network Performance’s better differentiation of cars from subways and buses, and thus is an improvement.
On Eras Tour days, for most cities, Network Performance picked up a little more of an impact from the concerts as shown in Figure 1. Again, we consider this a positive reflection of Network Performance, as the data source is showing improved differentiation between typical activity and disruptive activity. This is one of the key benefits of big data — to analyze and react when events do not follow typical patterns.
Notably, these changes aren’t big enough to impact the overall story: Looking at excess VHD, the concerts in Vegas followed by Dallas, then Phoenix and then Tampa had the biggest impact on traffic compared to a typical day. The concert in New York City (with the most transit alternatives to driving) had the smallest. Figure 1 shows the changes.
Figure 1: Scatter plot showing Vehicle Hours of Delay on Concert Dates for the newer Network Performance (X-axis) and Segment Analysis (Y-Axis). A dot that is “below” the line indicates that Network Performance found more delay on these concert dates than Segment Analysis.
Looking at excess VHD % change (i.e., the percentage difference between typical VHD and VHD on the day of the concert), the Boston concert shows the biggest percent change for both methodologies, followed by Dallas-Fort Worth and Phoenix. New York City still shows the smallest change. The table below shows how these rankings vary between Segment Analysis and Network Performance, with venue positions shifting by 1 rank at most.
Metro Area
Segment Analysis Rank How much worse (by percent) was traffic on Eras Tour days?
Network Performance Rank How much worse (by percent) was traffic on Eras Tour days?
Boston (Foxborough, MA)
1 (Biggest impact)
1
Dallas-Fort Worth, TX
2
3
Phoenix, AZ
3
2
Houston, TX
4
5
Philadelphia, PA
5
4
Nashville, TN
6
6
Tampa, FL
7
8
Las Vegas, NV
8
7
Atlanta, GA
9
9
New York City, NY
10 (Least Impact)
10
Network Performance Volume Model Updates
In our end-of-year release, we also updated our U.S. Network Performance Volume model for all road segments in the U.S. for all months starting in 2019.
What’s Different: The volume estimates are derived from a machine learning model trained on over 14,000 unique permanent vehicle counts across all states in the contiguous U.S. The updated model uses more training locations than the first version of the model as more states published 2023 data after our initial release. We also used more historical data from 2019 and 2020 to refine the algorithms for those years. In general, these improvements yield:
Reduced bias and improved error in all years, especially on low volume roads
Improvements to the volume model for 2019
Improved weekday vs. weekend comparisons for all years
Figures 3 and 4 compare MAPE (Mean Absolute Percent Error) for various bins of roads for each data year. Deeper dive white papers are available here.
The new release also includes Network Performance volume estimates for Canada.
Figure 3: Nationwide model improvements in v2 (released November 2024) for 2019 data months. Improvements mainly show up in improved MAPE on smaller roads. This indicates that any given road, when run in v2, is likely to have more accurate estimation especially if that road is smaller.Figure 4: Nationwide model improvements in v2 (released November 2024) for early 2024 data months. The two models are much closer in performance, indicating that any given road is less likely to see big swings in volume estimation, because v1 was already strong.
Exploring Impact: VMT Report
Last fall, we published a report ranking VMT changes from Spring 2019 – Spring 2023 for metro areas in the U.S. VMT relies on our volume model, and when the report was published, we were still using our V1 model. In hindsight, for a metric as critically important as VMT, we should not have developed a report with V1 when we knew V2 was coming soon! It created unnecessary confusion for our customers. This was an error we regret and will not repeat. We may publish a more comprehensive update of that report with v2 metrics in the future.
When we reran the results with our improved volume model, we saw some changes:
A number of metro areas showed increased VMT totals for 2019, while most had similar results for 2024. This means that the percentage change in some metros between 2019 and 2024 was overstated in our initial report (Overall, Spring 2019 was in fact closer to Spring 2024, than initially reported by approximately 4-7 percentage points depending on region).
The increase in 2019 was most often attributable to improvements in low/medium volume road accuracy.
This granularity ensures agencies of all sizes, as well as firms and businesses, can get actionable insights to prioritize projects, evaluate impact, and anticipate future needs. It’s also particularly important for transportation modeling, which requires granular, empirical data to help predict how conditions will change over time, or in response to specific infrastructural and policy changes.
Let’s use a few metros in Connecticut to illustrate the change.
Area
V1 2019-2024 Spring Change in VMT
V2 2019-2024 Spring Change in VMT
Bridgeport-Stamford-Norwalk, CT
6.3%
0.4%
Hartford-West Hartford-East Hartford, CT
3.5%
-0.7%
New Haven-Milford, CT
6.0%
0.4%
Norwich-New London, CT
5.6%
-2.2%
Torrington, CT
13.3%
5.8%
Worcester, MA-CT
-2.2%
-1.1%
Connecticut – Statewide
4%
-0.6%
VMT Musings: How do we know what is “right” or “better”?
For our volume metrics, we can publish very precise estimates of overall accuracy based on thousands of “ground truth” permanent counters, as shown in Figure 5.
But VMT over a large area is trickier — there’s no such thing as ground truth. Instead, there are various methodologies, and thoughtful comparisons can be made based on known strengths and weaknesses of each one.
FHWA publishes two different reports on statewide VMT (and individual states have their own methodologies): the Traffic Volume Trends (TVT) and within the Highways Statistics Series (HSS). These are published at the state level, not MSA.
Method Summary:
The TVT is updated faster than HSS and is based on Continuous Count Stations (CCS), extrapolating changes seen on them to the rest of the roads.
For the Highway Statistics Series (HSS), FHWA “estimates national trends by using State reported Highway Performance and Monitoring System (HPMS) data, fuel consumption data (MF-21), vehicle registration data (MV-1), other data such as the R. L. Polk vehicle data, and a host of modeling techniques” and since HSS hasn’t come out yet for 2023, we can’t compare the most recent data.
Like the TVT, StreetLight uses CCS counters from the state in question as well as from similar roads (similar by volume, rural/urban context, weather patterns, and more) in nearby states to create a machine learning model to scale up a ~25% sample to a full count. We estimate each individual road segment’s volume independently using this method, multiply that volume by road segment length, then sum all road segment VMT values up in a given area to estimate that area’s total VMT.
Sticking with Connecticut to illustrate differences:
Figure 6: FHWA TVT, HSS, and StreetLight Annual Connecticut VMT change compared to 2019. The TVT shows more variability than HSS or StreetLight, particularly between 2022 and 2024. The TVT variability is too high compared to common sense in these years, in our opinion. HSS shows far less year over year variation, which builds confidence in its 21/22 estimates, but we don’t think the 2020 number matches common-sense COVID experience.
Looking at these two FHWA methods, we feel our V2 model performs well based on common sense and COVID experience.
Methodologies like TVT often extrapolate growth in VMT in a region from measured growth on CCS counters (which are most often on busy roads). If the balance of growth between highways and more local roads has changed since the pandemic — and we believe it has — then our industry needs to update the methodology used to estimate region-wide VMT. We believe the big data–driven approach offers just such an opportunity and we will explore this in future publications and posts.
And, as always, the more up-to-date, well-maintained permanent counters that are available (especially on lower volume roads) the better everyone’s estimates will be!
Public Data from NYCDOT Validates the Reliability of StreetLight’s Speed Metrics
Public Data from NYCDOT Validates the Reliability of StreetLight’s Speed Metrics
Access to accurate vehicle speed data is critical for effective road safety interventions, congestion mitigation, and more. We compared StreetLight’s speed metrics to data from New York City’s OpenData portal to ensure we’re delivering the most reliable insights.
To collect data on vehicle speeds, many agencies rely on permanent roadway sensors, speed cameras, or manual speed studies. But tight budgets and project timelines prevent the installation of sensors on every road, and manual studies only capture a small snapshot of roadway conditions, while also putting workers at risk.
Meanwhile, businesses and firms may not have access to the already limited speed data that is available via these methods, limiting their ability to make informed decisions about real estate, traffic operations, or events management.
For these and other reasons, many agencies, firms, and businesses turn to analytics platforms like StreetLight that leverage a big data approach to deliver vehicle speed metrics for any road, at any time. But when sourcing your data, it’s important to understand how reliable it is compared to more traditional ground truth methods.
Thanks to the City of New York’s OpenData portal, with publicly available vehicle speed data provided by NYCDOT, we were able to perform a validation of StreetLight’s speed data against New York City’s documented speeds. We’ll explain how our speed data is collected, how it compares to NYCDOT’s data, and what that means for your own vehicle speed analyses.
How NYCDOT Collects Speed Data
The speed data available in NYC’s OpenData portal is collected through E-ZPass readers located on approximately 110 road segments throughout the city. Vehicle speeds are calculated based on the travel time and distance between two E-ZPass readers.
This approach captures average vehicle speed in real time, and the portal is updated with the most recent data several times per day.1
How StreetLight Collects Speed Data
StreetLight’s Vehicle Speed metrics are derived from Aggregated GPS Data, which includes data from a blend of device navigation apps, traditional mobile data apps, and in-vehicle navigation apps.
This method has the advantage of strong penetration rates across various road sizes and regions for a highly representative sample, even on rural and lower-volume roads. StreetLight’s sample penetration rate averaged 27% nationally in 2023 and was observed as high as 40%+ in some locations.
To develop segment-level speed metrics, StreetLight maps this data onto the StreetLight InSight® Zone Library, derived from OpenStreetMap (OSM). Based on the length of the segment and how long it takes a vehicle to travel from one end to the other, we estimate the average vehicle speed along that segment.
For more information on how StreetLight collects, aggregates, and validates our vehicle speed metrics, you can download this white paper.
Comparing the Data: How Accurate Are StreetLight’s Speed Metrics?
To ensure an apples-to-apples comparison, StreetLight analysts first cleaned the NYCDOT data, removing certain obviously incorrect datapoints that may have been caused by malfunctioning E-ZPass readers. Next, the cleaned NYCDOT data was aggregated such that the mean speed could be calculated per segment by day of week and hour of day.
Using StreetLight’s Network Performance analysis, analysts obtained the average speeds of groups of OSM segments that aligned with NYCDOT’s segments, looking at data for October 2023. This allowed for a close comparison between StreetLight and NYCDOT average speeds on 11 NYCDOT segments.
In this example comparison for a portion of FDR Drive Northbound, analysts averaged vehicle speeds from 10 StreetLight OSM zones (middle) aligned to the corresponding NYCDOT segment (left). On the right, NYCDOT speeds by day and time are marked with a blue line, while StreetLight speeds are marked in yellow.
Because StreetLight’s OSM-based segments do not have a one-to-one correspondence with NYCDOT’s segments (which are derived based on the distance between E-ZPass readers), special care was taken to align StreetLight segments with those used by NYCDOT, but some discrepancies persist, which we will discuss further in the analysis below.
Speed comparisons by day of week and hour of day for RFK Bridge Southeast Bound (left), Staten Island Expressway Eastbound (middle) and Long Island Expressway Westbound (right) segments. Monthly Average Daily Traffic (MADT) for each segment is marked below its graph.
Speed comparisons for Bronx Whitestone Bridge Southbound (left), Gowanus Expressway Southbound (middle), and FDR Drive Northbound (right).
Speed comparisons for Bruckner Expressway Westbound (left), Brooklyn-Queens Expressway (BQE) Southbound between Atlantic and 9th St (middle), and the Brooklyn Battery Tunnel Eastbound (right).
The above nine segment analyses showed StreetLight speed metrics closely aligned with speed data reported by NYCDOT. Where the data differs, StreetLight speeds tend to be slightly higher than those reported by NYCDOT.
Overall, StreetLight’s daily and hourly speed variations for each segment also track closely with the NYCDOT data, indicating that StreetLight’s speed metrics deliver reliable insights for real-world applications like safety and congestion studies, which can save agencies the considerable cost of installing physical sensors.
The two remaining segments (pictured below) display the greatest divergence between the StreetLight and NYCDOT datasets.
Speed comparisons for 12th Avenue Southbound (left) and Lincoln Tunnel Eastbound (right). These graphs show segments where StreetLight’s OSM zones could not be perfectly aligned to NYCDOT segments.
These discrepancies are likely caused, at least in part, by misaligned segment boundaries. As discussed above, sometimes StreetLight OSM zones could not be perfectly aligned to the NYCDOT segments.
In the case of 12th Avenue (AKA West Side Highway), this segment is part of a signalized corridor with closely spaced intersections, which could exacerbate the impact of the misaligned segments. Because the comparison segments do not have the same signalized-intersection approaches, this could lead to larger differences in average speed.
Despite these localized limitations in segment comparability, the overall results of our comparison show a high degree of alignment between StreetLight’s big data-based speed metrics and NYCDOT’s speed data derived from E-ZPass sensors.
More about StreetLight’s Vehicle Speed Data – Segment Speed and Spot Speeds
Because the vehicle speed metrics provided by StreetLight include average segment speeds, they can provide a helpful perspective, even for agencies that already collect speed data through physical sensors.
Unlike NYCDOT’s average segment speeds used in the above analysis, the speed data available to most agencies are spot speeds. Spot speeds capture vehicle speed at a specific location rather than the average vehicle speed along a whole segment.
Spot speeds and segment speeds each capture a different nuance of vehicle traffic, and comparing the two can help agencies better understand the causes of unsafe speeds or congestion, as well as their most effective solutions.
To ensure clients can take advantage of these nuanced speed insights, spot speeds are now available from StreetLight! To stay updated on all our product releases, consider subscribing to our newsletter.
1. City of New York. NYC OpenData. “DOT Traffic Speeds NBE.” https://data.cityofnewyork.us/Transportation/DOT-Traffic-Speeds-NBE/i4gi-tjb9/about_data
What is AADT, why does it matter, and how does big data make it more powerful?
What is AADT, why does it matter, and how does big data make it more powerful?
As agencies grapple with budget and staff limitations, big data analytics enable officials to overcome gaps in Annual Average Daily Traffic (AADT) data for local streets and low-volume roads. But first, what is AADT, and how does it inform transportation decisions?
In recent years, infrastructure improvement has become a hot topic in the US.
At the center of that interest are our streets, roads, and highways. Road conditions are a key factor in an area’s quality of life, economic dynamism, as well as access to schools, jobs, and healthcare.
Jurisdictions across the US are gearing up to improve their road networks, in part thanks to the federal Bipartisan Infrastructure Law (BIL), also referred to as the Infrastructure Investment and Jobs Act (IIJA), which makes $110 billion available for these improvements.
Behind the scenes, there’s one transport metric that is fundamental to nearly every federal funding request or routine budgeting at the state or local level: Average Annual Daily Traffic (AADT).
Annual Average Daily Traffic (AADT) is the transportation industry’s most essential metric for analyzing and forecasting traffic volume. Among other things, it’s used for the planning and design of infrastructure, tracking traffic congestion, estimating road safety, and as an empirical measure to help allocate highway funds.
In its simplest form, AADT takes in all vehicle trips on a segment of road or highway during a yearlong interval, in both directions, and then divides the total by 365 days to arrive at the average number of daily trips.
In addition to infrastructure and transport planning, AADT data is applied in many other contexts as a way to measure traffic flow and allow for “apples-to-apples” comparisons of traffic volume. For example:
Lawyers and law enforcement officials use the metric in accident cases and investigations
Lawmakers use AADT to inform budgeting and prioritization of transport budgets and projects
But AADT is also a simple measure, which flattens away seasonal and weekday variations in traffic patterns. Nonetheless, AADT remains the most widely-referenced benchmark for how busy a road or street is.
AADT vs. ADT
There are two main types of traffic measurement: Annual Average Daily Traffic (AADT) and Average Daily Traffic (ADT).
These measures are starkly different in how they are calculated and applied. They are often confused in casual discussions so it’s important to understand the differences.
As described above, AADT is the total volume of vehicle travel on a road for an entire year, divided by 365.
ADT is the average number of vehicles traveling through a location during a period shorter than a year. For example, it may be applied to a season, or a selected month or week, a short span of days, or a specific day in the year.
AADT is generally used to measure long-term trends or changes in travel demand, while ADT is more useful for short-term planning and operations.
For example, if a city wants to know how many people use a particular bridge to estimate wear-and-tear and traffic loads, it would use AADT. But if that same city needs to know how many cars will cross the bridge during a summer weekday to plan construction, it would use ADT calculated from a sample taken in the target interval.
Both measures have their advantages and disadvantages.
AADT can obscure seasonal variation (e.g., fewer people travel in winter), special events (e.g., increased travel for holidays or road closures within the measurement period), and day-to-day variation in demand (e.g., less travel on weekends). This can sometimes make it difficult to compare year-over-year changes or identify important micro-trends.
ADT can pick up these kinds of fluctuations, but they will not reflect overall demand on a road since by definition they only consider shorter periods. On the other hand, they have a limited lens: they will not reflect in any variations occurring outside of the measurement period.
As discussed below, AADT data is relatively difficult and expensive to collect since it requires real-world data spanning an entire year. Even when using calculation methods that don’t require 365 days of data, the need for accurate and continuous data is still relatively burdensome.
ADT is more forgiving from a measurement standpoint since by definition it requires the counting of traffic during shorter intervals.
How to calculate AADT
To calculate Annual Average Daily Traffic (AADT) in its simplest form as described above, analysts must know total traffic volume on the target road segment for every day in a given year.
This baseline method isn’t simple or cheap to implement since by definition it requires permanent devices known as counters or ATRs (automatic traffic recorders) detecting passing vehicles and collecting complete trips data for 365 continuous days in a year. Even missing a few hours of traffic means the calculation can be thrown off. Not to mention the recorders are not easy or inexpensive to install and maintain. During the COVID-19 lockdown, agencies saw their ability to collect counter data hamstrung by lockdown orders that kept workers off the road.
Even when permanent counters are in place and putting out continuous AADT traffic data, sometimes special events such as roadwork or adverse weather can distort averages with outlier days of abnormally low or high trip counts.
Finally, and most commonly, there are simply too many road segments in any jurisdiction to allow for comprehensive AADT data from permanent counters.
In the video below, Keith Nichols explains why Hampton Roads TPO commonly encounters data gaps with traditional AADT data collection methods, and how the agency supplements traditional methods for long-range transportation planning.
Traditional methods of closing AADT data gaps
Statistical methods, complemented with temporary data collection, are commonly deployed to address common data-collection issues. When officials turn to these methods, they do so knowing they are sacrificing accuracy for savings.
It’s worth understanding how these methods work together, and some of the tradeoffs.
Short-term expansion
One industry-standard method for arriving at Annual Average Daily Traffic (AADT) in the absence of permanent counters is known as “short-term expansion.”
In this method, a road section’s traffic is calculated on the basis of a temporary counter collecting two days or more of data. That incomplete short-term data is then “expanded,” or scaled up, to calculate AADT. To do this, analysts derive scaling “factors” from a nearby permanent traffic counter that has a year’s worth of data.
Ideally, that permanent counter used as a reference has same-year data. But it’s not uncommon for transport analysts to be forced to rely on permanent counter data from past years when calculating AADT using this method.
Obviously, even when the short-term expansion model bakes in some math, this tactic relies on the differences between the target road’s short-term traffic data versus the same-day measurements collected by the nearby permanent counter on a different road.
If these differences are not consistent across the year, i.e. if the short-term data was not taken on representative days, AADT accuracy will be compromised.
In the instances where permanent counters are in place but there are small gaps in the annual data or road closures and other outlier events that may throw off the averages, a separate established method is to limit the number of days for which complete datasets are required.
The AASHTO method
In one industry-recognized approach, officials collect total traffic volume on seven separate days in each month that correspond to the different days of the week. This method leaves planners with 84 days of data to work with that nonetheless will account for variations in traffic across different weekdays and on weekends.
Then, they take an average for each day of the week sampled across the year, giving them seven averages, and then they take the average of those averages for an AADT.
The American Association of State Highway Transportation Officials (AASHTO) has promoted this technique, known as an “average of averages” method.
Other methods
Many other estimation methods can be used depending on what data and counters are available and affordable. In fact, the proliferation of methods adds to the complexity faced by transport planners as they consider approaches for data collection and AADT calculation.
In fact, one in-depth review of the relevant academic literature on AADT estimation identified 30 separate methods just for estimating AADT on low-volume roads.
Adding to the difficulty, these techniques were hardly one-size-fits-all.
“Some AADT estimation techniques are only applicable in specific locations,” write the authors, Edmund Baffoe-Twum and Eric Asa of the West Virginia University Institute of Technology, along with Bright Awuku from North Dakota State University. “Others require significant data to provide accurate estimates. Several processes to adjust models for a location may be needed for other locations.”
Traditional methods vs. traffic analytics
Arguably the biggest change for Annual Average Daily Traffic (AADT) in recent years is the availability of instant up-to-date AADT estimates right from a computer through traffic-analytics providers.
On-demand traffic-analytics platforms reduce the need for expensive and sometimes hazardous fieldwork and are able to fill data gaps whenever they arise.
As a result, jurisdictions have more flexibility in the extent to which they rely on permanent and temporary counters for AADT metrics.
For example, recently StreetLight helped fill gaps in AADT data by the Indian Nations Council of Governments in Tulsa, Oklahoma. Due to budget issues, many jurisdictions in the area had stopped reporting traffic counts to INCOG, a metropolitan planning organization or MPO. In minutes, StreetLight was able to generate traffic counts for all of the untracked road segments.
In the video below, we explore other ways agencies commonly use on-demand traffic analytics platforms to leverage AADT metrics, such as developing crash rates and understanding the traffic impact of road or lane closures.
How do traffic-analytics platforms come up with their AADT measurements?
Typically, traffic analytics rely on connected devices and Internet of Things data, and then layer in parcel data and road-network data for a complete picture. With this data, it’s possible to create analytics that model vehicle trips on a stretch of road in the absence of temporary or permanent counters.
The real technical challenge for deriving AADT from traffic analytics is not just in collecting and organizing the large volume of location data, but in the next steps:
Algorithms are needed to match this raw data to vehicle trips
The dataset, for greater accuracy, is enhanced with additional sources of data such as US Census Data or street-map data to account for changes in demographics and road networks
The resulting AADT model must be tweaked for greater accuracy by testing results against real-world “ground truth” data, which should encompass different road and vehicle types, e.g. heavy trucks
In the case of StreetLight, which provides AADT metrics for 4.5 million miles of roadway in the US and Canada, all these steps were important and detailed in the whitepaper, “AADT 2023: U.S. Methodology and Validation.”
By comparing their own AADT metrics to AADT produced by thousands of permanent counters nationwide, StreetLight was able to determine that their AADT figures fall within a 98% prediction interval for all road types.
Challenges in measuring AADT: local and low-volume roads
AADT measurement is increasingly being shaped by many jurisdictions’ need for more granular and complete coverage of road systems.
What’s driving this demand? The answer is a set of interrelated traffic, demographic, and environmental concerns that are only growing stronger with time.
First, local streets are increasingly seeing overflow traffic from overburdened highways and multi-lane roads.
“Estimating AADT on local streets becomes a necessity as local street traffic continues to grow and the capacity of arterial roads becomes insufficient,” write Peng Chen, Songhua Hu, Qing Shen, Hangfei Lin, and Chie Xie. They are the authors of a 2019 paper on AADT measurements in the Seattle area, published in the Transportation Research Record.
Second, jurisdictions are also newly anxious to track traffic increases on low-volume roads in rural and semi-rural areas. Many of these areas have seen a major influx of short- and long-term visitors and new residents arrive over the last two years.
A 2022 analysis by StreetLight showed how this trend had impacted the resort town of Jackson Hole, Wyoming. The analysis showed that AADT on a section of unpaved road —an access point to Grand Teton National Park — had already significantly surpassed 2019 levels in 2021, even after dipping dramatically during the COVID pandemic.
AADT counts for Moose-Wilson Road from StreetLight suggest 2021 traffic volume had already exceeded 2019.
Thirdly, environmental and road-safety concerns are also behind the need for more comprehensive AADT data. Since a significant proportion, if not a majority, of vehicle miles in a state are driven on these roads, it’s impossible to form a complete picture of emissions or accident trends without it.
Despite the demand, coverage of low-volume and local streets poses a formidable challenge for traditional AADT calculation.
As we’ve seen, it is cost-prohibitive to deploy permanent counters widely on local streets or low-volume roads. Not to mention, rural roads are far-flung and cover many miles of sometimes difficult terrain. Local roads in urban areas are dense and highly varied in traffic patterns, which would mean putting counting stations on virtually every corner.
Many jurisdictions, in the cases where they have the budget to take the measurements at all, turn to temporary counts and estimation methods to measure AADT on these segments.
For these reasons, traffic analytics–based AADT metrics are a cost-effective and simple solution for filling data gaps on local and low-volume roads.
For example, StreetLight’s AADT metrics include urban and rural roads — even unpaved roads, as seen in the case study from Jackson Hole. Analyses covering hundreds of low-volume road segments can be run in minutes.
Annual Average Daily Traffic (AADT) and technology
Traffic-analytics platforms relying on big data approaches are only the latest tech innovations to transform how Annual Average Daily Traffic (AADT) is collected and calculated.
In the 1930s, AADT was based solely on manual counts, which required considerable manpower and intensive fieldwork, according to David Albright in a 1991 article on the history of AADT measurement. Counting devices only began to be used in the 1940s, and became widespread only after a couple of decades, with methods continuing to evolve in the years since.
More recently, computers and algorithms have helped run some of the sophisticated statistical models used by transport engineers and planners for AADT estimation. As discussed, StreetLight itself uses advanced software algorithms to process data, tie it to vehicle trips, and enhance it with U.S. Census and OpenStreetMap data.
While conceptually AADT has remained the same metric over all this time, and surprisingly resilient as a keystone metric in transport planning, technology has completely transformed data collection, calculation, and estimation methods. It’s a good bet that technology, and specifically big data and software-driven algorithms, will continue to drive innovation around AADT in coming years.
Test-drive StreetLight AADT metrics today with a free trial
Explore the resources listed above and don’t hesitate to reach out if you have any questions. We’re committed to fostering a collaborative community of transportation professionals dedicated to building a better future for our cities and communities.
How Advanced Traffic Counts are Powering Better Business Decisions
How Advanced Traffic Counts are Powering Better Business Decisions
Understanding traffic patterns is critical when choosing a store location, designing automotive products, or analyzing property values. Now, businesses can get the most up-to-date traffic counts on 2.5x more roads to drive more profitable decisions.
For many businesses, transportation intelligence is critical to making the right decisions. The number of vehicles and pedestrians on a given road — and how they move throughout a region — can dramatically impact how many visits a store gets, where drivers need to fuel up, or if EVs need to charge.
But historically, commercial decisionmakers have had to rely on incomplete and outdated traffic counts for information on where and how potential customers drive.
Now, StreetLight offers Advanced Traffic Counts to inform real estate decisions and products for professionals across industries like:
Commercial real estate
Retail and restaurants
Software
Electric vehicles
New mobility
These counts are updated frequently and cover millions of road segments across the U.S. and Canada, so you can make confident decisions based on the most comprehensive, up-to-date information on travel patterns.
StreetLight Advanced Traffic Counts is designed specifically for the commercial sector, to understand how potential customers move so you can choose the right street corner for a new store, select EV charger locations based on nearby traffic patterns, or develop new products and services based on real customer travel behaviors.
Here’s how it works.
StreetLight Advanced Traffic Counts offer pre-processed traffic volumes for over 25 million road segments, totaling over five million miles in the U.S. and Canada including motorways and trunk roads, arterials, and on/off ramps for comprehensive coverage. But it doesn’t end with traffic volumes. This data can be further contextualized with additional details like trip characteristics and historical demographics so you can make much more nuanced business decisions.
StreetLight Advanced Traffic Counts offer pre-processed traffic volumes for over 25 million road segments, totaling over five million miles in the U.S. and Canada including motorways and trunk roads, arterials, on/off ramps, and residential streets for comprehensive coverage.
A visualization of traffic counts in the broader Chicago metropolitan area. StreetLight’s extensive coverage provides traffic counts for millions of road segments, enabling more granular location intelligence to power the most profitable business decisions.
This means that as you begin to identify the next corner for your coffee shop, convenience store, or electric vehicle (EV) charger location, you can take into consideration factors like vehicle traffic, trip purpose (e.g. home-to-office vs. non-commute trips), and the overall demographics (e.g. income, education, family status, and more) of travelers passing by your potential location.
Likewise, these same factors can inform portfolio management for existing commercial real estate locations, diagnosing why some locations perform better than others, and where certain locations should be closed, where open hours should be extended or shortened, or where downsizing or expansion would help maximize overall revenue.
Market research firms and consultancies also benefit from these same insights when advising clients on commercial real estate decisions.
A zoomed-in view of Chicago traffic counts highlights roadways with the most trips (seen in dark red) and the least trips (in yellow).
How StreetLight’s Traffic Counts Support Better Site Selection and Operations
Because of the extensive coverage of our traffic counts, and the ability to filter counts by time of day and day of week in the relevant month or year, retailers, real estate professionals, investors, and other customers can now more easily identify promising store locations along nearly any roadway in the U.S. or Canada.
Importantly, businesses that rely on foot traffic (such as retail and restaurants) can also view historical pedestrian traffic counts to understand where high foot traffic will translate into more sales, while businesses that rarely benefit from foot traffic (such as car washes) can narrow their focus to vehicle traffic counts exclusively.
Importantly, businesses that rely on foot traffic (such as retail and restaurants) can also view historical pedestrian traffic counts to understand where high foot traffic will translate into more sales, while businesses that rarely benefit from foot traffic (such as car washes) can narrow their focus to vehicle traffic counts exclusively.
These same insights can also be used to forecast sales at new and existing stores. Portfolio managers can now understand where traffic is most likely to drive store visits and sales. Using traffic counts by time of day and day of week, they can also determine if store hours or staff operations should be shifted to capture demand when it is highest.
Trip and Traveler Attributes Help Determine Where Demand is High
Traffic counts are just the tip of the iceberg when it comes to site selection, research and development, and more. That’s why StreetLight Advanced Traffic Counts also include trip speeds, trip distance, and historical trip purposes and traveler demographics to further inform important decisions impacting your business.
Visualization of traffic volume with trip and traveler characteristics for two locations
For example, a commercial real estate professional evaluating potential locations for a new coffee shop could zero in on road segments that morning commuters take on their way to the office. Similarly, someone looking to open up a new location for a budget-friendly grocery store chain could pinpoint road segments that are frequently used by travelers with lower household incomes.
Likewise, adding the context of trip characteristics can further inform commercial real estate decisions. For example, traffic volume may not tell the full story for brands who rely on drivers traveling slowly enough to read their signage and turn into their location.
Luckily, with StreetLight Advanced Traffic Counts, these customers can take trip characteristics like speed into consideration to ensure the traffic at the site they select isn’t speeding by too quickly to bring in business.
Likewise, trip characteristics like direction of travel can inform which street corner or side of the road is most advantageous for a new store.
Ensuring Reliable Data for Confident Business Decisions
We’ve already discussed how StreetLight Advanced Traffic Counts allow commercial customers to access recent and historical data for a full-picture view of mobility patterns impacting their business. But how reliable are the metrics we provide?
Every month, we ingest, index, and process vast amounts of location data from connected devices and the Internet of Things, then add context from numerous other sources like parcel data and digital road network data to develop a view into North America’s vast network of roads, bike lanes, and sidewalks.
This data is then delivered in bulk through either a data file (such as a CSV) or via API, to integrate seamlessly into your existing data analysis platforms.
To understand how your customers move and get more information on the travel patterns impacting your business, click the banner below to get started.
Better Budget Planning with Big Data: 4 Ways Transportation Agencies Use Data to Build Budgets, Secure Funds, and Save Money
Better Budget Planning with Big Data: 4 Ways Transportation Agencies Use Data to Build Budgets, Secure Funds, and Save Money
With transportation agencies across the U.S. facing a dreaded “fiscal cliff,” budget challenges are top of mind for many StreetLight users. Thoughout the year, but especially as fall approaches, transportation professionals are under pressure to make next year’s budget as efficient as possible, and find last-minute ways to use remaining funds effectively before they’re lost in the budget rollover.
Recent years have introduced added complexity to the budgeting process. While the Bipartisan Infrastructure Law (BIL) passed in November 2021 offered billions in new funding opportunities, the traffic disruptions of the pandemic also introduced added difficulty in anticipating travel demand, planning projects, and following through on existing plans.
Amid these challenges, big data–powered traffic analytics are helping agencies with a few key budgeting needs:
Planning and prioritizing next year’s projects to build effective, justifiable budgets
Save money over traditional data collection methods with validated, on-demand data
Secure additional funding with data-supported grant applications
Use leftover funds quickly and effectively, before they are lost in the fiscal year turnover
Below, we’ll explore specific examples collected from panels and discussions that illustrate how shrewd practitioners are using Big Data analytics to meet these budgeting challenges.
1. Prioritizing Projects for Next Year’s Budget
At our 2020 StreetLight Summit, when many projects were in limbo, transportation professionals told us they were ramping up on planning. That way, when budgets were settled and projects could begin again, planners would be confident they’d analyzed and prioritized the most important work.
“If we are going to invest in putting up count stations that cannot be moved, we need to be confident there will actually be activity at that count station.”
Although this was top-of-mind during the disruptions of the early COVID pandemic, this insight is evergreen. When agencies have the data to effectively prioritize next year’s projects, that data can also be used as evidence to justify next year’s budget and support its approval.
At the 2020 StreetLight Summit, planners shared examples of running multiple analyses for each project, and studying before-and-after results to measure impact of existing projects.
For example, FDOT needed to decide where to install 11 continuous bike and pedestrian counters along thousands of miles of bike trails and lanes in Florida. Planners instinctively felt that the University of Florida in Gainesville would be a prime location, and took the time to verify that instinct.
“If we are going to invest in putting up count stations that cannot be moved, we need to be confident there will actually be activity at that count station,” explained Eric Katz at FDOT.
Figure 1: A Zone Activity analysis marking potential location for a continuous bike counter on University Avenue in Gainesville, Florida.
Katz confirmed a steady stream of bike/ped travel in the area, plus trip duration and trip speed, by running a StreetLight Zone Activity analysis. The study pinpointed additional Florida locations for short-term counters, including a popular bike trail in the Panhandle.
2. Save Money Over Traditional Collection Methods
To operate effectively, agencies rely on data-informed project planning. But answering key questions about existing mobility conditions can often strain budgets.
Access to on-demand traffic data is often far more cost effective than sensors or surveys, allowing agencies to operate with a more comprehensive understanding of mobility in their communities.
But big data can provide O-D analytics at larger sample sizes without the delay or cost of surveys.
At the 2020 StreetLight Summit, Lucile Kellis of Steer shared an origin-destination analysis designed to help a transit client size unmet travel demand. First, Steer used StreetLight to identify where transit users were ultimately going to and coming from, to highlight strategic travel corridors.
“Good surveys are expensive and they return results with low sample size and biases. StreetLight helps us solve these issues at a much cheaper cost.”
Then they went further by gleaning additional insights about the travelers themselves. But rather than incur what would be an additional survey expense, Steer leveraged the StreetLight InSight® platform.
“Typically our clients have a good understanding of who their customers are, but not the people who they want to attract,” Kellis explained. “Surveys are a good tool to collect that information, but we all know that good surveys are expensive and they return results with low sample size and biases. StreetLight helps us solve these issues at a much cheaper cost.”
Figure 2: Using demographic information from StreetLight InSight® Steer’s analysts built a dashboard capturing transit persona data.
Similarly, when MnDOT wanted to understand sources of traffic on Dodd Road, on-demand traffic analytics helped them avoid prohibitive survey costs.
Figure 3: MnDOT’s analysis confirmed that Dodd Road’s traffic was primarily made up of local trips, not cut-through traffic.
“We normally wouldn’t answer this community question because the survey spend wouldn’t be cost effective,” says Michael Corbett at MnDOT. Corbett’s team was receiving complaints about cut-through traffic in a particular neighborhood. But with unlimited analyses via the agency’s StreetLight InSight® subscription, MnDOT was able to identify the source of neighborhood traffic, and share results with constituents.
Budget limitations often demand that some concerns remain unaddressed, even for well-funded state DOTs and large MPOs. Meanwhile, small to medium-sized cities may have an even tougher time addressing resident reports of cut-through traffic, congestion and delays, or unsafe vehicle speeds.
Access to big data can allow these cities to investigate and validate resident complaints more affordably, shifting funds that would have been spent on data collection to actually implementing solutions. Plus, with information on the entire transportation network, and the ability to evaluate the impact of past projects with before-and-after analyses, cities can more confidently choose the most effective solutions and ensure funds are not wasted.
Other traditional data collection methods — such as automatic traffic counters or manual field observation — can also drive up costs. In 2019, one DOT ran a cost-benefit analysis to compare StreetLight’s platform to traditional methods and found a 50:1 benefit-cost ratio (click here to learn more about cost-benefit analyses).
“We normally wouldn’t answer this community question because the survey spend wouldn’t be cost effective.”
3. Secure Grant Funding
Data-supported grant applications help agencies stretch their budgets and fund projects that might otherwise end up on the chopping block or face considerable delays.
To tell a story grant administrators want to hear, agencies need evidence that their proposed project will significantly benefit their community. But as we’ve explored above, traditional data collection can be costly and time-consuming, leaving agencies with a catch 22.
Big data can help build a compelling grant application with clear visualizations and benefit-cost analyses using recent, validated data on existing conditions.
Big data has also been pivotal in securing funds for safety projects. Agencies that have leveraged StreetLight for Safe Streets and Roads for All (SS4A) applications have won ~$8 Million in SS4A grant funding.
4. Use Funds Effectively Before It’s Too Late
Because many agencies have use-it-or-lose-it funds, the end of the fiscal year often adds urgency to fund implementation. How can agencies use leftover funding effectively for their communities, with limited time left in the year?
Because big data analytics don’t face the same delays that traditional data collection methods do, they can allow agencies to quickly identify optimizations on existing roadways and allocate funds for quick fixes like signal retiming or optimizing bus schedules.
Big data can also help agencies funnel these leftover funds into planning for next year.
For example, when planners in the Shreveport, Louisiana area had concerns about traffic congestion and safety, they used StreetLight to get a comprehensive look at regional traffic, pinpoint congestion hotspots, and quickly build a data-supported mitigation plan.
This approach also relieves budget stress by allowing managers to use their staff resources more efficiently. Chris Petro, AICP, of the Northwest Louisiana Council of Governments (NLCOG) put it this way:
“Without StreetLight’s data, calculating the Speed Reduction Factor would have been monumental in terms of MPO staff time and resources. StreetLight’s team also helped compile, attribute, and format traffic flow data in a GIS environment.”
6 Types of Transportation Big Data Every City Needs
6 Types of Transportation Big Data Every City Needs
In a changing transportation landscape, it’s more important than ever for planners to have access to detailed data and analytics. Given our increasingly complex transportation networks, planners must consider where to implement road diets, add EV charging infrastructure, establish tollways, expand access to multimodal transport, and so much more.
While traditional methods of data collection and analysis (think: surveys and sensors) can still offer important insights, today’s cities often seek the help of something bigger — Big Data. In transportation, Big Data involves large, complex data sets collected from numerous sources to provide a complete picture of today’s transportation networks, including various modes of transportation and how they interact. This type of detailed data is collected from trillions of pings from connected vehicles and the Internet of Things, combined with contextual data like the census and maps of the roadway network, which is anonymized, aggregated, and processed by machine learning engines to generate recognizable metrics like Annual Average Daily Traffic (AADT) and Vehicle Miles Traveled (VMT), which transportation planners use every day.
Having access to detailed real-time and historical transportation data empowers planners and transportation departments to develop better strategies, reduce costs, prioritize initiatives, and measure the effectiveness of each change or improvement. But which metrics are most important for smart planning and development? To make a wide range of informed decisions, planners typically rely on the following Big Data for transportation, which we’ll cover in this article:
Annual Average Daily Traffic
Origin-Destination
Turning Movement Counts
Vehicle Miles Traveled
Vehicles Hours of Delay
Vehicle Speeds
1. Annual Average Daily Traffic
Annual Average Daily Traffic (AADT) is perhaps the most foundational metric in transportation analytics. It measures the average daily volume of traffic on a given road during a given year, and it’s critical for evaluating road congestion, spotting safety concerns, and planning infrastructure updates. AADT also plays an integral role in shaping non-transportation decisions, such as developing new retail or investigating accident cases.
Historically, this fundamental piece of traffic data has been expensive and time-consuming to acquire. Traditional collection methods for AADT require working counters that can track traffic counts 24 hours a day, 365 days a year. In many jurisdictions, it’s simply not possible to collect this much data for every road.
Today, however, machine learning allows software like StreetLight InSight® to build models that calculate AADT for more roadways — and much more quickly. Instead of spending time and money installing sensors on every roadway or extrapolating annual numbers from a few days’ worth of manual counts, Big Data leverages large sample sizes and a continuous stream of data to quickly deliver the most reliable, up-to-date data on roadway volumes.
Origin-Destination (O-D) patterns provide another essential piece of the puzzle in transportation data analytics. O-D data helps transportation professionals understand where trips begin and end, shedding light on commute patterns, areas of high travel demand, and locations that generate the most traffic. For these reasons, O-D data is often used by agencies to understand where infrastructure improvements, policy changes, or traffic management strategies can help optimize traffic flow, encourage mode shift to walking, biking, and transit, boost economic activity, and more.
An Origin-Destination analysis in StreetLight InSight® shows top origins and destinations, with a time distribution overlay contextualizing when most trips occur.
However, traditional O-D metrics are often incomplete and inefficient to collect, requiring extensive surveys which are typically costly and suffer from human bias and small sample size issues. Big Data can provide more detailed information — without the survey process — and go beyond typical O-D analyses to identify the most prevalent travel routes and allow planners to easily customize their analysis and contextualize O-D patterns with other data overlays like vehicle speeds or AADT. For instance, planners in Sarasota, Florida, used StreetLight O-D data to prioritize bike routes and route directness and create a stronger multimodal network. Using detailed metrics without the need for surveys, Sarasota connected more bike and pedestrian routes to transit services and key destinations to reduce congestion and create a more equitable transportation system.
3. Turning Movement Counts
Turning Movement Counts (TMC) provide critical safety and congestion information about intersections. In simple terms, they demonstrate the volume of traffic entering and exiting an intersection at a given time. While this data can be collected manually, this process is cumbersome and costly. Since the 1970s, pneumatic tube counters have typically provided these counts every 24 to 48 hours, but such tubes often provide inaccurate data due to vehicle angles in intersections. It’s also expensive to lay down enough counters to collect sufficient data — each single-lane tube costs roughly $5,000, while each four-lane tube costs around $9,000.1
Planners can leverage Big Data to collect more frequent, accurate, and less expensive analytics on any intersection. Big Data can model 15-minute granularity for nearly every intersection — signalized or not — at any hour of the day, without the sample-size challenges of 48-hour counts. With this level of collection and analysis, planners can understand turning patterns and peak turning times for almost every road in the U.S. and Canada.
4. Vehicle Miles Traveled
To understand travel demand, measure emissions, evaluate multimodal infrastructure, and more, Vehicle Miles Traveled (VMT) is another critical metric for city transportation planners. VMT estimates the total mileage traveled by vehicles in the region or along specific corridors. This helps planners monitor changes in travel demand over time, allocate resources where they’re most needed, and understand how vehicle travel impacts road infrastructure and regional emissions.
With Big Data, planners have access to continuous, widespread VMT info for any road or region. This information makes it possible to build travel demand forecasts, plan for congestion relief, and direct regional and corridor traffic studies. VMT is also invaluable for detailed estimates of greenhouse gas emissions, fuel tax impacts, and more.
Big data transportation analytics platforms allow cities like Citrus Heights, California, to get comprehensive VMT metrics for every census block, meeting regional reporting requirements like SB 743, shedding light on city-generated transportation emissions, and guiding infrastructure improvements.
5. Vehicle Hours of Delay
Vehicle Hours of Delay (VHD) is an essential metric for measuring congestion issues and targeting traffic bottlenecks. It provides the total number of hours lost to traffic delays in a given area during a specific time period. Understanding VHD can help planners quantify the severity and investigate the causes of traffic delays, as well as predict how road construction, special events, or bad weather may impact travel times. It is also critical for evaluating the effectiveness of traffic management strategies and more accurately forecasting which road improvements will reduce delays.
With StreetLight InSight®, planners can access historical and monthly delay metrics, providing visibility into fluctuations over time. This type of traffic data is invaluable in highly congested urban areas like Los Angeles or Chicago, where the success of each transportation initiative hinges on understanding the exact sources and nature of each bottleneck or problem area.
6. Vehicle Speeds
Vehicle speed metrics help city planners understand a variety of road conditions, particularly road safety and congestion.
Vehicle speed data is critical to measuring and improving road safety, especially when it comes to protecting Vulnerable Road Users like cyclists and pedestrians. To put this into perspective, data from AAA Foundation shows pedestrians are five times more likely to die from crashes when cars are traveling 40 mph vs. 20 mph. Vehicle speed metrics help city planners understand where high speed vehicles threaten the safety of all road users, and evaluate roadways for potential traffic calming strategies like road diets or speed humps.
A data visualization shows where high vehicle speeds and high pedestrian activity overlap on a dangerous section of Oakland, California’s Grand Avenue.
Inversely, identifying areas with lower-than-expected vehicle speeds can help city planners identify areas of high congestion, and evaluate when that congestion is at its worst. Getting real-time data on vehicle speeds can even enable city traffic managers to quickly deploy congestion mitigation strategies like retiming smart traffic signals or deploying trained traffic controllers where needed. While vehicle speeds can be collected from physical sensors like speed cameras or calculated based on the distance and travel time between two separate traffic counters, getting vehicle speed data for every roadway would require installing these types of sensors throughout a city’s entire road network, which is prohibitively expensive and time-consuming. Big data vehicle speed metrics can fill these gaps for cities that want to improve safety or congestion on city streets, even those without permanent counters installed.
Accessing the Data You Need, When You Need It
Solving regional transportation issues is a problem of massive scale and enormous import. Faced with millions of cars traveling thousands of miles per year and the pressing problems of urban congestion, transportation inequity, a pedestrian safety crisis, and greenhouse gas emissions, planners must have access to digestible, actionable metrics to understand and address the issues their constituents face. Injecting Big Data in transportation planning puts a better city mobility network within reach by delivering more information to demystify these common problems and their potential solutions.
With StreetLight InSight®, planners can access the most comprehensive suite of transportation data analytics on the market. While traditional collection methods and metrics are still useful for providing critical snapshots and verifying broader data sets, StreetLight’s Big Data analytics expand upon what’s possible with these traditional methods with 24/7 access to the metrics planners need to make more informed, data-driven decisions for any road and any mode.
1. Federal Highway Administration. “A Summary of Vehicle Detection and Surveillance Technologies use in Intelligent Transportation Systems.” https://www.fhwa.dot.gov/policyinformation/pubs/vdstits2007/04.cfm
The FHWA’s New GHG Rule, and What it Means for MPOs
The FHWA's New GHG Rule, and What it Means for MPOs
Emily Eros is the Director of Advanced Research at StreetLight, and leads the data science team behind our new GHG Measurement product.
The Federal Highway Administration recently published a new performance measurement rule for tracking greenhouse gas (GHG) emissions on highways.1 This new rule requires state DOTs and MPOs to establish a 2022 baseline level of GHG emissions produced by travel on the National Highway System (NHS). Agencies must set 4-year declining targets and report on the percent change in emissions. State DOTs must establish and report their baseline and targets by Feb 1, 2024, while MPOs must report their targets no later than 180 days after their State DOT establishes its 4-year target.
Overall, we’re encouraged and excited to see this rule established; it’s an important step towards reducing GHG emissions and meeting climate goals. However, FHWA outlines a calculation method that prioritizes consistency and simplicity but has some limitations — particularly for MPOs. In this blog post, we unpack that and explain what we recommend for MPOs, who have more flexibility in how they calculate the performance measure.
The FHWA Method for States
The FHWA requires state DOTs to use a specific approach to calculate baseline 2022 emissions:
In other words, each state’s CO2 estimate is calculated by multiplying the gallons of fuel sold in that state by the CO2 emissions for each fuel type. This is then multiplied by the proportion of state VMT that occurs on the NHS, in order to estimate emissions on NHS highways within the state.
Fuel consumption is taken from monthly state fuel sales reporting, available for gasoline/gasohol and special fuels (diesel). VMT is taken from November 2023 HPMS data.
This method is straightforward, simple, and achievable with data already reported by state agencies. The calculations will be consistent across states and across different time periods. Nationwide, these emissions will amount to the correct, empirical total. At the state level, these may be primary considerations. However, basing emissions on fuel sales has important limitations, particularly for smaller jurisdictions like MPOs.
Limitation: Fuel is not necessarily consumed where it is purchased
This is a general concern when it comes to emissions from trucking, and in areas where travelers may be purchasing fuel across state lines.
Heavy-duty trucks make up a significant portion of highway traffic. For long-distance trucks, it’s typical to refuel roughly every 1000 miles — though many can travel closer to 2000 miles before refueling, depending on fuel tank size and fuel economy. Therefore, for these vehicles in particular, fuel is often consumed in a different state or region from where it was purchased. It’s difficult to tell whether or not these individual patterns balance out; state diesel sales may or may not correspond to state diesel emissions.
StreetLight explored this issue in a recent GHG Emissions Methodology and Validation White Paper. We compared emissions from 2022 state fuel sales against the EPA’s 2020 National Emissions Inventory (NEI), which we adjusted to 2022 according to year-over-year traffic volume trends published by the FHWA. We found inconsistency between these two datasets, particularly for emissions from diesel sales/trucking, where some states had differences of up to +/- 75% depending on the approach used.
These differences are shown in the graph below. For diesel sales (shown in blue), the distribution is centered close to zero but the spread is reasonably wide. This means that many states had very substantial differences between emissions calculated using these two approaches.
Differences were smaller for gasoline-based emissions (shown in gold). The graph below shows a tighter distribution with a smaller range, meaning that the reference datasets were more similar — though the right-skewed distribution indicates that NEI was generally slightly higher than the fuel-sales-based approach. For diesel sales, the left-skewed distribution indicates that NEI was slightly higher than the fuel-sales-based approach.
Emissions from gasoline and diesel reported in the National Emissions Inventory (NEI) are compared with emissions calculated from gas and diesel sales.
Neither the fuel sales nor the NEI approach is a ground-truth measure of emissions, but the variation between diesel/trucking emissions estimates supports our concern that diesel sales in particular may not accurately and consistently measure trucking emissions in all states or regions. Since the federal performance measure specifically focuses on highways, diesel sales variation could have significant impacts on emissions estimates.
Limitation: Fuel sales data are not (typically) available at the MPO level
Motor vehicle fuel sales are tracked and reported at the state level, but often not at more granular levels. So, as the FHWA notes in their final rule, MPOs lack a data source comparable to the Fuels & Financial Analysis System for Highways (FASH) database. Therefore they must estimate CO2 emissions using an approach different from the state DOTs.
This could involve estimating the proportion of state fuel sales consumed within the MPO — but this would compound the uncertainty of the fuel sales approach, and it would not account for fuel economy variation across the state.
Solution: StreetLight provides accurate, reliable GHG metrics for the FHWA performance measure
StreetLight offers a robust solution for MPOs (or other jurisdictions) interested in measuring GHG emissions. StreetLight offers two different GPC-compliant methods (Within Boundary and Induced Activity) to ensure that agencies get the metrics they need to support their goals.2 For each of these methods, we leverage our best-in-class transportation data and analytics to calculate GHG emissions for either individual road segments or entire areas — or both. Our methods use StreetLight’s trusted volume models along with local vehicle registration data to calculate accurate emissions estimates and breakdowns.
For the new GHG performance measure, StreetLight can calculate 2022 baseline emissions metrics for NHS highways within a region, with separate emissions breakdowns for passenger vehicles and trucking.
In other words, rather than using fuel sales to estimate highway emissions, StreetLight’s method drills down into highway VMT by vehicle type. We then factor in vehicle registration data to understand how much gasoline and diesel are actually consumed on NHS roadways. This enables us to calculate GHG emissions by vehicle type.
In addition, StreetLight offers area-level metrics that offer a complete picture of GHG emissions for your region. Area-level metrics include emissions from all roads within a census tract, county, or MPO. They include breakdowns by vehicle type (light-, medium-, and heavy-duty), as well as by trip type, to distinguish between internal and trans-boundary trips. Trip type breakdowns are important for understanding the type of emissions that are occurring, and what reduction strategies might be most appropriate. We also provide metrics for avoided emissions from electric vehicles, so you can track progress towards tailpipe emissions reductions.
StreetLight’s GHG Emissions Metrics show the proportion of total emissions produced by light-, medium-, and heavy-duty vehicles for counties in Maine.
For example, the Twin Cities Metropolitan Council used StreetLight data to develop an online tool to share emissions data with local governments. This way, individual jurisdictions and townships could easily access publicly available data on local emissions rather than relying on national averages alone. Along the way, they used O-D analyses to solve over-counted emissions for small communities that intersected major highways, helping to clarify where emissions reduction projects would be most impactful.
Similarly, Southern Maine Planning & Development Commission used StreetLight’s Origin-Destination analytics to access hyper-localized VMT insights that would have been too expensive and computationally intensive to access otherwise. They then used these insights to calculate emissions for each community in southern Maine and identify where mitigation measures would have the greatest impact.
StreetLight’s GHG offering enables agencies to meet the new GHG performance measure reporting requirements, and it goes further by providing a more complete picture of regional emissions.
1. Federal Highway Administration. “GHG Performance Measure.” November 22, 2023. https://www.fhwa.dot.gov/environment/ghg_measure/
2. Greenhouse Gas Protocol. Global Protocol for Community-Scale Greenhouse Gas Inventories. https://ghgprotocol.org/sites/default/files/standards/GPC_Full_MASTER_RW_v7.pdf
StreetLight Partners with TomTom to Expand Depth and Reach of Transportation Data and Insights Worldwide
StreetLight Partners with TomTom to Expand Depth and Reach of Transportation Data and Insights Worldwide
The StreetLight InSight® platform transforms data into contextualized, normalized, and aggregated travel patterns. Through this partnership, StreetLight leverages TomTom’s historical and real-time traffic analytics based on anonymized speed data from more than 600 million connected devices. The result is deep global data coverage and a robust analytic platform that empowers planners and other transportation professionals with data-driven insights to inform transportation and infrastructure projects of any size and scope.
“For a decade StreetLight has been committed to finding and leveraging the best data sets available to give our clients access to transportation metrics and insights that help them make better, faster and often less expensive decisions about critical transportation and infrastructure work. Transportation has big challenges, and we have big ambitions to help meet them. This includes expanding into new products and new geographies. TomTom, with their robust platform and global presence, is the right partner for the next decade.”
said Laura Schewel, StreetLight CEO and VP of Transportation Software at Jacobs.
Ralf-Peter Schaefer, Vice President for Traffic & Travel Information at TomTom, stated:
“We are excited to partner with an industry leader like StreetLight to deliver reliable and scalable mobility measurement tools to address today’s complex transportation problems. By combining our data from millions of trips globally with StreetLight’s industry-tailored solutions, we enable transportation planners, road authorities, and businesses to make informed, accurate decisions, thereby reducing congestion and improving mobility.”
About StreetLight Data, a Jacobs Company
StreetLight Data, Inc. (“StreetLight”) pioneered the use of Big Data analytics to shed light on how people, goods, and services move, empowering smarter, data-driven transportation decisions. The company applies proprietary machine-learning algorithms and its vast data processing resources to measure travel patterns of vehicles, bicycles and pedestrians, accessible as analytics on the StreetLight InSight® SaaS platform. Acquired by Jacobs as a wholly owned subsidiary in February 2022, StreetLight provides innovative digital solutions to help communities reduce congestion, improve safe and equitable transportation, and maximize the positive impact of infrastructure investment.
Billions of data points. Millions of sources. Hundreds of communities.
We are the mapmaker bringing it all together to build the world’s smartest map. We provide location data and technology to drivers, carmakers, businesses, and developers. Our application-ready maps, routing, real-time traffic, APIs and SDKs enable the dreamers and doers to shape the future of mobility.
Headquartered in Amsterdam with 3,800+ employees around the globe, TomTom has been helping people find their way in the world for over 30 years.
Please provide your contact information so we can send the latest insights and research from StreetLight to your inbox; you can unsubscribe at any time.
Turning Movement Counts Explained: Leveraging TMC Analytics for Better, Safer Planning
Turning Movement Counts Explained: Leveraging TMC Analytics for Better, Safer Planning
For efficient, safe, and climate-friendly streets, planners, engineers, and traffic managers use turning movement counts to understand intersection performance. Here’s how they work.
In transportation analysis, turning movement counts (TMC) quantify the amount of traffic entering and exiting an intersection during a given period of time. These counts are often used to evaluate and implement intersection improvements that impact traffic operations, congestion, and safety.
Turning movement counts have aided traffic planners and civil engineers for decades. Manual two-hour TMCs originated in the 1950s, collected by workers who sat on street corners, pencils and paper in hand. In the 1970s, pneumatic tube counters made 24- and 48-hour counts possible. With today’s technology, on-demand analytics take TMC analysis to new levels.
Turning movement counts improve traffic flow, inform road upgrades, and much more, serving traffic planners and engineers alike. In this post, we’ll cover:
How turning movement counts are collected
The most common uses for turning movement data
How on-demand TMC analytics are making transportation work easier and more impactful
How Are Turning Movement Counts Collected?
Traditionally, manual data collection at intersections involves the use of turning movement counters. For example, to track eastbound traffic at an intersection, technicians using electronic count boards note vehicles making right turns, left turns, or continuing straight through the intersection. Pedestrian and bicyclist movements are often recorded as well.
What Challenges Exist in Collecting Turning Movements?
Manual TMCs require that a technician accurately count every vehicle passing through the intersection. Obtaining accurate TMC is both laborious and limited in scope. In fact, it is not possible to use this method to get TMC for every intersection and for every relevant time period. Collection costs frequently restrict data collection to a day or two per year, and to limited parts of the day.
For this reason, agencies relying exclusively on manual counts may only gain a limited understanding of travel patterns. When extrapolating this limited data sample to a month or a year, planners and engineers often have to take findings with a grain of salt.
In response, automated data collection and analysis is gaining traction. Typically, automated traffic counters feature rubber tubes that detect wheels on straightaways. However, they’re limited in angled applications like intersections, as wheels on the same axle might hit the rubber tube at different times. Because these tools don’t account for the different angles at which vehicles enter intersections, traditional traffic counts may sometimes deliver flawed outputs. It is also cost-prohibitive to install traditional counters at every intersection.
Today, the use of Big Data provides a viable alternative. Big Data approaches to transportation analysis often combine location pings from connected vehicles and the Internet of Things with other data sources like road network maps and census data to algorithmically deliver analytics on how vehicles, people, and bicycles move.
This means that Big Data analytics deliver TMC without increasing infrastructure or labor costs for transportation agencies. For example, with Streetlight TMC, 24/7 counts for almost every intersection, signalized or not, are available for virtually every road in the both the United States and Canada.
How Turning Movement Count Data Is Used
Regardless of collection method, engineers, traffic planners, and even business owners can use TMC data for a variety of important purposes. Examples include:
Traffic management and related topics like:
Commute planning
Tourism planning
Safety planning
Retail site selection
Traffic Management
Signal timing is often key to dealing with traffic congestion. And because congestion may be impacted by multiple intersections and indeed multiple roadways impacting one another, cities often need reliable turning movement counts for dozens of intersections or more in order to diagnose and address clogged traffic.
Signal retiming and optimization is one of the most cost-effective methods for managing traffic. In one study, the City of Boston noted just how cost-effective signal retiming can be.[1] When planners analyzed one-third of the city’s traffic signals in 20 travel corridors, retiming delivered a benefit-cost ratio of at least 83:1. Meanwhile, signal retiming plus various physical enhancements delivered a benefit-cost ratio of 61:1.
In general, modern TMC software can do much to overcome the challenges associated with staffing or budgetary shortfalls.
See how agencies are using TMC analytics to get traffic flowing safely
Traffic congestion typically spikes during morning and evening rush hours, when commuters are driving, biking, or walking to and from work. For this reason, commuting behaviors are of particular interest to traffic management efforts, especially when it comes to reducing congestion and addressing the concerns of constituents who may be impacted by long commutes.
Turning movement counts allow planners to accurately measure the impact of commuters on overall traffic patterns. Since commuter traffic typically flows one way in the morning and the opposite way in the evening, it’s important to have granular TMC data that can guide signal retiming and other traffic flow based on time of day.
Tourism Planning
Many communities see dramatic increases in vehicular, cyclist, and pedestrian traffic during the tourist season. This might be the summer for beachside communities, or the winter ski season for mountain communities. Cities that experience a major influx of seasonal tourists rely on TMCs to cope with changing traffic volumes and patterns that can turn free-flowing intersections into gridlocked roadways.
Safety Planning
Intersection safety has been a concern since motorized vehicles hit America’s streets. The first vehicle-related pedestrian fatality in the United States was recorded in 1899, when an electric-powered taxi struck a man who just stepped off a curb in Manhattan.[2]
In the United States, pedestrian fatalities have increased 80% since 2009.[3] According to the Institute for Transportation and Development Policy (ITDP), 55% of cyclist injuries and 26% of fatalities in the U.S. in 2020 occurred in intersections. Meanwhile, 41% of pedestrian injuries and 15% of pedestrian fatalities happened at intersections.[4]
Congestion can contribute heavily to these types of accidents. TMCs help officials identify effective ways to move vehicles through intersections, improving traffic flow while enhancing the safety of busy streets and thoroughfares.
In the video below, Joe DeVore of engineering and planning firm, KLJ, explains how the firm used StreetLight TMC to get a fuller picture of intersection safety and congestion in Minnesota, when traditional data collection methods would have limited analysis to peak traffic hours.
Retail Site Selection
Understanding traffic is also key to the selection of sites for retail businesses. Business stakeholders value locations that offer safe and convenient ingress and egress, as consumers often shy away from businesses where it is too difficult, dangerous, or time-consuming to arrive and depart.
Turn directions can significantly impact visitation to brick-and-mortar businesses. In the U.S., where vehicles travel on the right side of the road, right turns are typically much quicker, easier, and safer than left turns, meaning a business on the right side of traffic is likely to get more customers. Retailers can therefore use turning movement counts to choose which corner will be the most advantageous for a new store location, based on how many people are turning in each direction.
The Power of On-Demand TMC Analytics
For signal re-timing and other applications, traditional 48-hour TMCs may deliver insufficient sample sizes, and they can put members of your team in harm’s way. By comparison, modern analytics like StreetLight TMC use Big Data methods capable of providing TMC for the exact periods desired.
This enables planners and engineers to spend less time gathering data and more time analyzing it.
For example, in Brownsville, TX, when the pandemic foiled attempts to obtain accurate traffic counts, Hanson Professional Services used StreetLight’s on-demand TMC data to understand traffic flow at intersections during “typical” months – that is, months not impacted by holidays or vacation periods. After analyzing 200 traffic signals, Brownsville retimed 50 signals in order to improve traffic flow and safety.
Similarly, in Temecula — a bustling city of 112,000 in California’s Riverside County — city officials strategically deployed safety grant funds to better synchronize signals after freeways had grown congested to the point of gridlock. Engineers used StreetLight to collect historical TMC data at 40 key intersections in the city in a matter of hours. This allowed them to compare weekday and weekend traffic patterns to more precisely understand when traffic peaked and retime signals to unclog major thoroughfares.
To learn more about how StreetLight processes and validates turning movement data, check out our TMC validation white paper.
Boston Transportation Department and Howard/Stein-Hudson Associates, Inc. “The Benefits of Retiming/Rephasing Traffic Signals in the Back Bay.” March 2010.
Long, Tony. “Sept 13, 1899: New Yorker Becomes First U.S. Pedestrian Killed by Car.” Wired. September 13, 2011.
Insurance Institute for Highway Safety, Highway Loss Data Institute. “Fatality Facts 2021, Pedestrians.” May 2023.
Institute for Transportation & Development Policy. “We Need to Make Intersections Safer for Pedestrians and Cyclists.” August 17, 2022.
Put other agencies' TMC strategies to work for your community
Explore the resources listed above and don’t hesitate to reach out if you have any questions. We’re committed to fostering a collaborative community of transportation professionals dedicated to building a better future for our cities and communities.
Fast-Track Congestion Management Solutions With StreetLight’s New Tool
Fast-Track Congestion Management Solutions With StreetLight's New Tool
When managing congestion, agencies often face funding and staff limitations that prevent comprehensive, region-wide analysis. StreetLight’s new Congestion Management tool delivers at-scale congestion trends for a whole city, county, or census tract.
Worsening congestion means lengthy commutes, compromised road safety, high emissions, and lots of unhappy road users stuck in traffic. To solve gridlock and keep traffic flowing, data-informed congestion management is critical. But region-wide data collection is costly and time-consuming, delaying much-needed improvements.
To remove these barriers and help agencies fix congestion faster, StreetLight’s new Congestion Management QuickView tool delivers at-scale congestion analysis for an entire region in just a few clicks.
Here, we’ll walk you through this new tool step by step and explore how you can use the tool to:
Save time with easy analysis set-up, no GIS skills required
Quickly compare congestion trends for counties, cities, or census tracts
Access shareable results and visualizations to keep stakeholders and the public informed
Prioritize projects and justify infrastructure investments
Congestion Management QuickView in Action
Setting up a Congestion Management QuickView analysis is quick and easy — and unlike other congestion analysis tools, it does not require proficiency with GIS software. That means anyone at an agency or consultancy, regardless of technical background, can use the tool to get quick congestion insights for an entire region.
There are four basic steps to analyzing congestion trends with StreetLight’s Congestion Management QuickView tool. Here’s how we set up an analysis for Tyler, Texas.
Step 1: Select the region
Tyler, Texas, is a mid-sized MPO with an East-West interstate (I-20) and other major corridors running through its central business district. The Congestion Management QuickView helps mid-sized MPOs (and other agencies) access high-level insights that would be challenging to gather manually.
Congestion Management QuickView results upon searching for the region of interest and filtering geographies via County, City, or Census Tract
Step 2: Select road classifications
For a broad look at city-wide congestion trends, motorways, on/off ramps, trunks, primary, secondary, and tertiary roadways are all included in our analysis.
Each road classification can be analyzed individually or grouped with other road types to refine the scope of analysis and compare congestion trends across different road types.
Congestion Management QuickView tool results upon refining the geographies further with Road Classification filter
Step 3: Select the data period
Choose from available data periods to understand how congestion has changed for your region.
Step 4: Review your results
StreetLight’s Congestion Management QuickView provides various performance reliability measures, including travel time index, planning time index, unreliable segments, volume, speed, delay hours, and VMT.
Key congestion metrics summarizing congestion trends in Tyler, Texas
With the parameters we’ve selected, we reveal a few key insights for Tyler, Texas:
The traffic in the region follows typical patterns of morning and evening peak hours.
With a reliability factor of 89%, most miles of roadway in Tyler have consistent travel times, but 11% have higher variability.
A travel time index (TTI) of 111% reveals that trips take 11% longer to complete during average conditions compared to free-flow speeds. For example, a 30-minute trip takes about 33 minutes to complete.
A planning time index (PTI) of 181% shows that when congestion is at its worst (the 95th percentile travel time), trips take 81% longer to complete compared to free-flow conditions. This means a 30-minute trip would take over 54 minutes to complete during the worst traffic conditions.
These results suggest that congestion in Tyler, Texas, is moderate. These 11% of roadways with high-variability warrant further investigation with the most potential for improvement.
Congestion Management QuickView reveals the daily average (all hours) for Vehicles Miles Traveled and Travel Time Index in Tyler, Texas
Comparing Geographies with the Congestion Management QuickView
Congestion Management QuickView can also be used to prioritize specific corridors or segments in Tyler, Texas, for further planning or investment.
One way to do this is by using the road classification filter to analyze specific road types. For example, by comparing primary roadways to secondary and tertiary roadways, we can begin to see how congestion impacts MPO residents versus regional and longdistance traffic.
Another option is to select specific corridors for analysis. In our example, we used the QuickView tool to develop a corridor filter for Interstate 20 and State Highway 31, which runs adjacent to I-20 but through the city’s central business district and connects to major recreational centers, including Lake Palestine, known for its bass and crappie fishing.
Congestion Management QuickView tool results upon comparing I-20 and SH-31
Results from comparing the VMT and Travel Time Index on I-20 and SH-31
Comparing these two corridors generates new insights:
I-20 has an hourly profile typical of rural interregional corridors.
I-20 has lower congestion levels than the region as a whole.
State Highway 31 has congestion levels similar to the region, but significantly higher Vehicle Hours of Delay than I-20.
Based on these results, we discover that I-20 may have some capacity that can be utilized for traffic diversion.
Enhancing QuickView Outcomes With StreetLight’s Advanced Analyses
StreetLight’s advanced analyses, including Top Routes, Segment Analysis, and Origin-Destination Analysis, can help zoom in further on these routes to either validate hypotheses or access more granular insights, such as custom zones and seasonal trends.Watch the full step-by-step process in under 4 minutes:


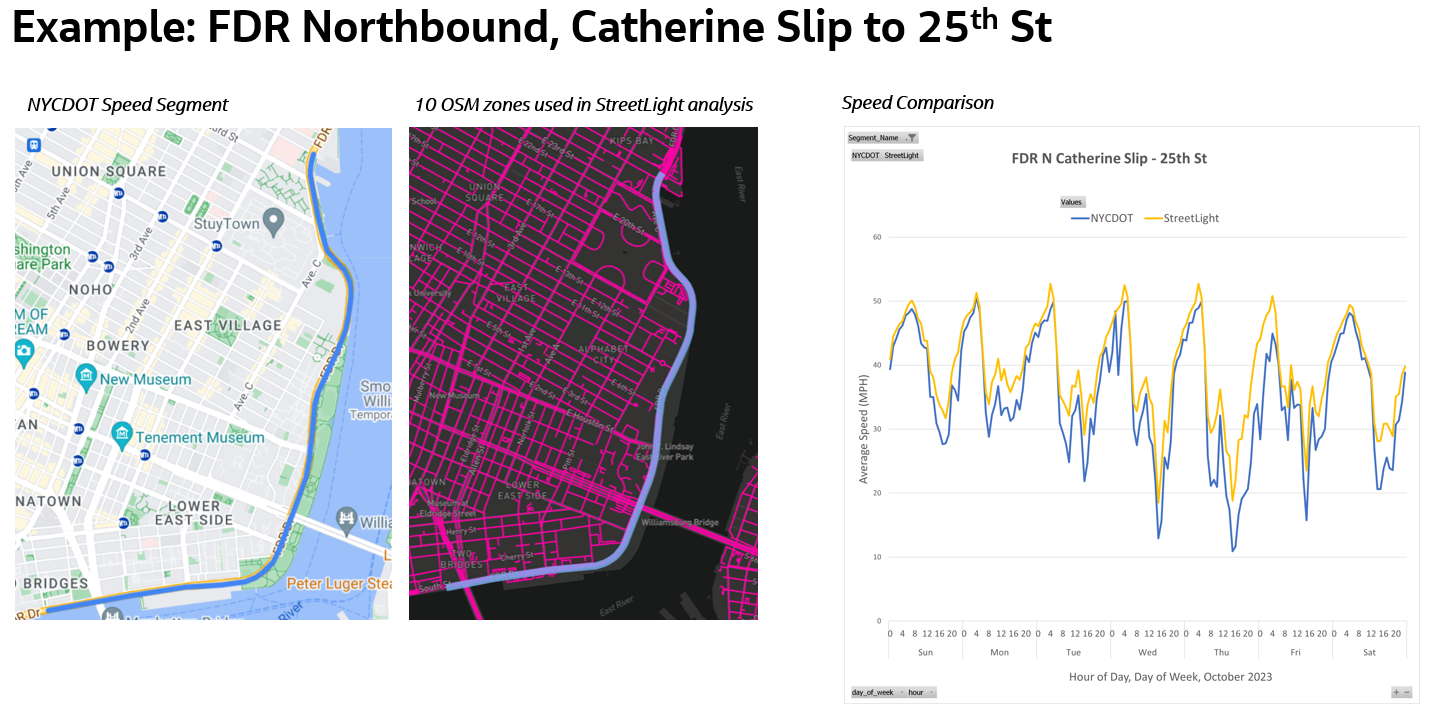
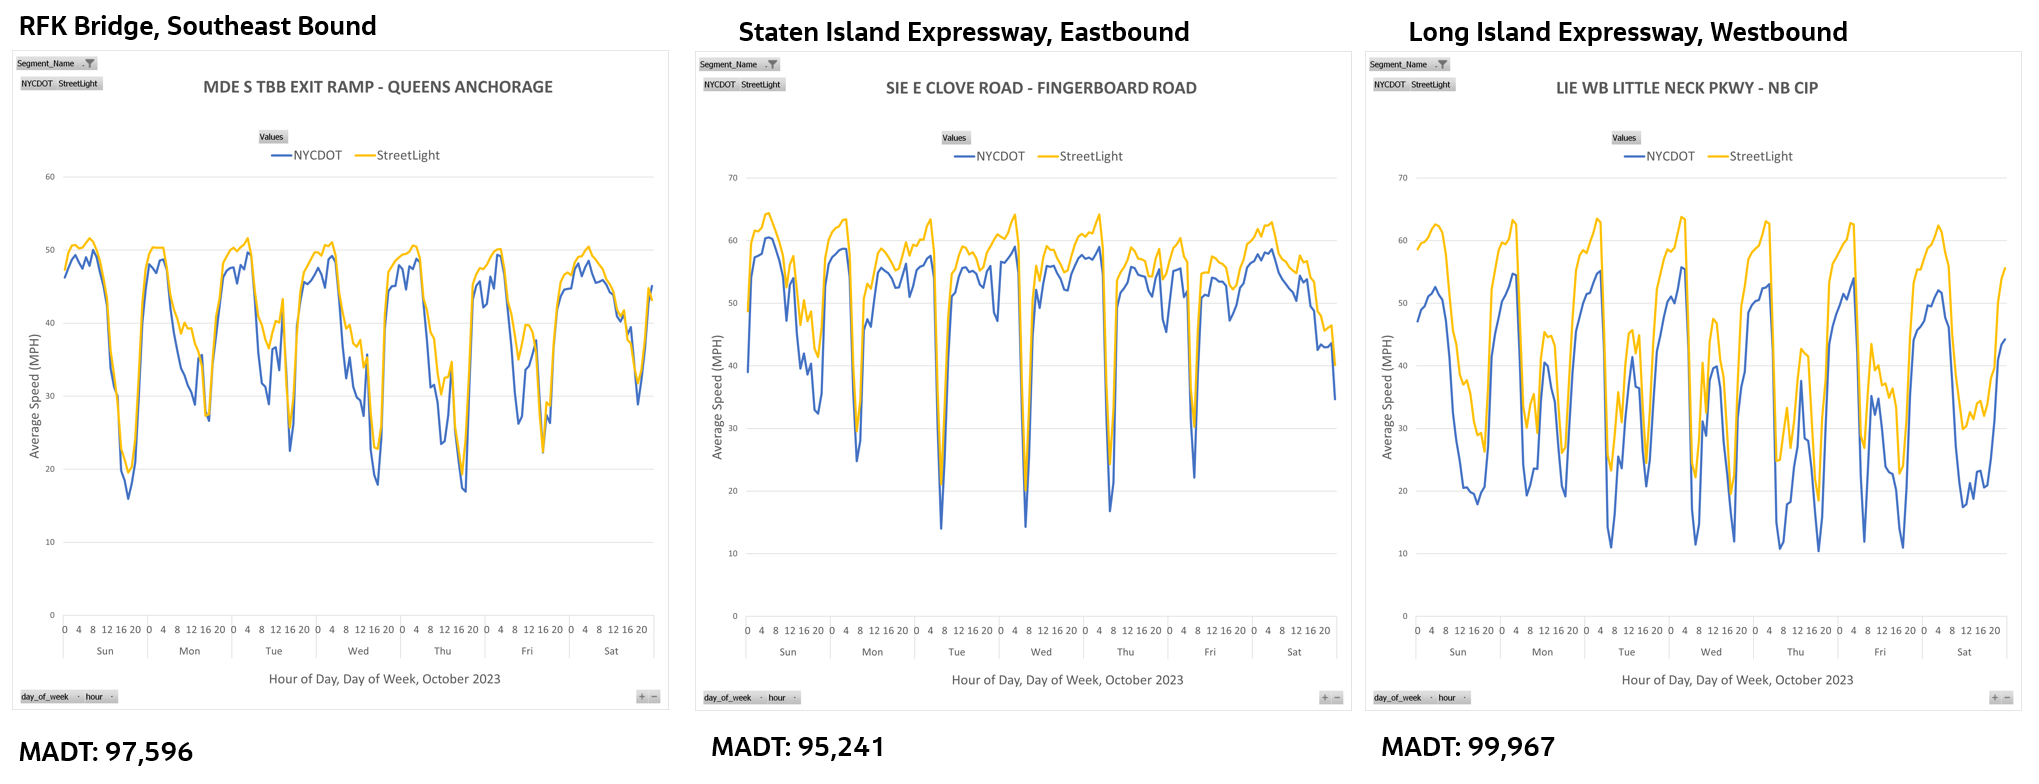
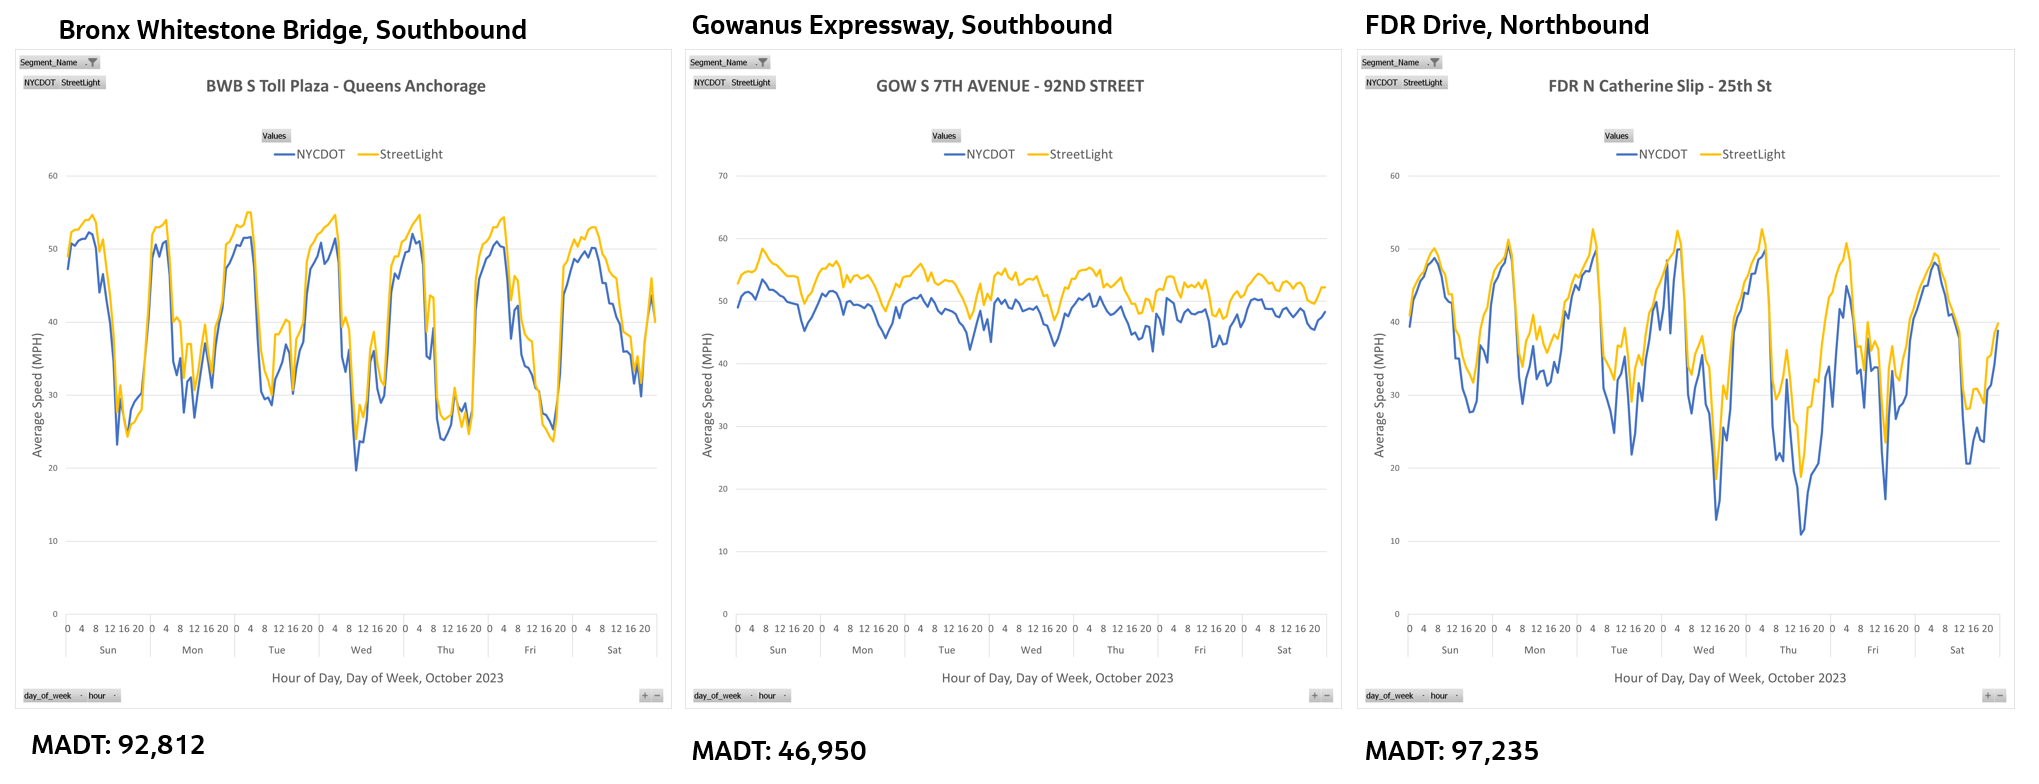

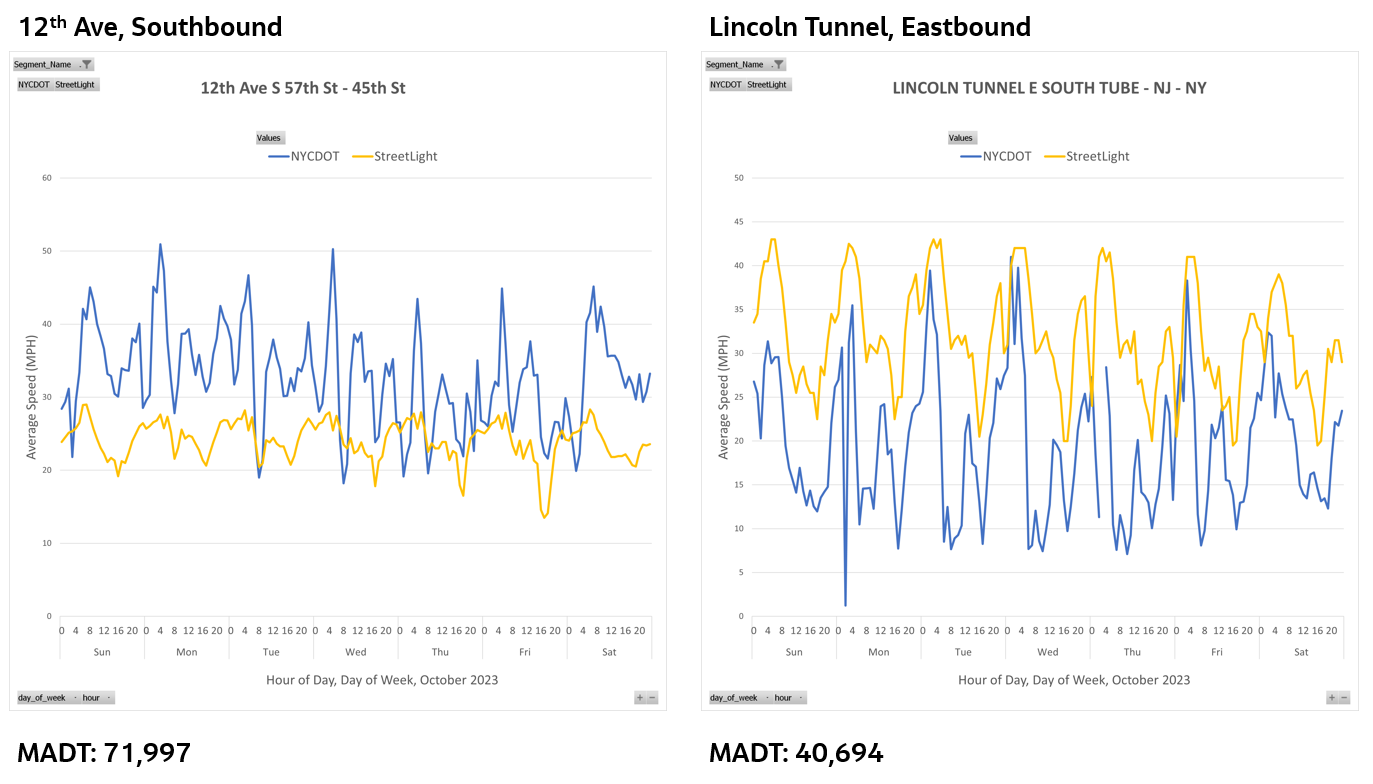


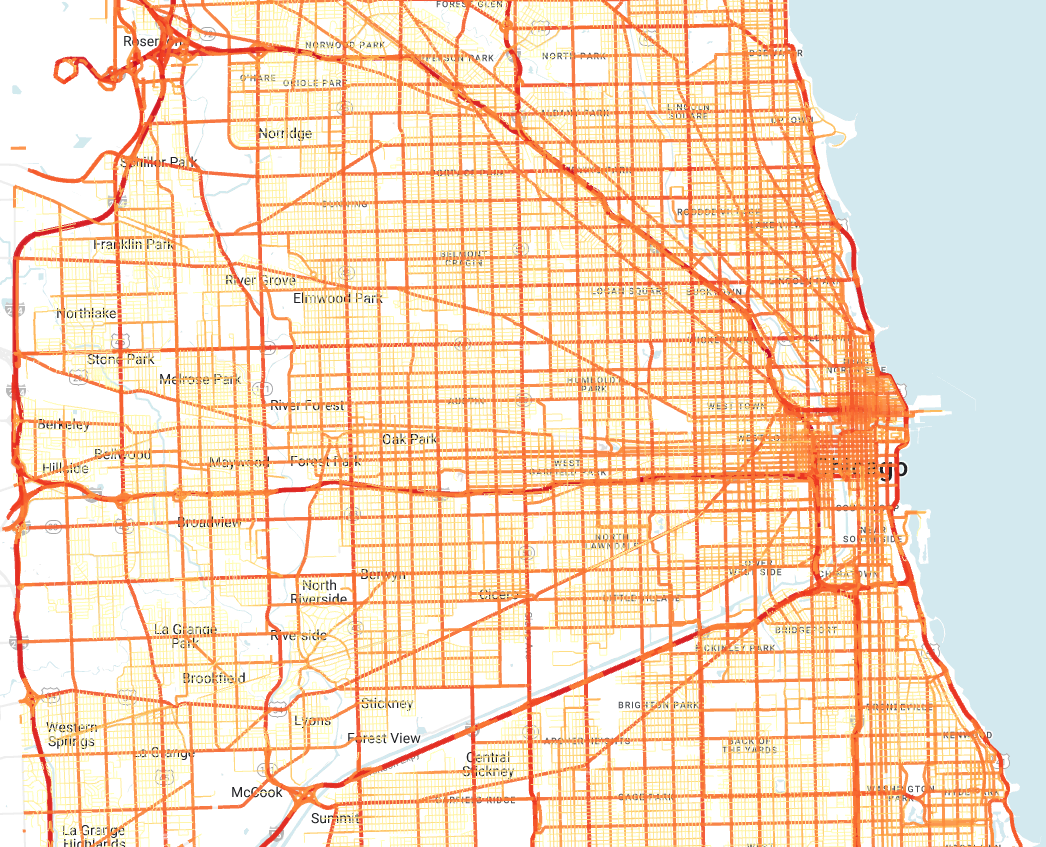
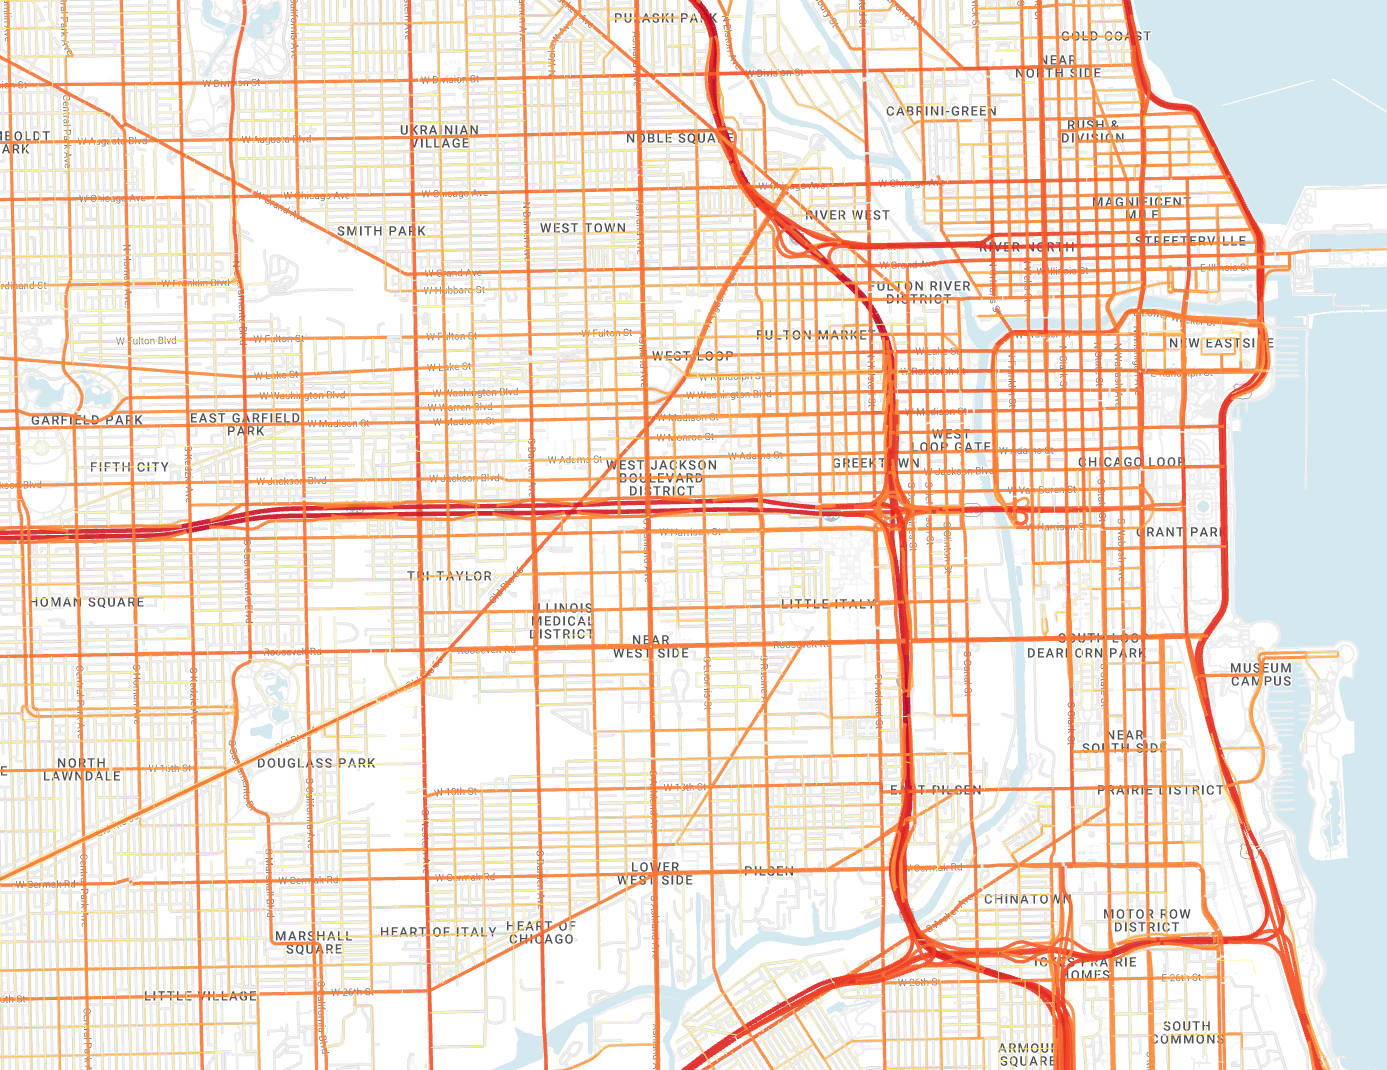
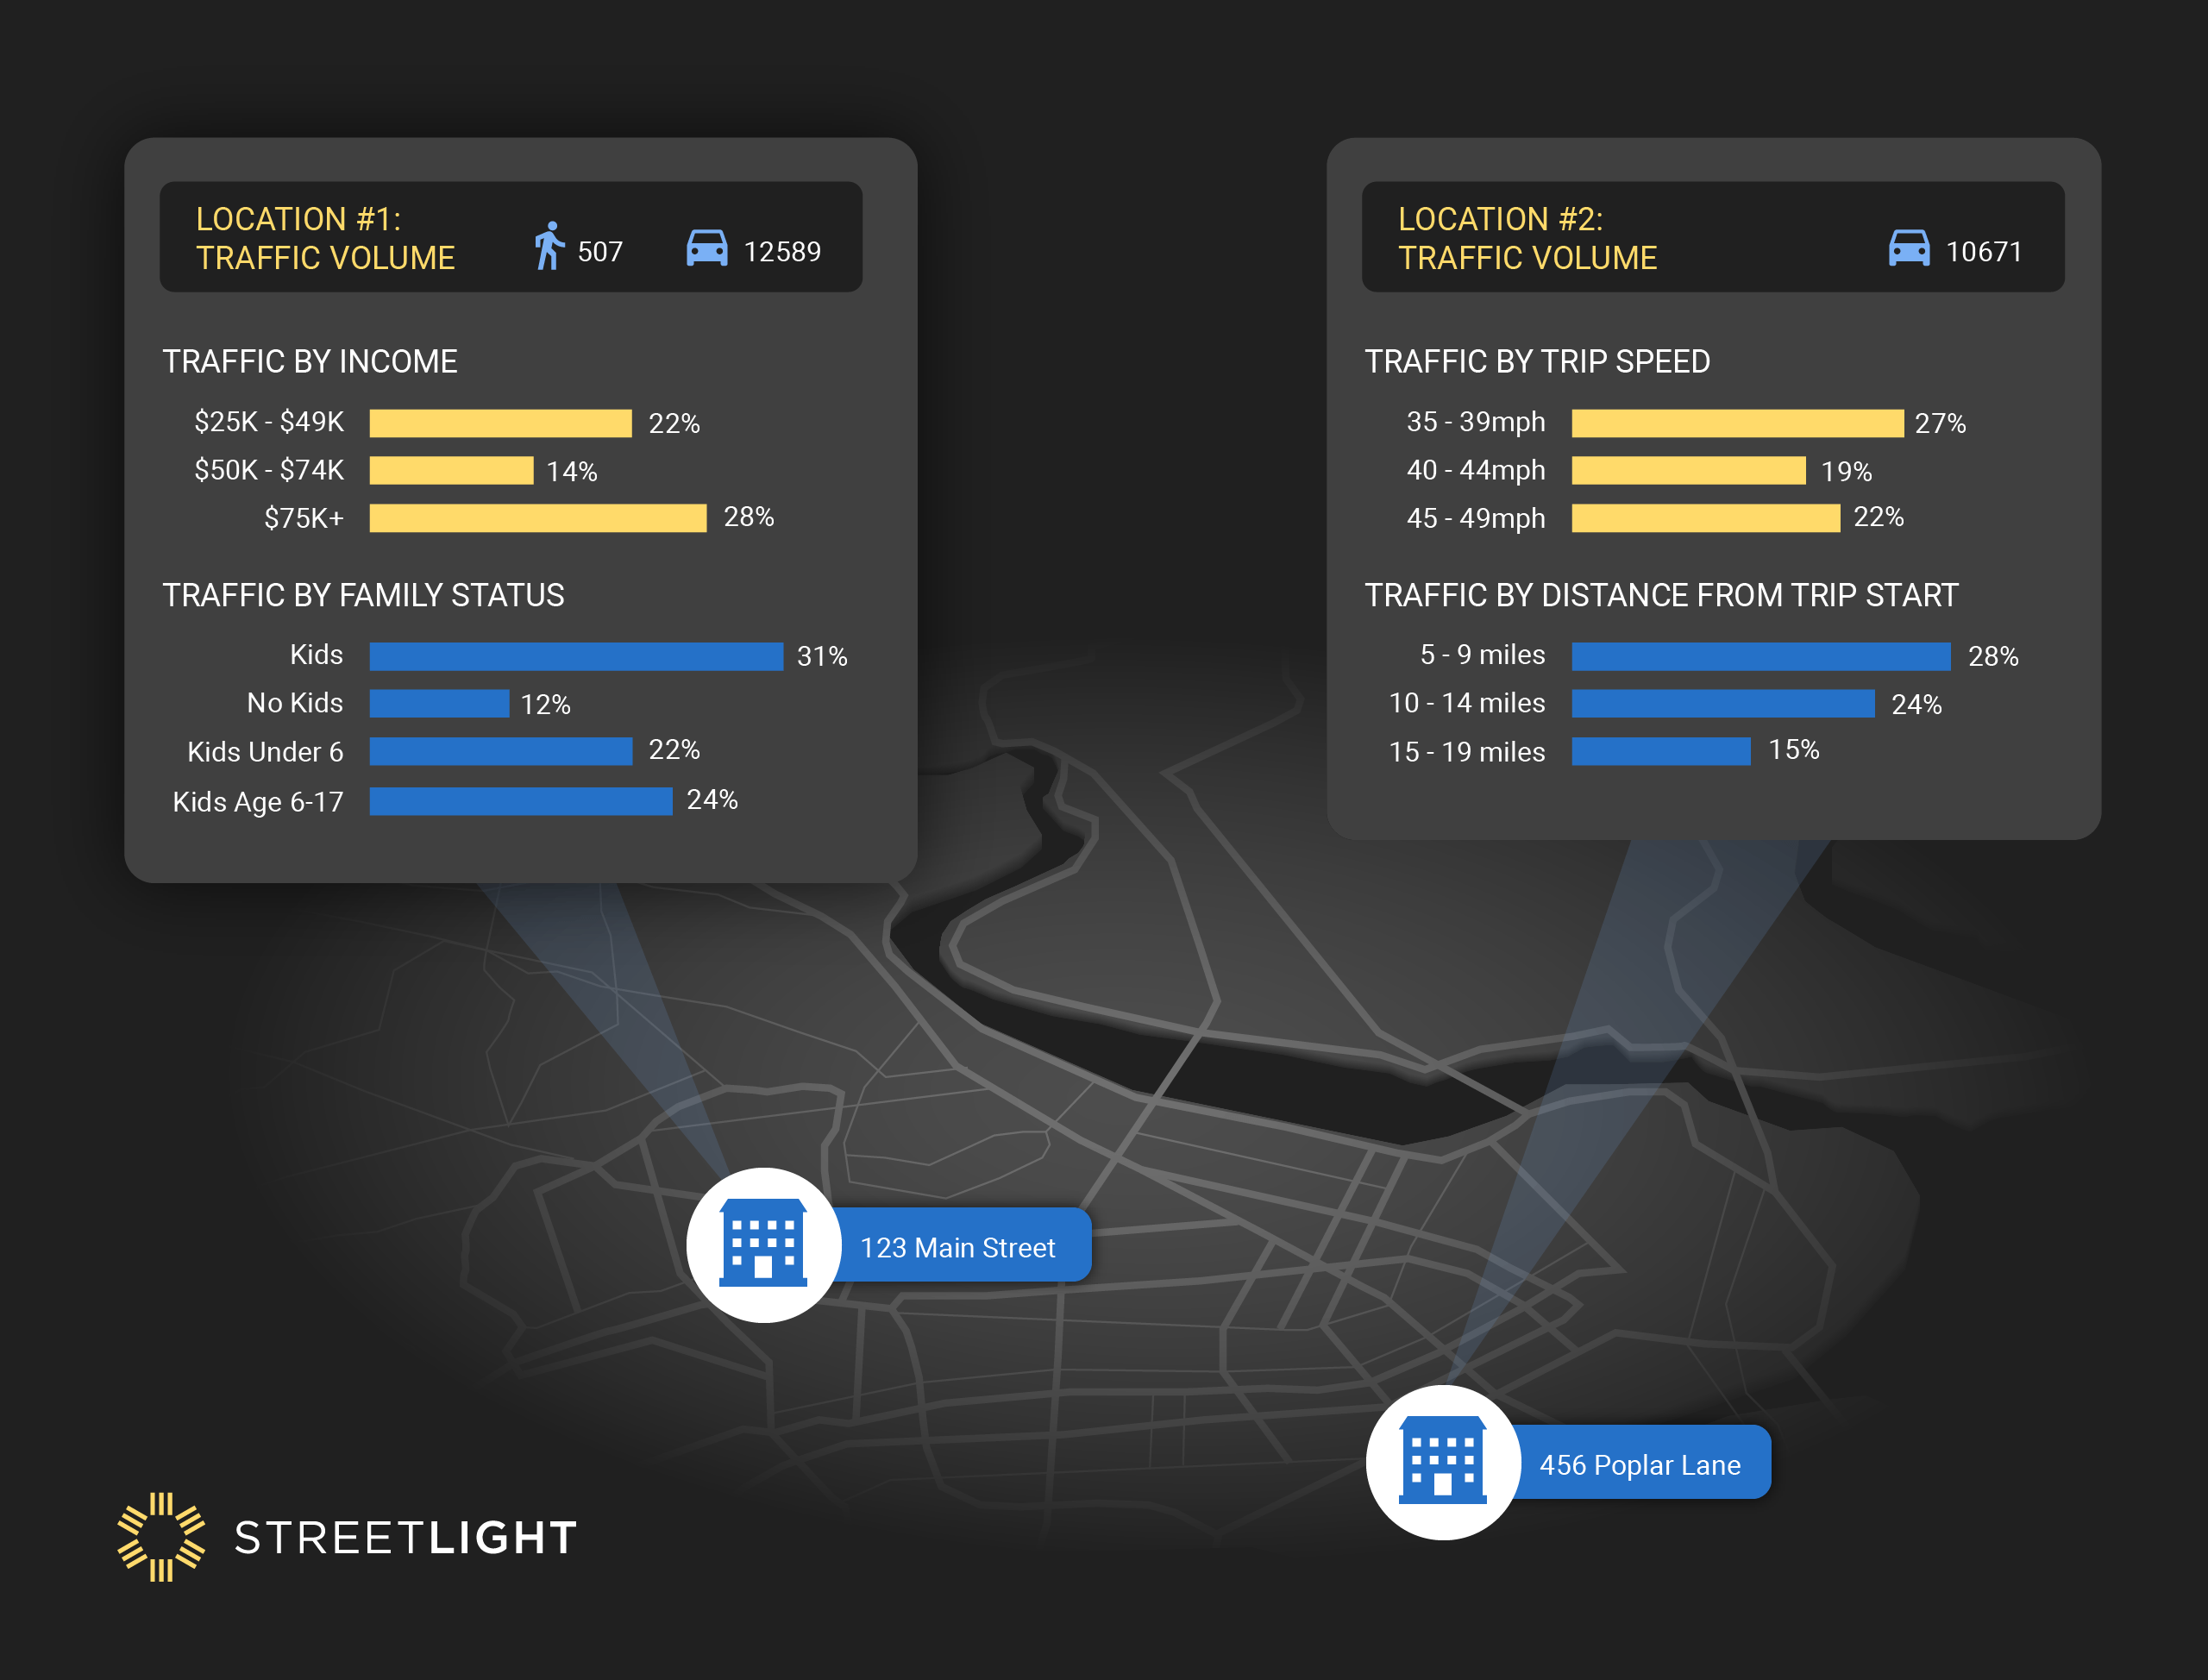

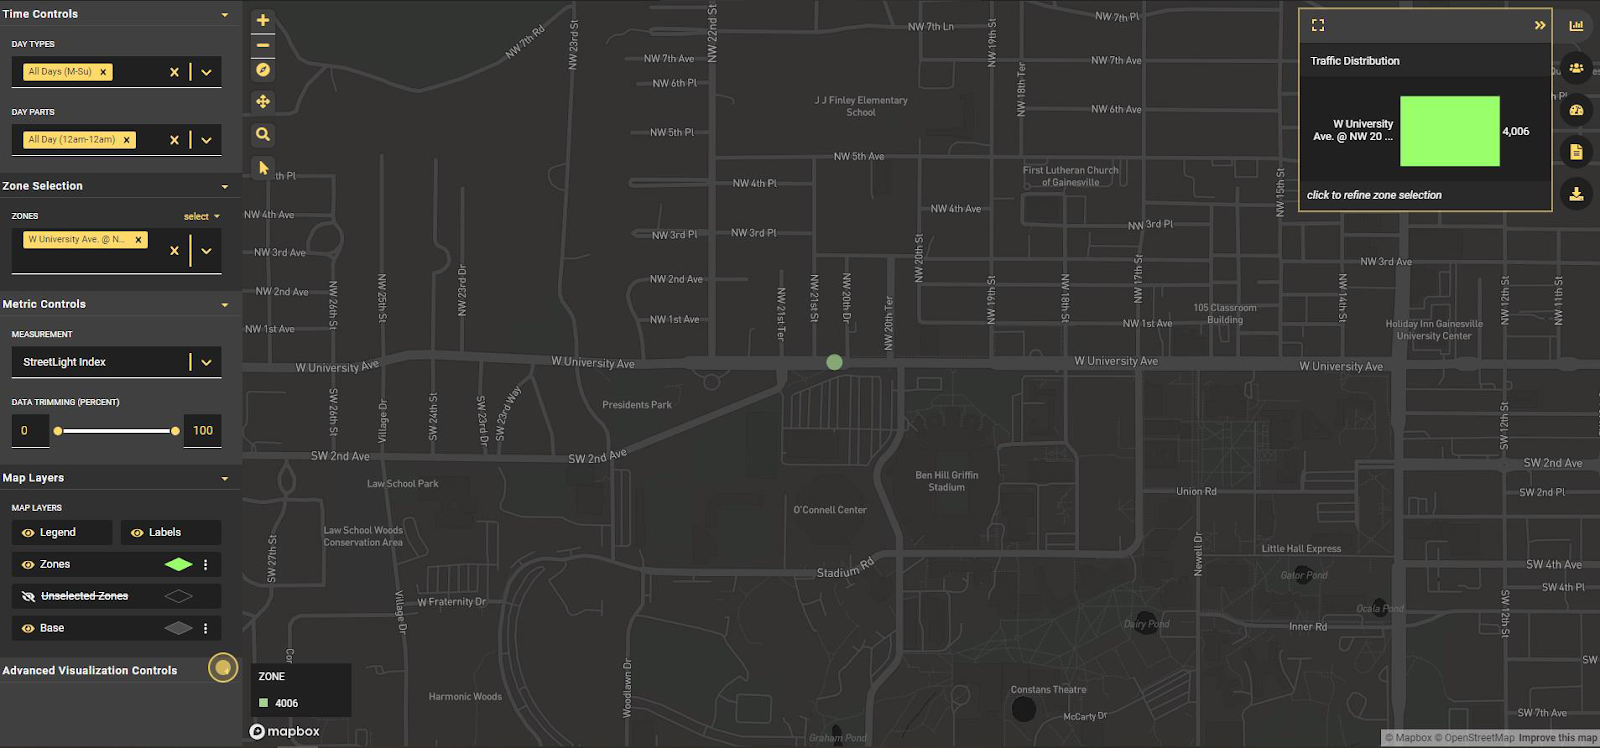
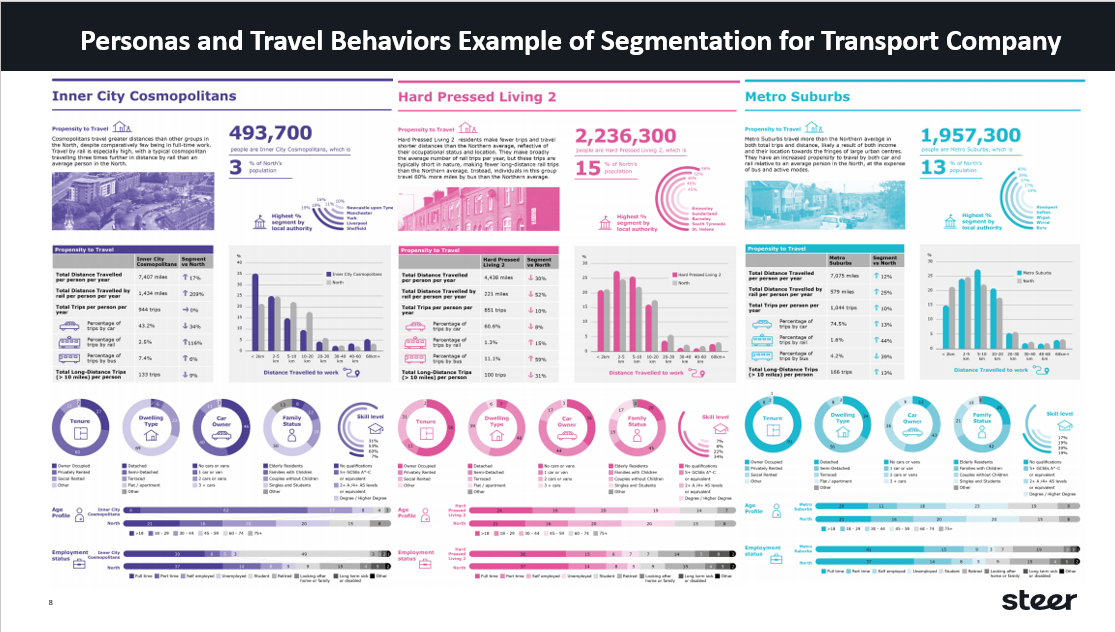
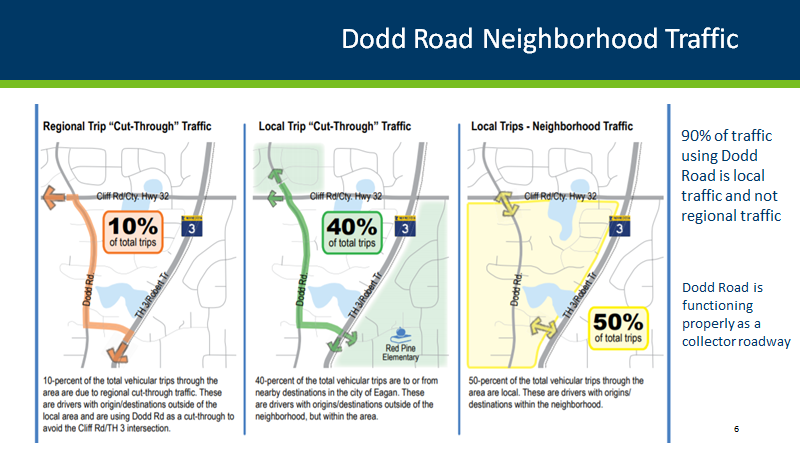


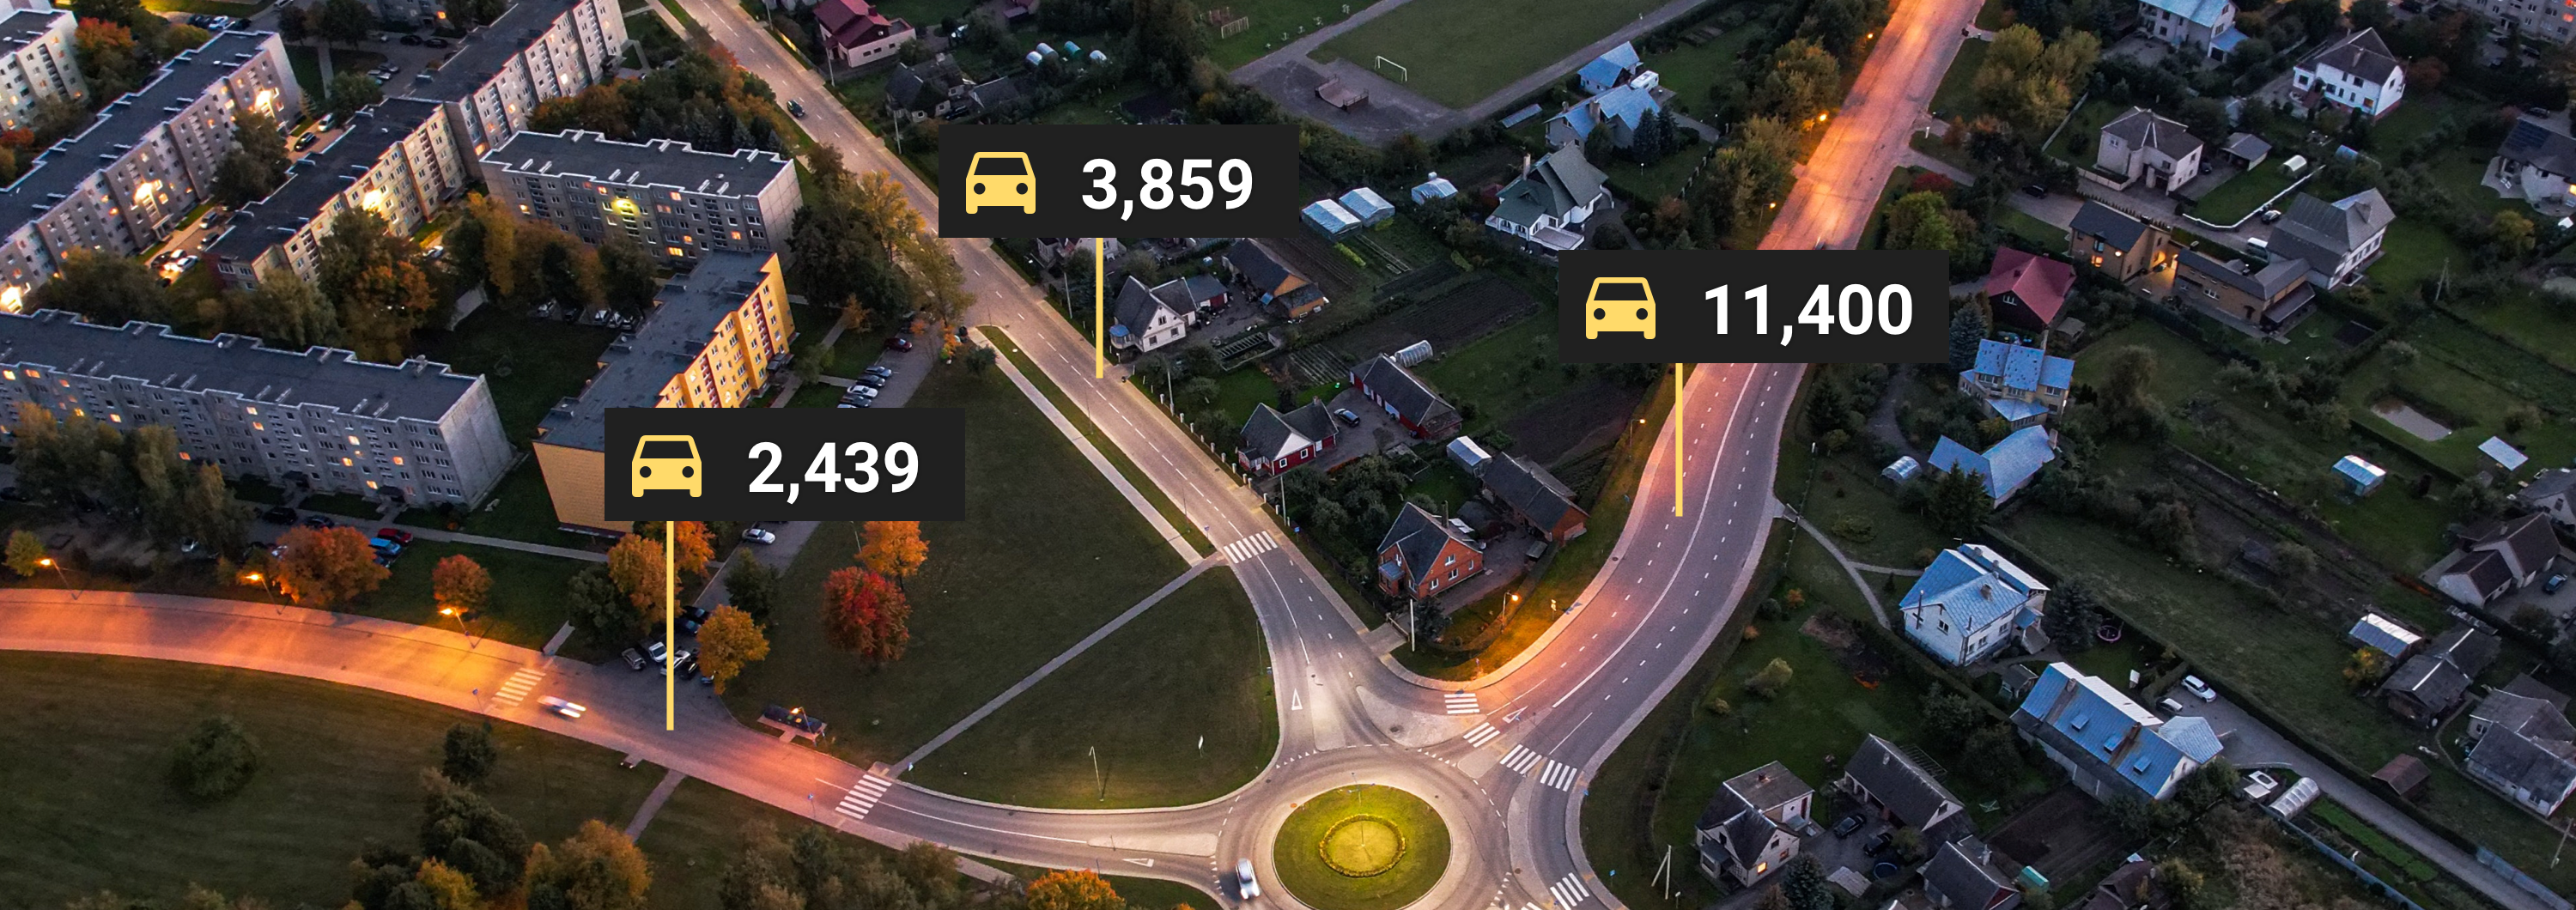
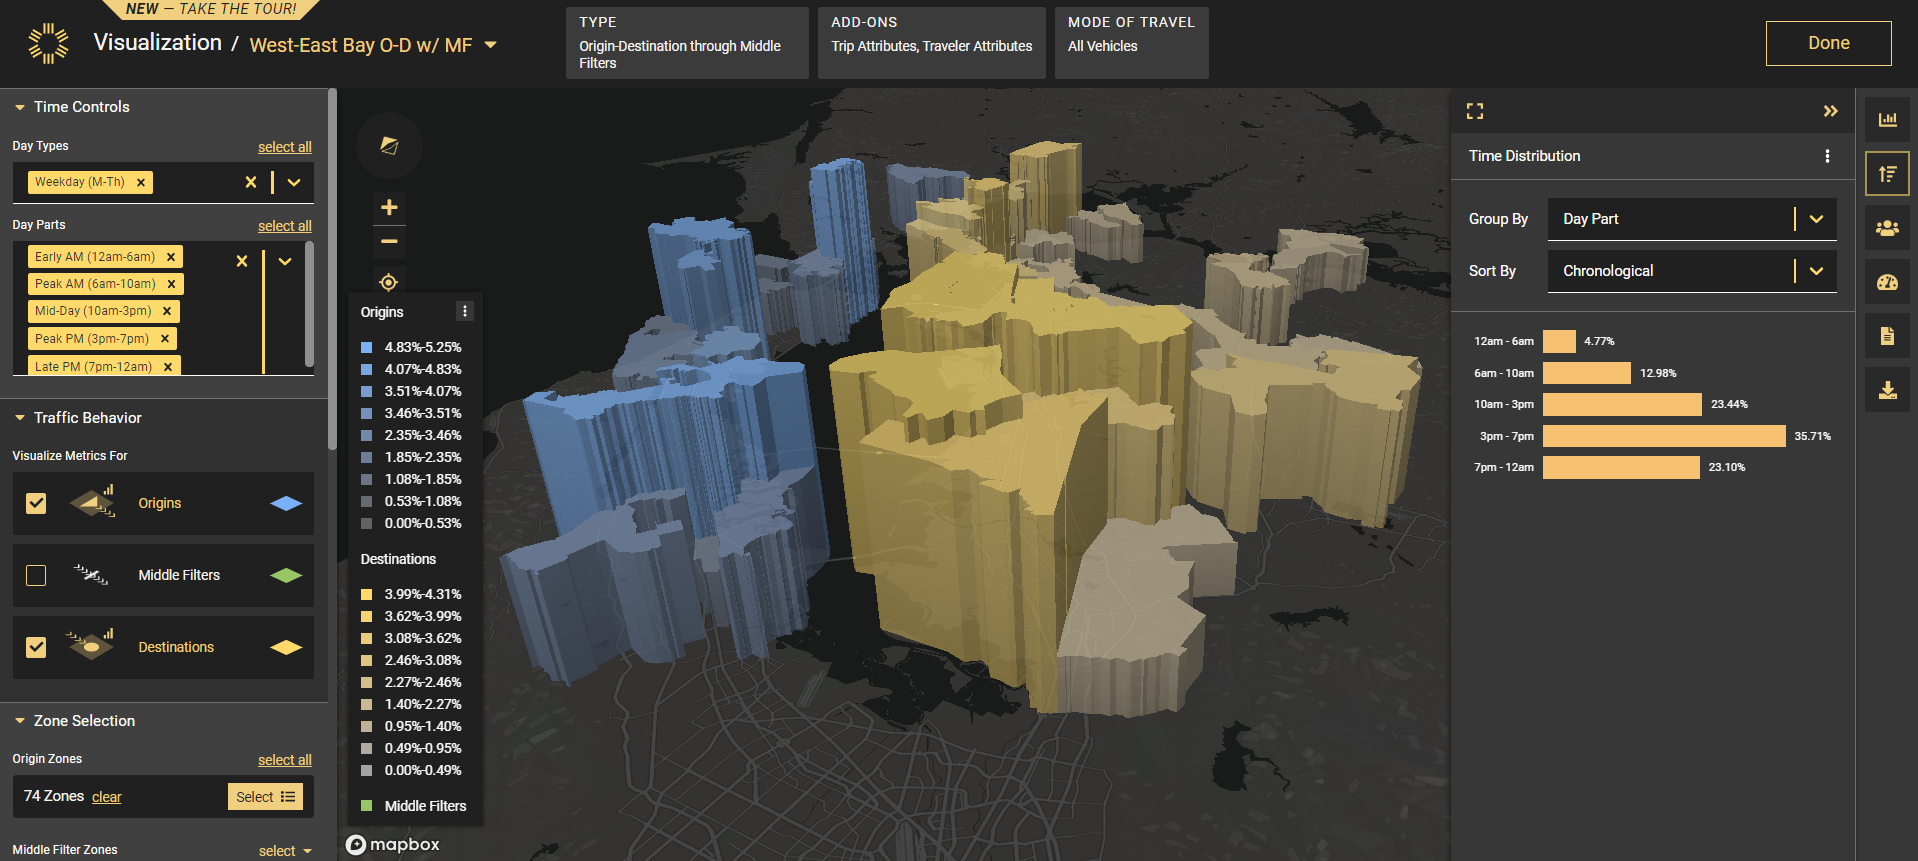
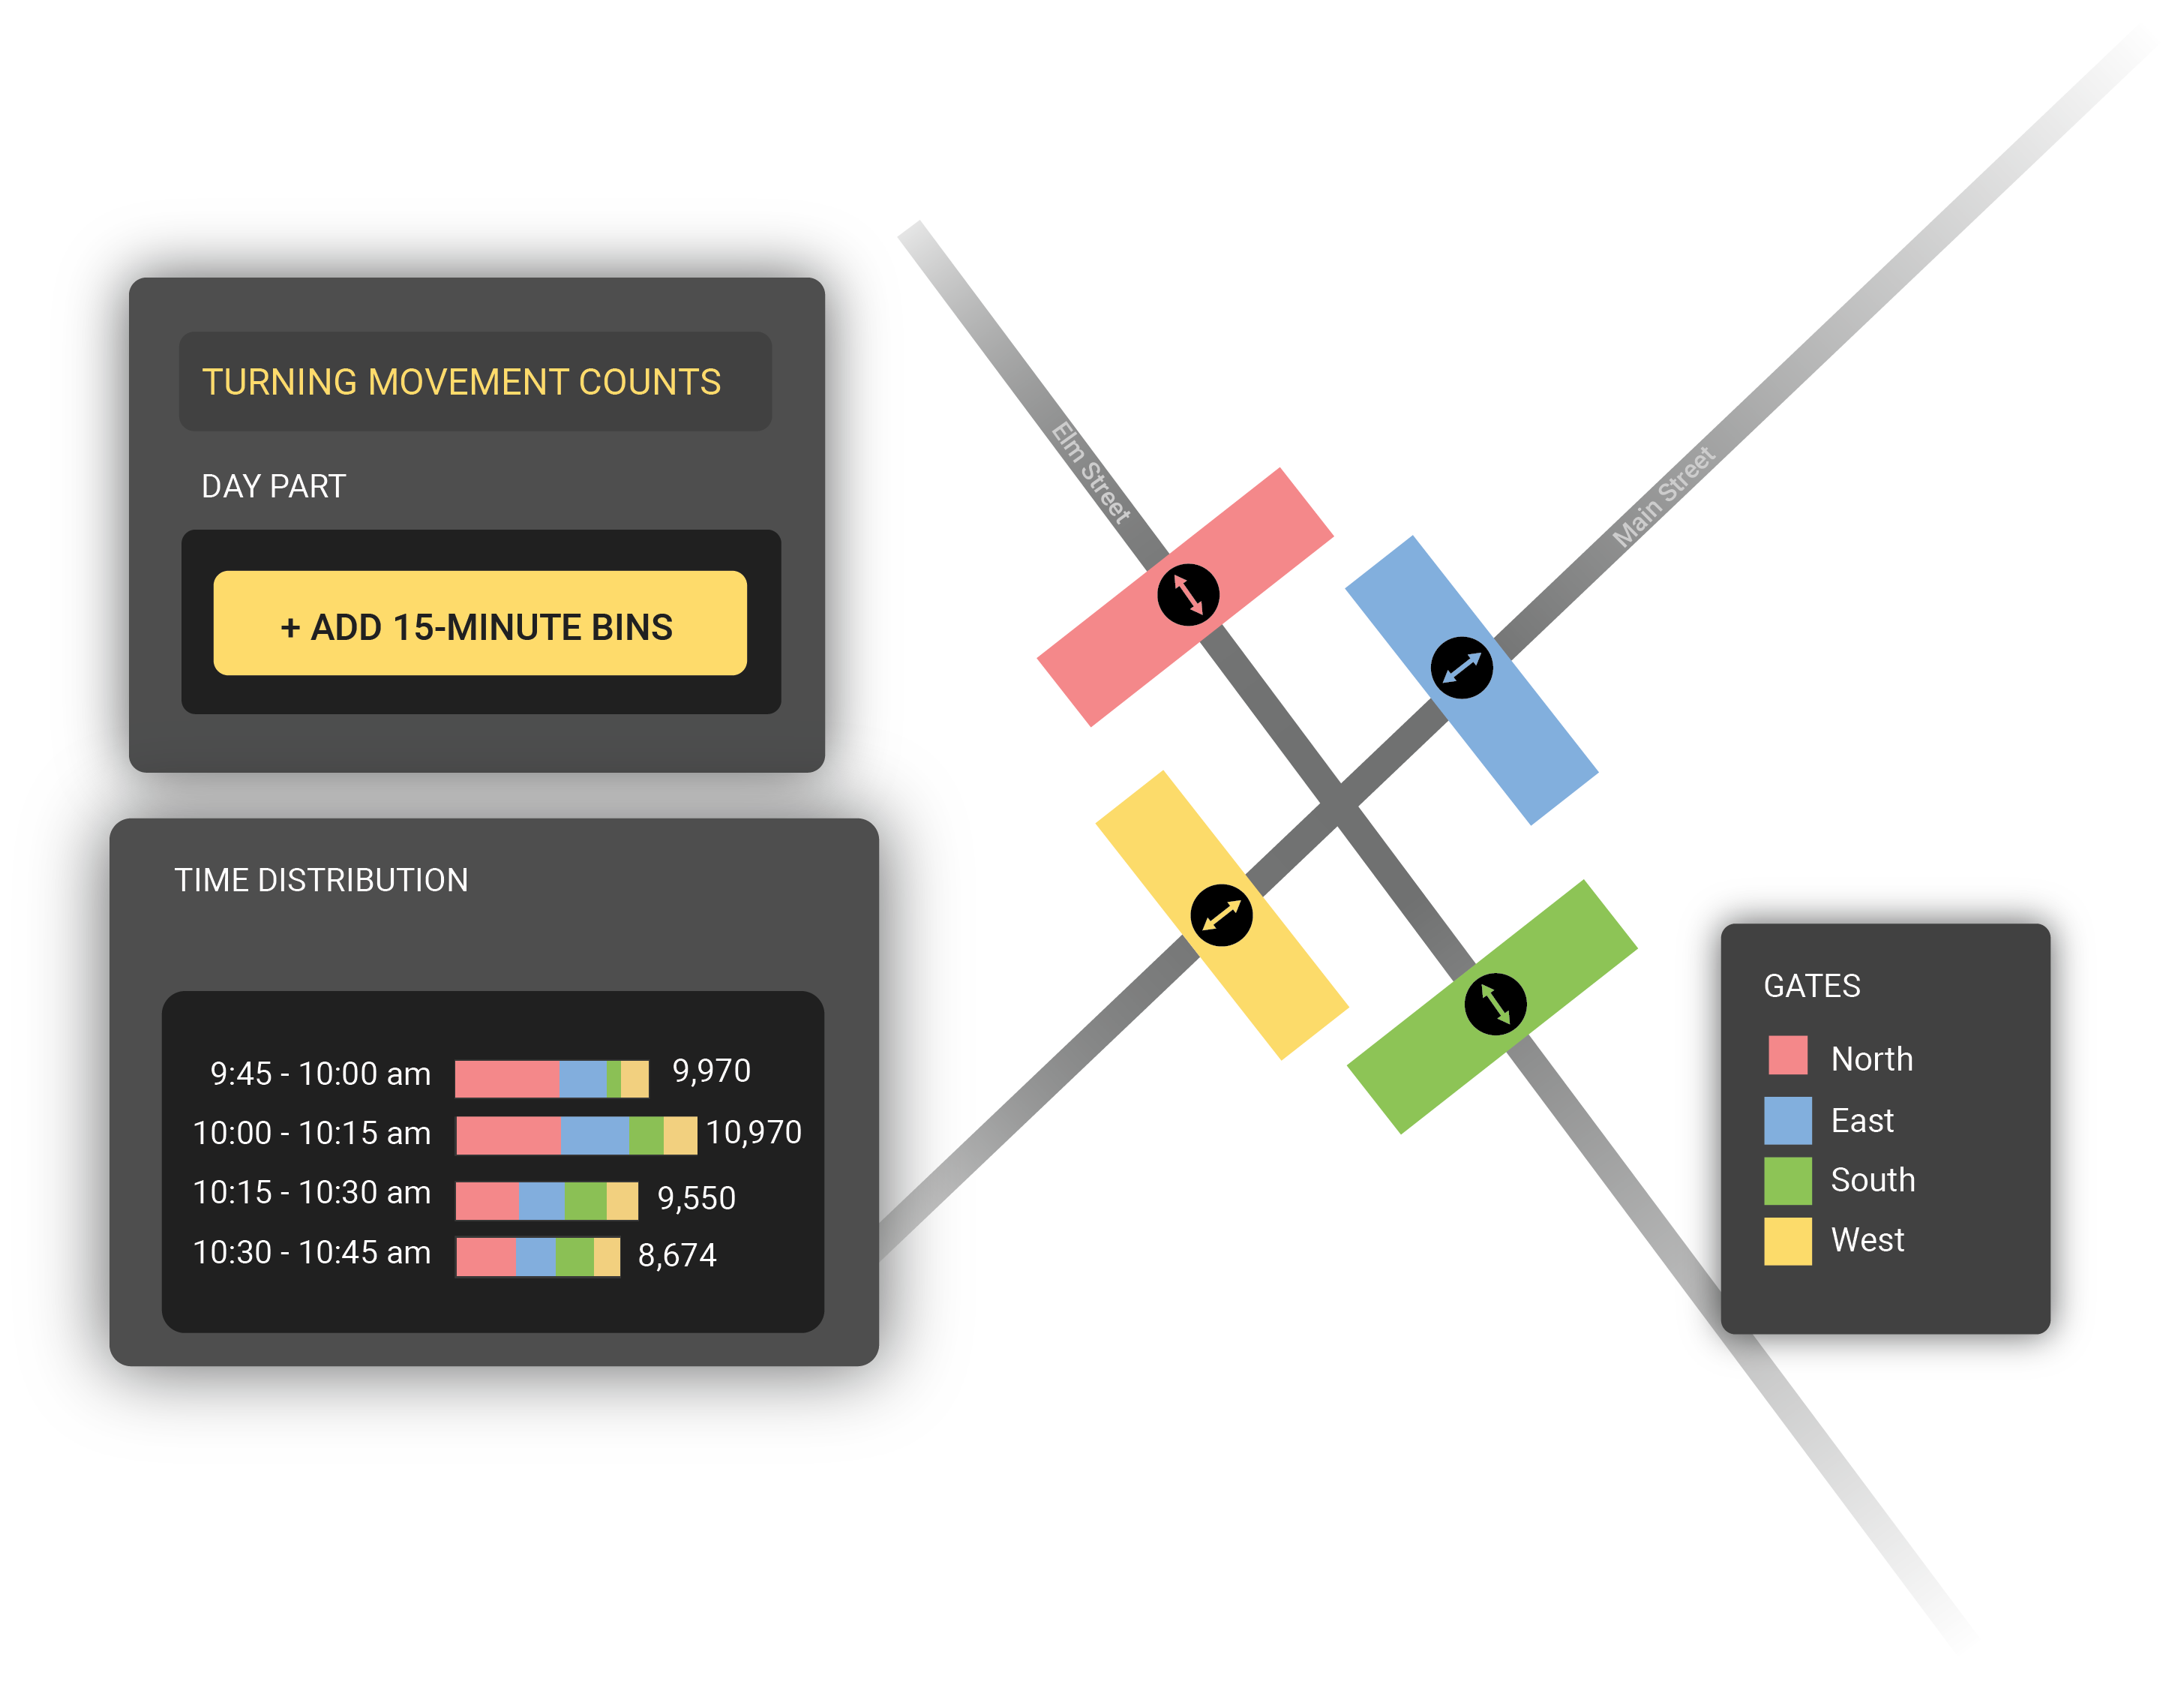
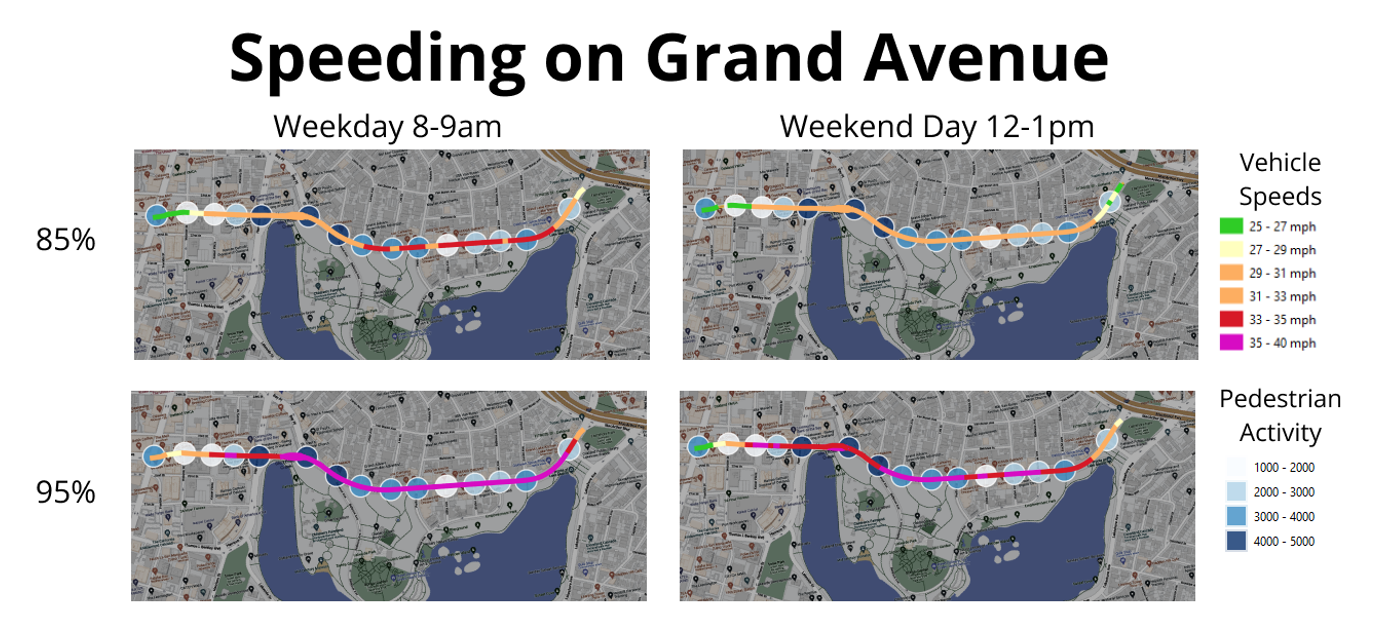