
What Traditional GHG Measurement Is Missing: 4 ways to reveal the full picture on emissions
To effectively reduce transportation GHGs, agencies and consultants need granular, actionable data that go beyond broad VMT numbers. StreetLight’s new GHG Emissions metrics — covering trucks, trip starts, EVs, and more — help them zero in.
With national and state governments working to decarbonize transportation, meeting steep emissions reduction goals requires accurate, local greenhouse gas (GHG) measurement. To effectively reduce emissions, establishing a baseline, identifying mitigation strategies, and measuring impact year-over-year is critical.
But quantifying GHG emissions for a city, county, or state isn’t as simple as calculating total Vehicle Miles Traveled (VMT) for the region. Nor is VMT measurement in isolation a particularly helpful tool for identifying reduction opportunities. Many factors, such as commercial vs. personal vehicle breakdown, trip origins and destinations, and the impact of EVs, influence total emissions and which reduction strategies will be most effective.
In our article How to Measure Greenhouse Gas Emissions From Transportation, we explain some of the key metrics behind accurate, local GHG measurement like VMT, Vehicle Hours of Delay (VHD), trip speed, and trip duration. Here, we’ll explore three data-driven analyses available within StreetLight’s new GHG Emissions metrics that agencies can use to develop impactful and ongoing decarbonization strategies.
Focus on GHG Emissions You Can Influence
When measuring GHG emissions, analysts typically start by calculating the total distance traveled in the area (VMT or VKT). This number is then multiplied by the amount of fuel required to power that travel, based on average fuel economy for the relevant vehicles in the area. Using standard emissions rates, the total gallons of fuel can then be converted into metric tons of GHG emissions, giving the total GHG emissions for the area.
These calculations can help establish useful estimates, but lumping all these individual trips together doesn’t tell the whole story.
To implement and evaluate effective decarbonization strategies for an individual city, county, or state, it’s important to understand what types of trips will actually be impacted by various emissions reduction efforts. For example, if a county has a major interstate running through it that brings in traffic from other regions, county-level emissions reduction efforts are unlikely to impact emissions incurred on that highway, since the traffic originates outside the scope of their jurisdiction.
These types of observations can inform how planners and policymakers tackle decarbonization in their region. For example, establishing a state-wide EV tax credit to encourage electric vehicle adoption will only impact emissions for trips that originate in the state — this tax incentive won’t impact the likelihood that trips originating in other states are taken in zero-emission vehicles (ZEV). In this case, states would need to work with one another to reduce inter-state emissions.
To gain clarity on the influence of different decarbonization strategies, understanding trip origins and destinations is key.
To put it simply, trips can either originate within a given region (such as a city, county, or state) or outside that region. Likewise, trips can either end within or outside of a given region. This creates four basic trip categories:
- Internal/External (i.e., trips that begin inside the region and end outside of it)
- External/Internal (beginning outside and ending inside)
- Internal/Internal (both beginning and ending inside the region)
- Passthrough (AKA External/External, beginning and ending outside the region).

Left: Many GHG calculations are based on VMT from all trips, without accounting for origins or destinations. Right: Segmenting trips based on origins and destinations either internal or external to the region results in four distinct trip types that can each be influenced by different decarbonization strategies.
Segmenting trips into these four types can help jurisdictions quantify the vehicle-based emissions under their control and implement GHG reduction strategies targeted at these trips. It can also help influence conversations across regional governments as they begin to coordinate efforts to better solve emissions at a larger scale.
When measuring greenhouse gas emissions for a given area using StreetLight’s metrics, agencies and consultants can use various methodologies that treat each of these four trip categories differently. A common standard is the Global Protocol for Community-Scale Greenhouse Gas Emissions Inventories (GPC) method, which we’ll call the Induced Activity Method. This method was designed to help cities focus on emissions resulting from “city-induced activity,” but other methods may be more useful depending on the jurisdiction and its goals.
One advantage of the Induced Activity Method is that it helps jurisdictions account for emissions resulting from induced demand (i.e., emissions from EI trips where their region is the attractor, such as when tourists travel to a state park or an event venue draws traffic from out of town). But a “Within Boundary Method” that only counts VMT occurring within the jurisdiction can be useful to agencies and consultants looking to understand how internal policy or infrastructure may impact local GHG emissions.
StreetLight’s GHG Emissions Metrics allow agencies and consultants to choose the emissions allocation methodology that suits their goals — either the Within Boundary Method or the Induced Activity Method — to ensure a reliable baseline GHG emissions number.
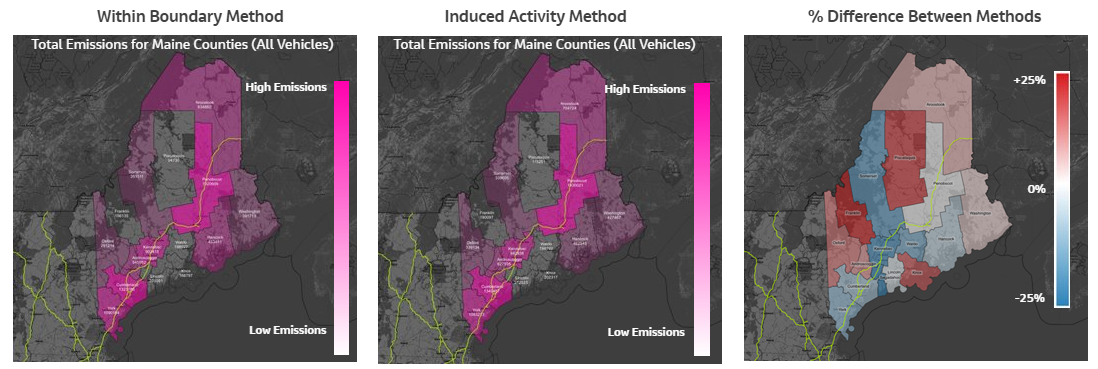
In the above example, StreetLight measures county-by-county emissions in Maine using these two different methodologies, and visualize the difference between the two methods in the map on the right. Looking at these methodologies side-by-side, several notable insights emerge:
- Kennebec and Sagadahoc counties have lower emissions — 7% and 25% lower, respectively — when using the Induced Activity Method because they have more pass-through traffic on major highways that may be outside local county influence, but important to statewide planners.
- Knox, Franklin, and Piscataquis counties have higher emissions — 21%, 22%, and 22% higher, respectively — when using the Induced Activity Method because they have a significant amount of VMT from transboundary trips that start or end in these counties.
- Counties with a large positive change (red) are typically counties that are the origin or destination of long trans-county (EI or IE) trips because they:
- Attract traffic from elsewhere in the region
- Are home to communities that need to travel to other regions to access services or employment
- And/or don’t have much passthrough traffic
- Counties with a large negative change (blue) are typically counties that see a lot of passthrough traffic relative to total traffic. These are often counties with major highways.
These differences shed light on why different jurisdictions might want to understand baseline GHG according to these two methodologies, such as differing amounts of commuter traffic, induced demand, or highway traffic passing through the region. Whichever methodology an agency chooses for a given analysis, the ability to segment trips based on origin and destination data is key.
Zero in on Emissions Hotspots
Most emissions measurements are calculated at the regional level for an entire state, county, or city. But zeroing in on specific roads and even segments of roads can help pinpoint major sources of emissions that could be solved with targeted infrastructure or policy changes.
In the example below, we measure emissions at the road segment level for Marin County, CA, in the Bay Area, revealing an emissions hotspot on Richmond Bridge that is a major route between the East Bay and Marin County.

StreetLight’s GHG Emissions Metrics show segment-level emissions on highways in Marin County, CA. A high-emissions segment shows up in yellow on Richmond Bridge, revealing the emissions impact of this traffic bottleneck.
Emissions are lower on either side of the bridge, where vehicles can disperse, but as traffic becomes congested over the bridge, this segment generates an outsized impact on local emissions.
When agencies and consultants have access to segment-level insights like these, they can develop targeted mitigation strategies that supplement broader initiatives like electrification planning or active transportation projects. For Marin County, reducing congestion on Richmond Bridge could alleviate a significant contributor to jurisdictional emissions.
Measure Emissions Reduction from Electric Vehicles and Hybrid Vehicles
Encouraging the adoption of electric vehicles (EVs) and Plug-in Hybrid Electric Vehicles (PHEVs) is central to many national, state, and city decarbonization plans. Quantifying the total avoided tailpipe emissions from these vehicles can help agencies win funding and gain public support for electrification initiatives, giving them more traction and amplifying their impact.

StreetLight’s GHG Emissions Metrics allow agencies and consultants to view avoided tailpipe emissions based on VMT and market penetration rates for EVs and PHEVs in a given area.
In Maine, for example, StreetLight’s GHG Emissions Metrics show York, Cumberland, and Penobscot counties see the biggest reductions from EV penetration, most likely because they contain population centers such as Portland and Bangor. Cumberland County avoided 13,196 mt CO₂-eq in 2022 due to relatively high VMT and market penetration of EVs and plug-in electric hybrids (PHEVs). Penobscot County, on the other hand, had very similar VMT to York County (2.87B compared to 2.66B), but Penobscot avoided only 4,122 mt of CO₂-eq due to lower EV and PHEV penetration. Penobscot’s EV penetration rate is just a third of that in York County.
The advantages of electrification may seem obvious, but quantifying the positive impact of EVs and PHEVs over time can speed the path to net zero goals by making these advantages concrete and persuasive. Agencies can use these analyses to win federal funding for new charging stations or electric bus fleets, encourage the public to use EVs, or foster public-private partnerships with electric utilities and charging station manufacturers.
Measuring the impact of EVs over time is also key for public agencies to understand how far they’ve progressed toward decarbonization goals and course correct if the pace of change is falling behind.
Distinguish Between Personal Vehicle and Commercial Vehicle Emissions
Although light-duty cars and trucks account for 87% of all vehicle miles traveled in the U.S.,1 they contributed just 58% of the greenhouse gas emissions from transportation in 2021. By contrast, medium- and heavy-duty trucks accounted for 23% of GHG emissions, beating out aircraft, rail, and other forms of transportation and generating an outsized impact on atmospheric carbon levels.2
That means in order to accurately measure GHGs from local transportation, it’s important to understand how many vehicle miles traveled are generated by light-duty vehicles vs. medium- and heavy-duty vehicles. Likewise, segmenting GHG emissions by vehicle weight helps agencies identify where decarbonization strategies specifically targeting commercial vehicles — such as policies and programs that encourage private and public fleet electrification — may be impactful.

StreetLight’s GHG Emissions Metrics show the proportion of total emissions produced by light-, medium-, and heavy-duty vehicles for counties in Maine.
For example, in Maine, a county-by-county breakdown of emissions share by vehicle type reveals a few key insights:
- Throughout Maine, light-duty traffic generates the bulk of emissions.
- Somerset (13.7%), Penobscot (13.2%), and Androscoggin (12.5%) have the highest shares of emissions from heavy-duty traffic out of the 14 counties studied.
- In Cumberland (9.6%) and Oxford (9.3%) counties, medium-duty vehicles contribute roughly 9% of total vehicle emissions, the highest rates among the 14 counties studied.
For more information on turning GHG measurements into effective decarbonization strategies, download our Transportation Climate Data Guide.
To learn more about StreetLight’s GHG Emissions Metrics, with regional and segment-level granularity, emissions avoided metrics, and personal vs. commercial vehicle impacts, check out our Transportation Climate Solutions.
1. Center for Sustainable Systems, University of Michigan. 2022. “Personal Transportation Factsheet.” Pub. No. CSS01-07.
2. United State Environmental Protection Agency. “Fast Facts on Transportation Greenhouse Gas Emissions.” June 13, 2023.